


Limited access to healthy food retailers may contribute to the high prevalence of obesity and chronic disease in the USA(Reference McLeroy, Bibeau and Steckler1). Supermarkets and grocery stores are typically considered retailers of healthy foods, as these stores have been shown to sell a larger selection of affordably priced, healthier food items compared with smaller food stores(Reference Glanz, Sallis and Saelens2). However, multiple systematic reviews have documented disparities in access to healthy food retailers(Reference Walker, Keane and Burke3,Reference Larson, Story and Nelson4) . According to the US Department of Agriculture, 6·2 % of the US population resides in a census tract that is classified as a food desert, meaning it is both low-income and has limited access to healthy food retailers(5). Prior systematic reviews have found mixed results regarding the association between various measures of access to healthy food retailers and dietary behaviour(Reference Caspi, Sorensen and Subramanian6) and weight(Reference Cobb, Appel and Franco7), although no known studies have examined variation in these outcomes by food desert status at a national scale. One prior study from South Carolina suggests that such differences may exist(Reference Sohi, Bell and Liu8) and could be explored on a national scale. Such research may assist in interpreting descriptive analyses of the food shopping and dietary behaviours of food desert residents(Reference Dubowitz, Zenk and Ghosh-Dastidar9,Reference Ma, Sharpe and Bell10) and assist public health practitioners with targeting interventions to improve local food environments as a chronic disease prevention strategy.
Methods
The current secondary analysis used data from the National Home Environment Survey, an online survey commissioned by the Emory Prevention Research Center to characterize the home food environments of US adults. The survey was administered in autumn 2015 by Lightspeed (http://www.lightspeedresearch.com/), an online market research firm which maintains a panel of over 5·5 million respondents in forty-five countries.
Eligible participants were adults aged 18–75 years living in the USA and who were able to read English. The study used recruitment quotas to ensure the demographic, socio-economic and geographic distribution of the sample reflected that of the overall US population. Matching variables used for the recruitment quotas included age, gender, race/ethnicity, geographic region and annual household income. Lightspeed identified panellists meeting eligibility criteria and sent survey invitations by email. Participants who provided informed consent and completed the 30 min survey received compensation provided by Lightspeed. A total of 12 396 individuals consented to participate in the study; reasons for not completing the survey included not meeting a recruitment quota (n 3811, 30·7 %), discontinuation of the survey (n 2994, 24·2 %) and termination by Lightspeed due to in-survey quality violations (n 649, 5·2 %).
Of the 4942 respondents, 75·0 % were included in the current analysis; participants were excluded if they reported no involvement with grocery shopping for the household (16·1 %), reported fruit and vegetable intake that exceeded three times the standard deviation added to the interquartile range (3·9 %), and inability to geocode the residential address to a census tract to determine its food desert status (2·1 %). Less than 3 % of the sample was excluded due to missing data; missingness was associated with younger age, male sex, Asian race, single or widowed/separated/divorced marital status, earning in the $US 15 000–49 000 range, living with others, not being on food stamps, and living in a small town or suburban area. The Emory University Institutional Review Board approved all study procedures.
Residence in a food desert was determined by geocoding participants’ residential addresses using Google Earth Pro, joining them to census tracts in ArcMap 10.5.1 (ArcGIS Desktop: Release 10) and matching them to the US Department of Agriculture’s Food Access Research Atlas. This Atlas designates census tracts as food deserts if they are low-income (poverty rate ≥20 % or median family income <80 % of either the state or metropolitan-area median income) and low-access (≥500 people or 33 % of population living either 1·61 km (1 mile; urban) or 16·1 km (10 miles; rural) from the nearest supermarket, supercentre or large grocery store)(5).
The survey was self-administered online and included seventy-five questions and periodic quality check questions. Involvement with grocery shopping was determined by asking who the primary food shopper for the household is. Respondents were included in the analysis if they indicated that they were the primary food shopper, that they take turns with someone else or go with someone else; those who indicated that their spouse/partner, parent/parent-in-law or someone else was the primary shopper were excluded.
Perceived access to healthy foods was measured by summing participants’ responses to six items assessing quality, selection, and ease of purchasing fruits and vegetables and low-fat products in their neighbourhood on a five-point Likert scale (from 1 = ‘strongly disagree’ to 5 = ‘strongly agree’, range = 6–30)(Reference Echeverria, Diez-Roux and Link11).
Store type was assessed with a single item asking participants to think about the place where the primary food shopper(s) for the household shops most frequently for groceries and to indicate the store type. Response options were ‘large chain grocery store’, ‘smaller grocery store’, ‘superstore or supercentre’ (e.g. Wal-Mart or Target), ‘warehouse club store’ (e.g. Sam’s Club or Costco), ‘dollar store’, ‘convenience store with or without a gas station attached’ (e.g. 7-Eleven or mini-market), ‘farmers’ market or co-op’ or ‘specialty store’ (e.g. an ethnic specialty store, meat market, seafood market, greengrocer or bakery). Frequency of grocery shopping was assessed by asking the respondent how many times per month the primary food shopper usually shops at that store. Responses were categorized into >4 times/month, 4 times/month or <4 times/month for analyses. Distance from store to home was measured by asking, ‘About how many miles is this store from your home?’ Respondents recorded an open integer representing the number of miles. Amount spent per trip was assessed by asking how much the primary food shopper(s) usually spend on food each time they shop at the store, including all methods of payment (e.g. cash, electronic benefit transfer/food stamps, debit/credit card). Response options were <$US 25, $US 25–49·99, $US 50–74·99, $US 75–99·99, $US 100–149·99, $US 150–199·99 or ≥$US 200.
Fruit and vegetable consumption was measured using an eighteen-item screener asking about frequency and quantity of consumption of nine type of fruits and vegetables(Reference Thompson, Subar and Smith12). Dietary fat intake as a percentage of total daily energy intake was estimated using a brief screener assessing frequency of consumption per week of fifteen food items(Reference Thompson, Midthune and Subar13). BMI (kg/m2) was calculated from self-reported height and weight.
Propensity score analysis using inverse probability of treatment-weighted regression was the analytic approach. This method is commonly used in observational research to at least partially account for systematic differences between the exposed and unexposed groups due to non-random assignment mechanisms by creating a pseudo-population that is better balanced on observed characteristics linked to group membership(Reference Austin14). Propensity scores were generated by performing the regression of an indicator variable for residence in a food desert or not v. the following theoretical confounders: age, gender, race, marital status, employment status, education, income, indicator variables for living alone and presence of children in the home, car ownership, receipt of Supplemental Nutrition Assistance Program (SNAP) benefits and rurality. The inverse of the propensity scores (i.e. inverse probability of treatment weights) were used as weighting variables to account for systematic differences in food desert residents and non-food desert residents. Data were analysed with the statistical software package SAS version 9.4 using the GENMOD, SURVEYREG and SURVEYLOGISITIC procedures to account for these weights and produce robust standard errors.
Results
Relatively few respondents lived in a food desert (11·1 %; Table 1). The sample tended to be middle-aged (mean age = 45·5 (sd 15·18) years), female (57·0 %) and White (66·7 %). Most were employed for wages or self-employed (54·8 %) and had a college degree or higher (49·4 %). The majority (73·6 %) lived with at least one other person in the home and 34·8 % had at least one child living at home. Just over 14 % of respondents reported receiving SNAP benefits. Most lived in suburban (42·6 %) or urban (28·2 %) areas, and the majority owned a car (90·9 %).
Table 1 Demographic, socio-economic and geographic characteristics of primary food shoppers in the USA by food desert status, 2015
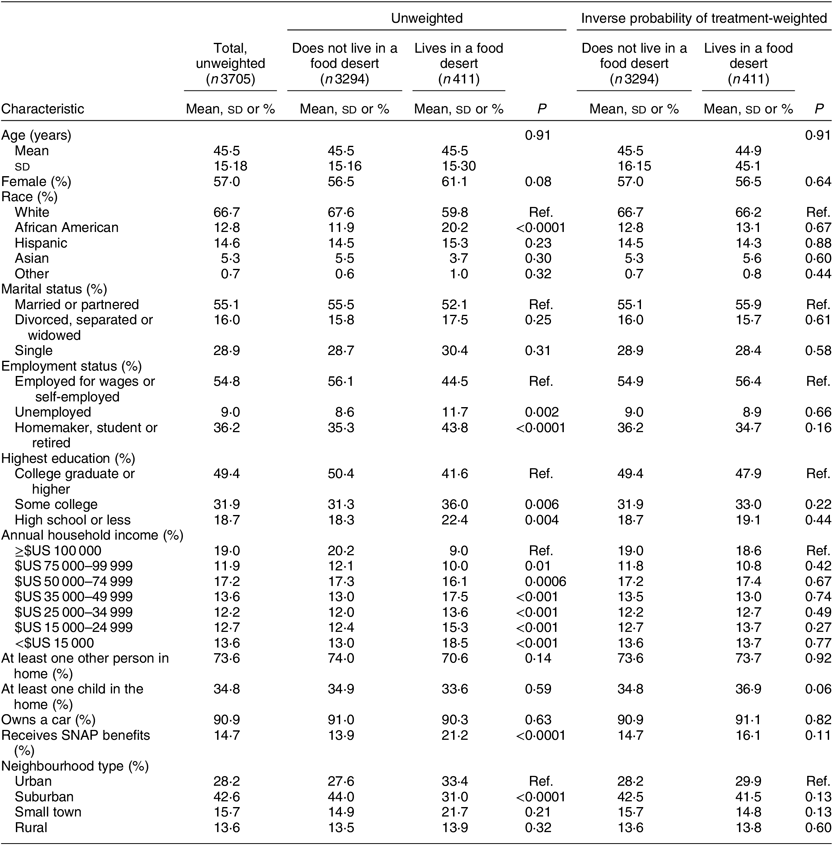
SNAP, Supplemental Nutrition Assistance Program; ref., reference category.
Bivariate associations between residence in a food desert and outcomes were generated using unadjusted linear, binary logistic and multinomial logistic regression models, depending on the dependent variable type.
In bivariate analyses prior to applying the inverse probability of treatment weights, food desert residents were more likely to be African American (P < 0·0001), to be unemployed (P = 0·002), more likely to have some college (P = 0·006) or high school or less (P = 0·004), to report lower household income levels and to report receiving SNAP benefits (P < 0·0001). Food desert residents were less likely to report living in suburban areas (P < 0·0001). After applying inverse probability of treatment weights, there were no significant differences between food desert and non-food desert residents in demographic, socio-economic or geographic characteristics (Table 1).
The majority of respondents reported primarily shopping at a large grocery store (53·5 %) or superstore/supercentre (27·3 %; Table 2). Few respondents reported primarily shopping at a dollar store or convenience store (1·2 %). The primary store was located a mean of 8·6 (sd 12·10) km (5·4 (sd 7·52) miles) from the respondent’s home. Most respondents shopped for groceries fewer than 4 times/month (35·2 %) and spent $US 50–99·99 each trip (37·1 %). Mean perceived access to healthy foods score was 22·1 (sd 6·25). Respondents reported eating a mean of 2·5 (sd 2·02) daily servings of fruits and vegetables, consumed a mean of 34·6 (sd 4·64) % of their total daily energy intake from dietary fat and had a mean BMI of 27·8 (sd 6·84) kg/m2.
Table 2 Perceived access to healthy foods, grocery shopping practices, diet and BMI stratified by residence in a food desert among primary food shoppers in the USA, 2015

Ref., reference category.
P values were generated by performing the regression of each dependent variable v. an indicator variable for residence in a food desert or not. Linear regression was used for the following outcomes: perceived access to healthy foods, fruit and vegetable intake, dietary fat intake and BMI. Poisson regression was used for distance from home to primary store. Multinomial logistic regression was used for primary store type, frequency of grocery shopping and dollar amount spent per shopping trip. Robust standard errors were used for the weighted regression analyses to account for the inverse probability of treatment weights.
* 1 mile ≈ 1·61 km.
† The categories for farmers’ market, co-op or specialty store and dollar store or convenience store were omitted from the models due to sparse data.
In inverse probability of treatment-weighted models, food desert residents were more likely to shop at a superstore or supercentre v. a large grocery store (OR = 1·32; 95 % CI 1·02, 1·71; P = 0·03) and had higher BMI (b = 1·14; 95 % CI 0·36, 1·93; P = 0·004) relative to non-food desert residents (Table 2). Food desert residents did not report significantly different perceived access to healthy foods, frequency of grocery shopping, distance from home to primary store, dollar amount spent per shopping trip, fruit and vegetable intake or dietary fat intake, relative to non-residents.
Discussion
The present study found that although residence in a food desert was significantly associated with the most frequently used grocery store type and BMI, it was not significantly associated with perceived access to healthy foods, other grocery shopping practices or dietary behaviour among primary food shoppers in the USA, after accounting for systematic differences in the characteristics of the populations who live in food deserts v. non-food deserts. This finding is surprising, given that it contradicts social ecological frameworks of health promotion which suggest that community-level factors are important determinants of health behaviours(Reference McLeroy, Bibeau and Steckler1). Additionally, these findings contradict those from similar studies which found that food shopping behaviours vary by community-level access to healthy foods(Reference Sohi, Bell and Liu8) and food security(Reference Ma, Liese and Hibbert15), although these studies were conducted among specific geographic areas and are not directly comparable to this national study.
Recently, critiques of the food desert concept have emerged in the peer-reviewed literature(Reference Widener16–Reference Hill18). These articles suggest that determining access to healthy foods in geographic areas defined by arbitrary administrative boundaries may overlook other important dimensions of access, including the quantity, quality and affordability of products sold within these stores and local community-led solutions to increase access to healthy foods(Reference Krukowski, McSweeney and Sparks19). Replications of the present study using other innovative approaches to measuring the community food environment, including the use of activity spaces, multidimensional measures of access that account for in-store food environments and the Centers for Disease Control and Prevention’s healthier food retail tracts, would advance this area of research.
Strengths of the present study include that it is the first known analysis to use residence in a food desert as an independent variable among a national sample, as well as the first known application of propensity score analysis within this content area. Limitations include that the data are cross-sectional, limiting causal inference, and that US adults without Internet access would have been systematically excluded from this study. Additionally, as Lightspeed’s methods of recruiting its underlying panel are unavailable, we have limited ability to conclude that these results represent or generalize to the broader US population. Despite these limitations, these findings add to the growing literature assessing the relationship between access to healthy food retailers and chronic disease-related outcomes.
Conclusions
Results suggest that food desert residents shop at different food stores and have higher BMI than non-food desert residents, although there was no evidence to support that the two groups differed on other grocery shopping characteristics or dietary behaviours. Future research using innovative, multidimensional conceptualizations of access to healthy foods are needed to better understand how community food environments influence health.
Acknowledgements
Acknowledgements: The authors wish to thank the participants in this study. Financial support: This study was funded by the Dean’s Office at the Emory University Rollins School of Public Health, which had no additional role in the design, analysis or writing of this article. Conflict of interest: None. No financial disclosures were reported by the authors of this paper. Authorship: R.C.W. conceptualized the research question, conducted the analyses and authored the paper. R.H. assisted with data analysis. I.G.R. and A.H. assisted with conceptualizing the study, interpreting the results and revising the manuscript. M.K. conceptualized and oversaw the study, assisted with interpreting the results and revising the manuscript. Ethics of human subject participation: This study was conducted according to the guidelines laid down in the Declaration of Helsinki and all procedures involving human participants were approved by the Emory University Institutional Review Board. Written informed consent was obtained from all participants.


