


The increasing burden of obesity and non-communicable diseases worldwide makes it necessary to develop cost-efficient public policies to reduce their prevalence( 1 ). These policies should take into account the characteristics of the food environment, as it strongly affects food choice and dietary patterns( Reference Story, Kaphingst and Robinson-O’Brien 2 ). In most countries, the food environment is characterized by the large availability and affordability of products with high energy, fat and sugar content, which promote positive energy balance in the population( Reference Zobel, Wansen and Rossing 3 , Reference Popkin, Adair and Ng 4 ). In particular, the replacement of foods prepared from scratch by processed ready-to-eat products with unfavourable nutrient profile has been linked to low diet quality, obesity and other non-communicable diseases( Reference Juul and Hemmingsson 5 – Reference Tavares, Fonseca and Garcia Rosa 9 ).
The relationship between the consumption of processed products, nutrient intake and health motivated the development of the NOVA system, which classifies foods based on the extent and purpose of industrial processing( Reference Monteiro, Cannon and Levy 10 ). This system classifies foods into four groups: unprocessed of minimally processed foods, processed culinary ingredients, processed foods and ultra-processed products. Ultra-processed products are defined as formulations of several ingredients, including salt, sugar, oils and fats, as well as flavourings, colorings, sweeteners, emulsifiers and other additives, which typically have high sugar, salt, sodium and saturated fat content( Reference Martínez Steele, Baraldi and Louzada 11 – Reference Giménez, de Saldamando and Curutchet 14 ). These products are sometimes marketed as healthful, as references to naturalness and health/nutrition claims are frequently included on their packages and in advertising campaigns( Reference Colby, Johnson and Scheett 15 , Reference Schermel, Emrich and Arcand 16 ). Ultra-processed products have become dominant in the global food system due to their higher commercial profits over fresh or minimally processed foods( Reference Luiten, Steenhuis and Eyles 12 , Reference Monteiro, Moubarac and Cannon 17 , Reference Ludwig and Nestle 18 ). In the specific case of Latin America, the contribution of ultra-processed foods to total daily energy intake has increased markedly in the last 10 years in most countries( 19 ). This situation makes it necessary to develop strategies to inform consumers of the nutritional value of ultra-processed products and to substitute these products by foods and meals made from unprocessed or minimally processed foods (foods that are processed to extend their shelf-life, improve their safety or simplify their preparation, but that do not contain added salt, sugar or fat)( Reference Monteiro, Cannon and Levy 10 , 13 , Reference Monteiro, Moubarac and Cannon 17 ).
The inclusion of nutrition information on packages may raise consumer awareness of the unfavourable nutritional composition of ultra-processed products and, consequently, lead to a decrease in their purchase intention. Given that ultra-processed products have partially replaced meals prepared from scratch( Reference Moubarac, Martins and Claro 7 , Reference Monteiro, Cannon and Levy 10 , Reference Monteiro, Moubarac and Cannon 17 , 19 ), a decrease in consumer purchase intention can be hypothesized to encourage their substitution by unprocessed or minimally processed products. However, conventional nutrition information that is typically found on the back of packages has been extensively reported to cause confusion and to be difficult to find, use and understand( Reference Cowburn and Stockley 20 – Reference Sharf, Sela and Zentner 22 ). For this reason, the inclusion of simplified front-of-pack (FOP) nutrition information has been suggested as an effective way to provide consumers with simple and clear information that can be used in the short time frames usually involved when making their food choices( Reference Hawley, Roberto and Bragg 23 – Reference Jones and Richardson 26 ).
FOP nutrition information schemes can be classified into three main groups according to the degree to which they guide consumers to infer product healthfulness( Reference Hodgkins, Barnett and Wasowicz-Kirylo 27 ). Non-directive systems (e.g. Guideline Daily Amount (GDA) system) include information about nutrient content (per portion or 100 g) and/or as a percentage of the recommended daily intake. Semi-directive systems (e.g. traffic-light system) provide information about the content of key nutrients and indicate whether they are low, medium or high. Finally, directive systems (e.g. health and warning logos) highlight only those products that meet specific criteria in terms of nutrient content. Research has shown that, compared with non-directive systems, directive and semi-directive systems improve consumers’ ability to identify and correctly evaluate how healthful products are( Reference Feunekes, Gortemaker and Willems 24 – Reference Jones and Richardson 26 , Reference Roberto, Shivaram and Martinez 28 – Reference Aschemann-Witzel, Grunert and van Trijp 32 ). In particular, several studies have identified the traffic-light system as the best scheme in terms of understanding and attentional capture( Reference Ares, Giménez and Bruzzone 25 , Reference Jones and Richardson 26 , Reference Kelly, Hughes and Chapman 29 – Reference Gorton, Ni Mhurchu and Chen 33 ). This system uses traffic lights’ colour coding (red, yellow and green) to classify the content of key nutrients (sugar, fat, saturated fat and salt) as high, medium or low, respectively( 34 ). The red colour of this system, associated with high sugar, fat, saturated fat and/or salt, may convey culturally learned associations with danger and avoidance, which may discourage consumption of unhealthful products( Reference Genschow, Reutner and Wänke 35 ). Although studies conducted under laboratory settings have shown that the traffic-light system could encourage changes in food choice, in-store observations or consumption data have shown less encouraging results( Reference Borgmeier and Westenhoefer 30 , Reference Hieke and Wills 36 – Reference Ni Mhurchu, Volkova and Jiang 40 ). However, it is worth highlighting that only a limited number of studies have evaluated the influence of the traffic-light system or other nutrition information schemes on consumer purchase behaviour in real-life settings( Reference Sacks, Rayner and Swinburn 37 , Reference Sacks, Tikellis and Millar 38 ).
Drawing from the health literature and the effectiveness of health warnings in tobacco control campaigns, Chile has recently approved a new directive FOP nutritional labelling scheme to improve consumer ability to identify unhealthful food products( Reference Corvalán, Reyes and Garmendia 41 ). According to the Chilean regulation, products with high energy, sodium, sugar and/or saturated fat content must include a separate stop-sign-shaped black warning notice for each nutrient( 42 ). Although this system is expected to discourage consumers from buying products with high energy, sodium, sugar and/or saturated fat content, no studies to date have compared this warning notice scheme with other nutrition information schemes.
In this context, the aim of the present work was to evaluate the influence of two FOP nutrition information schemes (traffic-light system and Chilean warning system) on the purchase of ultra-processed foods in a simulated online environment.
Materials and methods
Participants
A total of 437 people from Montevideo (Uruguay) participated in the study. Participants were recruited from the consumer database of the research group who led the study and a Facebook advertisement. To be eligible, participants had to be responsible for food purchase in the household, at least occasionally. The consumer sample did not intend to be representative of the Uruguay population but to include people in charge of food purchase with diversity in terms of gender and age. During recruitment, no information regarding the specific objective of the study was given. Participants were told that they had been invited to participate in a study about perception of food products. All participants gave written informed consent before starting the study and were entered into a raffle for a voucher valued at $US 100.
Stimuli
A shopping simulation was created using a website that emulated an online grocery store, specifically created for the study. A total of 232 products, grouped into seventeen categories, were included. The categories were selected considering the usual distribution of products in Uruguayan supermarkets and online grocery stores. Products within each category were selected based on commercial availability and purchase frequency in the country( Reference Bove and Cerruti 43 ). For the majority of products, different brands were included. Although the number of products included in the website was markedly lower than the number of products available in most Uruguayan supermarkets, it provided a wide overview of the main product categories commonly purchased by Uruguayan consumers( Reference Muller and Ruffieux 44 ). The number of products included in other studies dealing with shopping simulations ranges between seventy-eight and 273( Reference Borgmeier and Westenhoefer 30 , Reference Muller and Ruffieux 44 ).
The nutritional composition and pictures of packaged products were obtained from commercial products available in the Uruguayan marketplace. Each product was labelled with the price and the nutrition information, according to the experimental condition each participant was allocated to. According to Uruguayan legislation, products that are commercialized unpackaged (e.g. meats, fruits and vegetables), mineral water, infusions or spices do not include nutrition information( 45 ). For this reason, the traffic-light and warning systems were not included in those product categories. A description of the categories and products as well as the percentage of products within each of the categories of the NOVA food classification system( Reference Monteiro, Cannon and Levy 10 ) are provided in Table 1. Figure 1 shows a screenshot of the online grocery store.
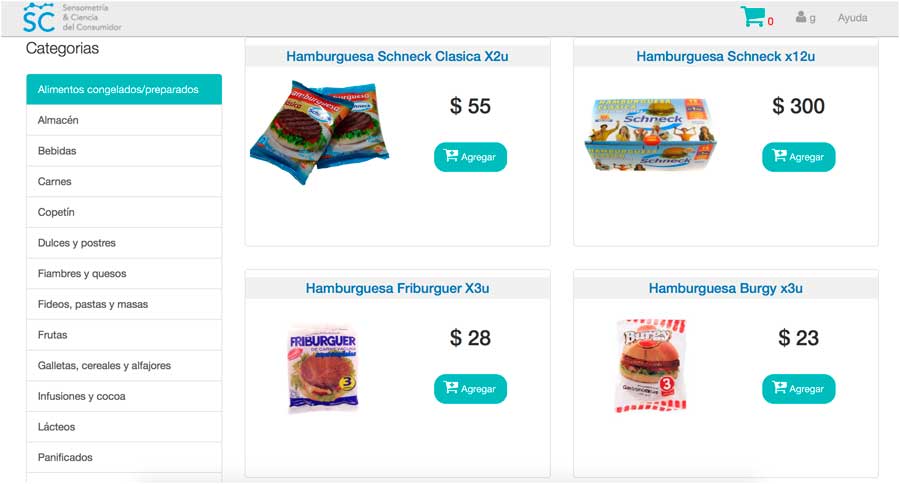
Fig. 1 Screenshot of the online grocery store used in the simulated shopping experiment, showing examples of products as seen by the participants who completed the task without nutrition information. Food categories are shown on the left and some of the products included in one of the categories (‘Frozen foods/ready-to-eat meals’) are shown on the right using the name of the product, a picture and its price
Table 1 Description of the categories and products included in the simulated online grocery store
* Following Uruguayan legislation, nutrition information was not included on products that are commercialized unpackaged (e.g. meats, fruits and vegetables), mineral water, infusions and spices( 45 ).
Three experimental conditions were considered: (i) a control condition with no nutrition information; and two nutrition information schemes, namely (ii) a traffic-light system and (iii) the Chilean warning system. Both systems included energy (calorie), saturated fat, sugars and salt content per portion. The traffic-light system was colour coded and included text descriptors to classify nutrient content as low, medium and high (Fig. 2(a)), whereas the Chilean warning system highlighted only those products with high nutrient content using separate black stop signs for each nutrient (Fig. 2(b)). Conventional nutrition information, which is mandatory nowadays in Uruguay( 45 ), was not made available across experimental conditions because it is not included on the front of packages and it has been widely reported to be difficult for consumers to understand( Reference Cowburn and Stockley 20 – Reference Grunert and Wills 21 , Reference Ares, Giménez and Bruzzone 25 , Reference Jones and Richardson 26 ).
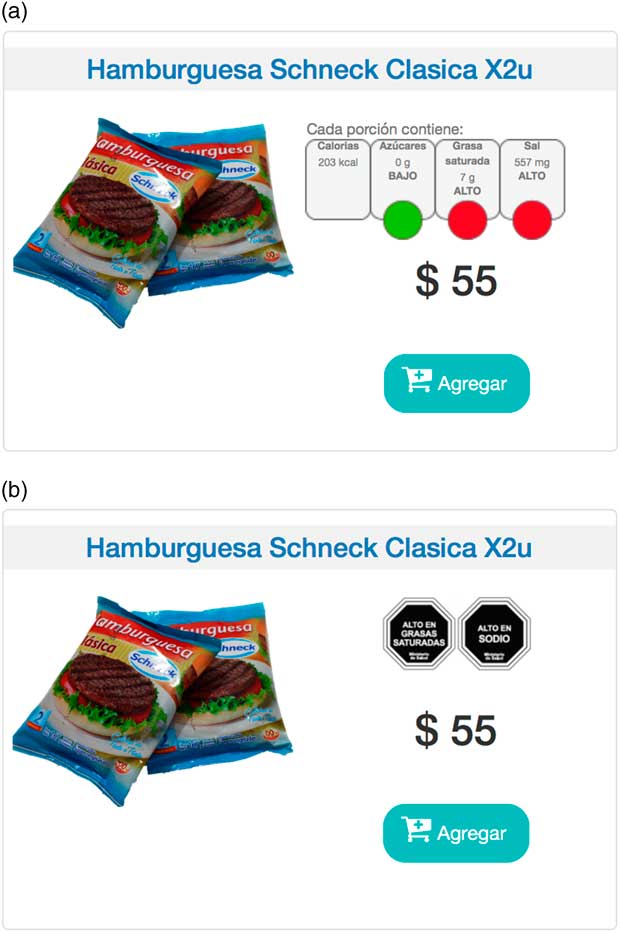
Fig. 2 Example of how nutrition information was presented on the products using the traffic-light system (a) and the Chilean warning system (b)
The criteria for classifying nutrient content as high in the traffic-light and warning systems were based on Chilean regulations( 42 ). Given that these regulations establish criteria only for high nutrient content, low nutrient content in the traffic-light system was determined based on the criteria from the Food Standards Agency (UK)( 34 ). In order to avoid misleading information, the traffic-light system included a classification of energy content only when it was high. The percentage of products with high content of each of the nutrients ranged between 23 and 30 % (24 % high in energy, 23 % high in sugars, 27 % high in saturated fat and 30 % high in salt).
Experimental procedure
Participants were randomly assigned to one of the three experimental conditions described in the previous section: no nutrition information (n 141), traffic-light system (n 153) or the Chilean warning system (n 143). Randomization was automatically generated by the software and was blinded to the researchers during the study.
Participants were asked to imagine that they had to make a weekly food purchase for their household using the website of an online grocery store. They were explained that products were grouped into categories and that they could go through the products included in each category by making a mouse click on the category name. They were asked to select all the products they would buy by clicking on the ‘Add’ button of each product. Once they had finished their purchase they were instructed to click on the shopping cart symbol at the top of the website to review the purchase and submit their response.
Data analysis
The minimum number of participants to be included in the study was calculated a priori based on the difference between two groups in the percentage of ultra-processed products (which was considered the primary outcome of the study). The effect size, calculated as the ratio between the difference in the average value between two experimental conditions and the standard deviation, was estimated as 0·5. A minimum sample of sixty-four participants for each experimental condition was obtained considering a significance level of 5 % (two-sided) and a power level of 80 %.
For each participant, the percentage of purchased products within each of the categories of the NOVA food classification system (natural or minimally processed, culinary ingredients, processed products and ultra-processed products) was calculated. The total expenditure in each of the NOVA categories was also calculated for each participant and expressed in US dollars and as a percentage of the total expenditure. For each participant, the total expenditure (expressed in US dollars) in each of the product categories available in the online grocery store (described in the first column of Table 1) was also calculated.
Additionally, the percentage of products containing high content of each of the key nutrients (energy, sugar, saturated fat and salt) purchased by each participant was also determined, as well as the average content of the key nutrients in 100 g of the products.
Differences in the dependent variables among the experimental groups were evaluated using ANOVA considering a 95 % confidence level. When differences were significant, Fisher’s test was used for post hoc comparison of means. Data analyses were performed in R software( 46 ).
Results
A description of the sociodemographic characteristics of the participants is shown in Table 2. Compared with the general population of Uruguay, the consumer sample was skewed towards women and young consumers. No significant differences in sociodemographic characteristics were found between the three groups of participants who completed the study using the different experimental conditions (P=0·725 for gender, P=0·114 for age, P=0·283 for educational level, P=0·887 for number of people in the household, P=0·913 for number of children in the household, P=0·311 for responsibility for food purchase in the household).
Table 2 Sociodemographic characteristics of the participating adults aged 18–77 years (n 437), Montevideo, Uruguay
Simulated purchase of the NOVA food categories
Table 3 shows the mean share of the simulated food purchases of the four NOVA food categories in terms of relative number of products and expenditure for the three experimental groups. Ultra-processed products accounted for 34·8–36·6 % of the purchased items and 34·8–36·1 % of the expenditure. Meanwhile, 40·7–42·9 % of the purchased products corresponded to natural and minimally processed products, which accounted for 42·7–43·6 % of the expenditure. No significant differences between the three experimental conditions were found in the share of purchased items and expenditure that corresponded to each of the four NOVA categories (Table 3).
Table 3 Mean share (and 95 % CI) of simulated purchase of the four NOVA food categories, in terms of number of products and expenditure, for participants who completed the task in the control condition (without nutrition information) and with two front-of-pack nutrition information schemes (traffic-light system and Chilean warning system)

* The P value for the comparison of experimental conditions using ANOVA is shown. Mean values for a NOVA food category within a column were not significantly different according to ANOVA (P>0·05).
When total expenditure for each of the product categories available in the simulated online grocery store was considered, no significant differences were established between the three experimental conditions (for all categories P value was higher than 0·12). The only exception was found for the subgroup ‘Sweets and desserts’ within the ultra-processed products category. The average total expenditure for this subgroup was significantly lower (P=0·037) when the Chilean warning system was considered compared with the control condition ($US 2·93 v. 3·11). Total expenditure for ‘Sweets and desserts’ in the traffic-light system condition did not significantly differ from that in the control condition and the Chilean warning system ($US 3·02).
Nutritional composition of the purchased items
As shown in Table 4, the average energy density and the content of sugar, saturated fat and salt of the products selected by participants in the simulated purchase task were not significantly modified by the inclusion of nutrition information. In addition, the percentage of products high in each of the four key nutrients purchased by participants in the simulated task did not differ significantly between the three experimental conditions (P=0·43 for products high in energy, P=0·13 for products high in sugar, P=0·52 for products high in fat, P=0·88 for products high in salt). As shown in Fig. 3, approximately 25 % of the products purchased by participants were high in energy, saturated fat and/or salt, regardless of whether they completed the simulated purchase task with or without nutrition information. Meanwhile, between 11·2 and 14·0 % of the products purchased by participants in the simulated task were high in sugar.
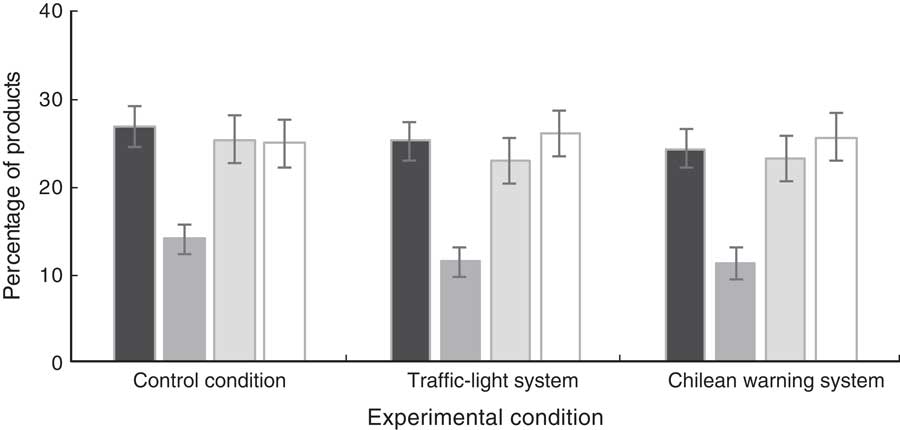
Fig. 3 Mean percentage of products high in key target nutrients (![]() , high in energy (calories);
, high in energy (calories); ![]() , high in sugar;
, high in sugar; ![]() , high in saturated fat;
, high in saturated fat; ![]() , high in salt) for participants who completed the task in the control condition (without nutrition information) and with two front-of-pack nutrition information schemes (traffic-light system and Chilean warning system). Vertical bars correspond to Tukey’s honestly significant differences (P=0·05)
, high in salt) for participants who completed the task in the control condition (without nutrition information) and with two front-of-pack nutrition information schemes (traffic-light system and Chilean warning system). Vertical bars correspond to Tukey’s honestly significant differences (P=0·05)
Table 4 Mean nutritional composition (and 95 % CI) of the products purchased by participants who completed the task in the control condition (without nutrition information) and with two front-of-pack nutrition information schemes (traffic-light system and Chilean warning system)
To convert energy density to kJ/100g, multiply kcal/100 g values by 4·184.
* The P value for the comparison of experimental conditions using ANOVA is shown. Mean values within a column were not significantly different according to ANOVA (P>0·05).
Discussion
The present study aimed to evaluate the influence of two FOP nutrition information schemes on the purchase of ultra-processed foods in a simulated online grocery store. Results showed no significant effect of the traffic-light system and the Chilean warning system on participants’ intended purchase of any of the four NOVA categories or in any parameter related to the nutritional composition of the purchased products. Therefore, directive and semi-directive nutrition information schemes were not efficient at reducing intended purchase of ultra-processed products in this online simulation. This suggests that nutrition information may not be suited to cause drastic changes in purchasing patterns by encouraging replacement of ultra-processed products by natural or minimally processed products. However, in the present study, the traffic-light system and the Chilean warning system were also unable to encourage minor shifts in the nutritional composition of the products purchased in the online simulation. The only effect of the inclusion of nutrition information was related to a decrease in participants’ expenditure in one specific food category, ‘Sweets and desserts’, which was significantly lower when the Chilean warning system was included compared with the control condition.
Results from the present work are in agreement with those from other experimental studies that showed lack of influence of FOP nutrition information on intended food consumption( Reference Feunekes, Gortemaker and Willems 24 , Reference Borgmeier and Westenhoefer 30 , Reference Hieke and Wills 36 , Reference Dodds, Wolfenden and Chapman 39 , Reference Ni Mhurchu, Volkova and Jiang 40 ). These findings are similar to those by Sacks et al., which suggested that consumer food purchase of ready meals and sandwiches did not decrease 4 weeks after implementation of the traffic-light system in the UK( Reference Sacks, Rayner and Swinburn 37 ).
Two possible explanations for the lack of effect of nutrition information on consumer purchase of ultra-processed products and the nutritional profile of the purchased products can be considered. First of all, nutrition information is only one of several product characteristics that influence consumer food choices( Reference Köster 47 ), who can prioritize other product characteristics over healthfulness. In the specific case of ultra-processed products, convenience, tastiness, price, as well as emotional associations with the brand can be more relevant than their nutritional profile in shifting consumers’ intention to purchase. In particular, middle-income people in Uruguay have been reported to favour convenience over health-related factors, even if convenient products are perceived as less healthful and tasty than home-made products( Reference Ares, Machín and Girona 48 ). Similarly, Grunert and Willis argued that that the inclusion of FOP nutrition information is unlikely to discourage consumers from eating products they like, as hedonic aspects of food consumption have a large influence in shaping food choices( Reference Grunert and Wills 21 ). Therefore, even if directive and semi-directive nutrition information schemes can positively improve consumer understanding of the nutritional characteristics of products, they do not necessarily lead to a change in consumer intention to purchase. In this sense, it is important to stress that although former research has shown that self-reported use of nutrition information has been associated with more healthful dietary patterns, the casual relationship between these two variables has not been established yet( Reference Satia, Galanko and Neuhouser 49 – Reference Kreuter, Brennan and Scharff 51 ).
A second potential explanation for the lack of influence of nutrition information on consumer purchase of ultra-processed foods in the simulated online grocery store is related to fact that they may not be accustomed to using this information when making their food choices( Reference Grunert and Wills 21 ). Considering that most of our daily decisions are based on repetitive and automatic behaviours, FOP nutrition information may not change consumer choices during the first exposure. People may find it difficult to understand FOP nutrition information schemes upon first exposure without any previous explanation. In addition, people may need repeated exposures to this information to incorporate it in their decision-making strategies. For these reasons, the use of educational campaigns during the implementation of FOP information may be necessary to encourage consumers to search for this information on food packages and take it into account when making their food purchase decisions.
Despite these results, the lack of effect of FOP nutrition information on consumer food purchases does not mean that it should not be included on packages. Directive and semi-directive schemes have been extensively reported to increase consumer ability to find and understand nutrition information on food packages( Reference Cowburn and Stockley 20 – Reference Sharf, Sela and Zentner 22 , Reference Borgmeier and Westenhoefer 30 ), which in turn can enable them to make more informed choices. In this sense, it is important to highlight that few comprehensive studies have examined the effect of FOP nutrition information on consumers’ food choices( Reference Sacks, Rayner and Swinburn 37 ) and none has evaluated the impact of the Chilean warning system. Besides, the implementation of directive and semi-directive nutritional labelling schemes can encourage food companies to reformulate their products so as to differentiate themselves in the marketplace, as highlighted by Borgmeier and Westenhoefer( Reference Borgmeier and Westenhoefer 30 ). In addition, FOP nutrition information may have a larger effect on consumers’ food choices when combined with other public policies, such as regulations on the use of health claims, restrictions on food advertising, taxes on products with high sugar and fat content, as well as communication campaigns highlighting those policies( Reference Capacci, Mazzocchi and Shankar 52 ). The evaluation of the potential synergistic effect of these public policies deserves further attention to support decision making.
Limitations of the study
The limitations of the present work should be highlighted. First, the application of a simulated grocery store for studying consumer behaviour, and particularly the influence of nutrition information on food choice, is incipient( Reference Borgmeier and Westenhoefer 30 , Reference Muller and Ruffieux 44 ). The present study involved a simulated purchase situation in a virtual environment, which may not realistically depict a real shopping situation in which participants would have to eat the products they purchase. In particular, the reduced number of foods considered in the virtual grocery store could have contributed to the lack of influence of the nutrition information schemes, and there is a possibility that a wider selection of products could have led to differences between the experimental treatments. The assessment of the influence of nutrition information on consumer food choices should involve consumers’ repeated purchase of real products over an extended period of time using, for example, experimental grocery stores. This type of study could provide more rigorous information about the potential influence of FOP nutrition labelling schemes on consumers’ eating patterns.
Second, the study involved a consumer sample that was mostly composed of well-educated female participants and therefore the influence of sociodemographic characteristics on consumer reaction towards nutrition information could not be evaluated. Further studies aimed at evaluating the influence of different nutrition information schemes on specific gender, age, educational level and income groups, as well as consumer segments differing in other motivational and attitudinal variables, may provide valuable information.
Conclusions
Results from the present study provided little evidence to suggest that the traffic-light system or the Chilean warning system in isolation could be effective in reducing the purchase of ultra-processed foods, encouraging their substitution by natural or minimally processed products, or in improving the nutritional composition of food purchases. Further research is needed to confirm and extend the findings from the present work to other consumer populations.
Regarding the comparison of the traffic-light system and the Chilean warning system, although results from the present work suggest no clear superiority of one over the other, the Chilean system led to a small change in consumer intended purchase of one unhealthful food category. This suggests that the Chilean system may be a promising alternative to the traffic-light system. Further research comparing these two systems in terms of consumers’ ability to find and understand nutrition information is necessary.
Acknowledgements
Financial support: The authors are grateful to Comisión Sectorial de Investigación Científica and Espacio Interdisciplinario (Universidad de la República, Uruguay) for financial support. The funder had no role in the design, analysis or writing of this article. Conflict of interest: None. Authorship: All authors contributed to the development of the research. G.A. and L.M. analysed the data and wrote the paper. Ethics of human subject participation: This study was conducted according to the guidelines laid down in the Declaration of Helsinki and all procedures involving human subjects were approved by the Ethics Committee of the School of Chemistry of Universidad de la República (Uruguay). Written informed consent was obtained from all participants and formally recorded.


