


Worldwide, obesity and diabetes have increased since the 1980s( 1 , 2 ). In Australia, despite efforts by government and health agencies to reverse the trend, the burden of diet-related disease has remained substantially unchecked. Australia’s obesity rate is among the highest in the developed world and has continued to rise steadily in recent years despite rates in many comparable countries stabilising( 3 ). Between 1995 and 2011 obesity in Australian adults increased from 56 to 63 %, while currently 6·2 % of all adults have CVD( 4 ) and more than 5 % have diabetes( 5 ).
The growth in obesity in industrialised countries has coincided with a shift towards higher levels of dietary energy alongside diminished intakes of beneficial micronutrients typically gained through plant-based foods, Traditionally, studies of this ‘nutrition transition’( Reference Popkin and Gordon-Larsen 6 ) have focused on the supply side of the food system: production and nutrient composition( Reference Godfray, Beddington and Crute 7 ); trade policies( Reference Murphy 8 ); food processing( Reference Winson 9 ); the food-service sector( Reference Hawkes 10 ); and the marketing activities of ‘Big Food’( Reference Stuckler and Nestle 11 ).
However, efforts to shift dietary composition and intakes by regulating the nutritional attributes of the food supply, thus far, have not been effective. In a context of generally sufficient, stable and affordable food supplies in high-income countries, attention is turning to drivers of food demand beyond price and company marketing. There is growing interest in food consumption as a force that acts synergistically with, but independent of, the food supply.
Sociologists consider a focus on individual choice to be misleading when trying to understand food preferences and consumption behaviours, and instead use the concept of food practices( Reference Holm 12 , Reference Warde 13 ). An accepted definition of a practice is ‘a routinized type of behaviour which consists of several elements, interconnected to one another: forms of bodily activities, forms of mental activities, “things” and their use, a background knowledge in the form of understanding know-how, states of emotion and motivational knowledge’ (p. 249)( Reference Reckwitz 14 ). From this perspective, individuals who consume food according to their possession of, and access to, these various elements are considered to be practice participants. It is of relevance to nutritional status, that ‘preferences emanate from practices’ (p. 325)( Reference Holm 12 ) and are shaped more by the exigencies of daily life – family composition, labour market engagement – than by any rational and food-related calculus of utility maximisation( Reference Warde 15 , Reference Dixon 16 ). Our premise is that key aspects of food consumption practice influence nutrient intake by mediating the types of food eaten and the social organisation of its consumption.
A focus on historical trends in food consumption practice holds promise for better understanding the reasons for the rise in population obesity. Studies in a range of industrialised countries have shown: a greater prevalence of eating out( Reference Smith, Ng and Popkin 17 – Reference Juul and Hemmingsson 20 ); less time spent cooking and eating( Reference Smith, Ng and Popkin 17 – Reference Cheng, Olsen and Southerton 19 ); a growing reliance on processed foods( Reference Juul and Hemmingsson 20 ); a decline in traditional meal patterns alongside an increase in the prevalence and importance of snacking or grazing( Reference Poulain 21 , Reference Kant and Graubard 22 ); and mixed evidence of a decline in commensal eating( Reference Pliner and Bell 23 , Reference Mestdag 24 ) and changes in time spent eating( Reference Warde, Cheng and Olsen 18 ).
Each of these reported trends in food consumption practice has nutritional significance. For a given portion size, commercially prepared foods from takeaway outlets and restaurants typically contain higher levels of sugar, fat and energy than foods prepared at home( Reference Burns, Jackson and Gibbons 25 – Reference McGuire 29 ). Likewise, ultra-processed foods, including pre-prepared meals and snack foods, provide more energy and fewer nutritional benefits than minimally processed foods( Reference Moubarac, Martins and Claro 30 , Reference Monteiro 31 ). Snack-dominated meal patterns have been associated with significantly higher consumption of energy and lower consumption of nutrient-rich foods than meal-dominated patterns( Reference Ovaskainen, Reinivuo and Tapanainen 32 ), while a higher frequency of eating occasions is associated with higher energy consumption( Reference Kerver, Yang and Obayashi 33 ). Consuming food slowly and thoughtfully is thought to lead to lower energy intake than rapid eating due to greater awareness of satiety( Reference Viskaal-van Dongen, Kok and de Graaf 34 – Reference Andrade, Greene and Melanson 36 ); faster consumption has been associated with higher BMI in cross-sectional studies( Reference Leong, Madden and Gray 37 ). Commensal eating can be positively or negatively associated with energy intake; the variation derives mainly from social and environmental influences( Reference Sobal and Nelson 38 , Reference Fischler 39 ).
Much of the research into changing food consumption patterns comes from Europe and the USA, and there has been little analysis of quantitative changes in similar patterns in Australia since the 1980s. Using data from two nationally representative data sets, we explore trends in food practice that are likely to have shaped the demand for food in Australia over two decades. We focus on five aspects of food practice that have been observed internationally and implicated in diet-related health risks, specifically energy intake: (i) the replacement of home-prepared foods by commercially prepared foods; (ii) consumer reliance on ultra-processed foods; (iii) de-structured dining; (iv) increased pace of eating; and (v) a decline in commensal eating.
Methods
Data overview
We use data from two nationally representative household surveys, both conducted by the Australian Bureau of Statistics, to examine trends in these food practices. Food expenditure data are taken from the Household Expenditure Survey (HES) while data on time spent on cooking and eating activities, including where such activities take place and with whom, are taken from the Time Use Survey (TUS). Both surveys used a stratified, multistage cluster design to sample residents of private dwellings in Australia (comprising 97 % of the Australian population in 2009/10). The resulting samples are representative of the Australian population.
The 1988/89, 1998/99 and 2009/10 HES collected information on household income and expenditure across a range of categories. The sample size was 9571 households in 1988/89, 6893 households in 1998/99 and 9774 households in 2009/10. Data were collected across the Australian fiscal year (1 July to 30 June), so that resulting estimates are representative of expenditure patterns across the fiscal year. However, for simplicity, we refer to the survey years as 1989, 1999 and 2010 hereafter. Food expenditure data were collected using a two-week expenditure diary which was completed by every usual adult household member (aged 15 years and over), with the results aggregated to estimate household-level weekly expenditure( 40 ).
The 1992, 1997 and 2006 TUS collected information on time spent each day on a range of activities, including where and with whom each activity took place. The sample size was 3522 households in 1992, 4059 households in 1997 and 3626 households in 2006. Data were collected over four two-week periods spread across the calendar year. All adults (aged 15 years and over) in sampled households completed a two-day time use diary detailing their primary and secondary activities in intervals of 5 min across the day, as well as their spatial location and who else was present( 41 ). Our data sources allow for analysis of trends in food practice over a period of 20 years (for expenditure) and 14 years (for time use). Longer time series of comparable data were not available. The TUS has only been undertaken three times at a national level (1992, 1997, 2006) and while pre-1989 editions of the HES exist, Consumer Price Indices for most detailed food categories are not available prior to 1989. This means that inflation-adjusted expenditure data could not be compiled for a longer time series than is presented herein.
Measuring food practices
Various indicators are used to measure trends in the five food practice aspects examined in the present paper (Table 1). Some indicators are relevant to more than one practice aspect and so are listed more than once in Table 1.
Table 1 Variables used in analysis of food practices

HES, Household Expenditure Survey; TUS, Time Use Survey.
Food and non-alcoholic beverage expenditure data from the HES were recoded into twenty-six categories to ensure comparability across years and then into five summary variables (see the online supplementary material for full details). The classification used is based on Monteiro’s( Reference Monteiro, Levy and Claro 42 ) system, which assigns food products into three groups based on their level of industrial processing: (i) unprocessed or minimally processed foods; (ii) processed culinary ingredients; and (iii) ultra-processed foods. This classification system is attractive for its usefulness in linking food consumption to health effects( Reference Moubarac, Parra and Cannon 43 ), as well as allowing comparison of Australian expenditure patterns with those examined in other recent papers on food expenditure and consumption( Reference Juul and Hemmingsson 20 , Reference Moubarac, Martins and Claro 30 , Reference Monteiro, Levy and Claro 44 , Reference Smith, Gray and Mainvil 45 ). At its aggregate level the ultra-processed foods category includes a broad array of foods of varying nutritional value (e.g. bread and snacks), so we also look at expenditure trends for sub-categories within each group to understand more about the possible health implications of observed trends. Meals out and takeaway foods were included as a separate category. It was also necessary to include an additional category for foods and beverages that were not described in enough detail to be classified or where the product described did not fit into the Australian Bureau of Statistics’ classification structure. Expenditure on meals out and takeaway foods is presented in the results as a percentage of total spending on foods and non-alcoholic beverages. Expenditure on other types of foods and beverages is presented as a percentage of the home food budget, where the home food budget is defined as expenditure on foods and beverages other than meals out and takeaway foods.
Following Smith et al.( Reference Smith, Ng and Popkin 17 ), Cheng et al.( Reference Cheng, Olsen and Southerton 19 ) and Warde et al. ( Reference Warde, Cheng and Olsen 18 ), time use data are examined for information on time spent on eating and cooking activities as well as their social context. The TUS provides estimates of time use for each adult in sampled households. Individuals were excluded from the sample if they recorded no episodes of eating or drinking on the diary day. Household-level indicators were derived by aggregating time use across all adults in each household. Households where one or more adults failed to complete a time use diary on the selected day were excluded from the analysis. The percentage of households with complete diaries for all adults was 87 % in 1992, 89 % in 1997 and 87 % in 2006( 41 ).
Each distinct episode of eating from the time use diary (which may be time spent eating a full meal, a snack or drinking a beverage) is counted separately and the total amount devoted to eating is aggregated across the diary day. Each eating episode includes information on location as well as who else is present. Locations were recoded into five categories: (i) at home; (ii) at other people’s homes; (iii) at work or an educational institution; (iv) at a ‘food locale’ (defined as eating and drinking locales including pubs, cafés, restaurants and food courts, but excluding canteens or eating areas in the workplace); and (v) in public places (such as shops, public buildings or parks). We define eating alone as eating with no one else present, as well as in a crowd or with strangers, while eating with others includes eating with family, friends, colleagues or neighbours. Eating a meal and snacking are defined only for 1997 and 2006 (meals and snacking were not separately identified in the 1992 survey).
Data analysis
All analysis was done using the statistical software package Stata version 14.1. Mean values for each variable were estimated by year, along with t tests for differences in mean values between years. All analyses used weights provided by the Australian Bureau of Statistics to ensure that derived estimates are representative of the Australian population at the time of each survey.
Food expenditure was measured in the HES in original prices. In order to remove the effects of inflation from the results, expenditure estimates from 1988/89 and 1998/99 were inflated to 2009/10 prices using indices for food products from the Consumer Price Index( 46 ). In the case of fruit and vegetables, oils and butter, snack foods and condiments, price data were not available until 1989, so data for 1988 were extrapolated from available data using linear extrapolation. No Consumer Price Index data were available for sugar, so expenditure on sugar was inflated to 2009/10 prices using commodity price data( 47 ).
Results
Table 2 shows that the share of the total food budget spent on food away from home rose steadily from 22·8 % in 1989 to 26·5 % in 2010. However, the source of food away from home changed over time. Spending on takeaway foods rose in the 1990s but fell in the 2000s, while spending on meals out was unchanged in the 1990s and rose significantly in the 2000s.
Table 2 Expenditure on food away from home (percentage of total food budget) in nationally representative samples of Australian households, 1989–2010
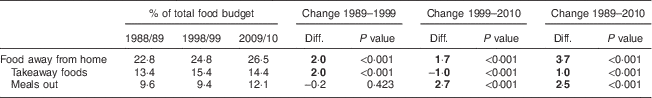
All expenditure shares are at 2010 prices. Differences that are statistically significant at the 95 % level or higher are shown in bold.
Table 3 shows that time spent by household members on food preparation fell significantly. Women spent almost 8 min fewer cooking on weekdays and 12 min fewer on weekends in 2006 than in 1992. This amounts to a weekly decline of more than 1 h in cooking time by women, although there was a small increase of about 4 min in men’s cooking time on weekends.
Table 3 Daily minutes spent on food preparation and clean up in nationally representative samples of Australian households, 1989–2010
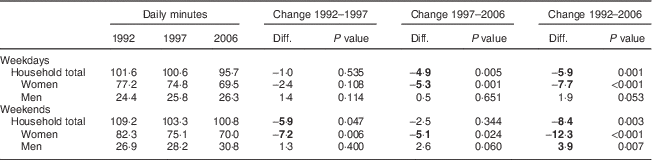
Differences that are statistically significant at the 95 % level or higher are shown in bold.
Table 4 shows that spending on unprocessed foods and ingredients fell while spending on ultra-processed foods increased over time. Much of the shift towards ultra-processed foods occurred in the 1990s, with a small decline in its share recorded between 1999 and 2010. The decline in spending on unprocessed foods was due mainly to a shift away from more expensive beef and lamb towards cheaper chicken, as well as a decline in spending on fresh milk and cream. Within the category of ultra-processed foods, spending on pre-prepared meals, snack foods, condiments and spreads, and cake and biscuits rose considerably in the 1990s, but was relatively stable or fell during the 2000s, while spending on beverages, bread, processed meat and processed fruit and vegetables declined across the whole period examined.
Table 4 Expenditure on food prepared at home (percentage of home food budget) in nationally representative samples of Australian households, 1989–2010
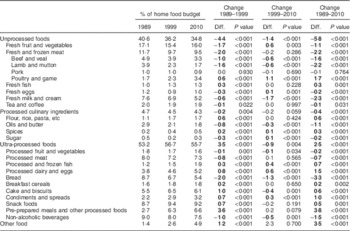
All expenditure shares are at 2010 prices. Differences that are statistically significant at the 95 % level or higher are shown in bold. See the online supplementary material for a full description of each category.
Also of note is the increase in spending on ‘other food’. The bulk of ‘other food’ is where expenditure diaries contain entries of ‘food’ without further detail to allow the expenditure to be allocated to a specific category of food. While it is unclear why this would be increasing over time, it is not likely to be biasing the general trends observed in a significant way. Even if all the inadequately described foods was unprocessed (which is unlikely), the general trend of decreasing spending on unprocessed foods between 1989 and 2010 would remain.
Table 5 shows that while overall time spent eating fell by about 3 min on weekdays and 4 min on weekends between 1992 and 2006, there was little change over this period in the length of eating episodes, providing no strong evidence that people are eating more quickly. However, there was a clear trend towards eating alone rather than commensal eating, both on weekdays and weekends.
Table 5 Time spent on eating activities in nationally representative samples of Australian households, 1989–2010
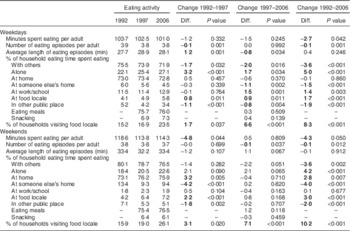
Differences that are statistically significant at the 95 % level or higher are shown in bold.
The bulk of eating occurred at home. The proportion of eating time taking place at home was unchanged on weekdays and rose slightly in the 1990s on weekends. While still small in total, there was a clear increase in the amount of eating time spent at food locales, such as cafés and restaurants, and also in the proportion of households where at least one member visits a food locale on the diary day (which should also capture purchases of takeaway foods), especially in the 2000s. Eating at home or in other people’s homes has declined and eating in public places has increased. Between 1997 and 2006, there was no significant change in the proportion of eating time devoted to eating meals or snacking.
Figure 1 shows that patterns of eating activity over the day were remarkably stable. These results suggest that there is little evidence of increasing fragmentation of eating time or of widespread changes to established eating times. Three main meals per day are clearly evident in the temporal distribution of eating time and the times of day when these take place have barely changed over the period examined. Moreover, there is no evidence of an increase in eating activity taking place between established mealtimes.

Fig. 1 Percentage of adults eating in each 5 min interval of the day on weekdays (a) and weekends (b) in nationally representative samples of Australian households in 1992 (![]() ), 1997 (
), 1997 (![]() ) and 2006 (
) and 2006 (![]() )
)
Discussion
Our results point to some clear trends in aspects of food practice in Australia over the past two decades, with some aspects evolving between the 1990s and the 2000s while others remaining comparatively stable. Although we discuss these aspects separately for the sake of clarity, in daily life they are mutually constituted, with changes in one affecting the others.
Replacement of home-prepared food by commercial preparations was evidenced by the increased patterns of expenditure on commercially prepared foods, which was particularly marked in the 1990s by foods purchased from takeaway outlets. There was a corresponding decrease in consumption of foods prepared at home, displayed by both a decline in preparation and cooking time at home and in expenditure on unprocessed foods and ingredients. Most of the observed increase in spending on takeaway foods in the 1990s occurred before obesity was widely recognised as a public health problem by the WHO in 1997( Reference James 48 ). As a result, public health campaigns began to focus on reducing demand for foods high in fat, salt and sugar. Around this time, fast and takeaway foods also attracted negative media attention within popular culture; an obvious example being Michael Moore’s 2003 film, Supersize Me. The film was a box office success in Australia and drew widespread attention to the negative health effects of takeaway foods.
Our data show that by the 2000s, commercially prepared foods were more likely to be purchased from restaurants than takeaways perhaps because restaurant foods were not subjected to the same negative health attention as fast and takeaway foods. At the same time, increasing media attention was paid to celebrity chefs and a focus on leisurely pleasurable dining. Australia also experienced a period of rapid growth in disposable income and household wealth over this period until the Global Financial Crisis of 2007( Reference Finlay 49 ), making restaurant dining affordable to a wider range of people. Indeed, Jaaskala and Windsor( Reference Jaaskala and Windsor 50 ) find that, in contrast to other food products and takeaway foods, restaurant meals are ‘superior’ goods, meaning that as incomes increase, households tend to allocate a larger share of their total spending to restaurant meals. While restaurant meals are likely to contain higher quantities of fat, sugar and salt than home-cooked foods, this information has gained little public attention. Furthermore, restaurant dining may be more socially acceptable than takeaway dining because it shares many characteristics of a proper (European middle class) healthy meal( Reference Holm 12 ) such as a commensal table, the use of eating utensils and an opportunity for sociability. The social dimensions to eating remain durable despite the difficulties of finding shared times( Reference Cheng, Olsen and Southerton 19 ).
Not only does household cooking time reflect changing time use patterns more generally but it may also signal a shift in the type of foods preferred by household cooks. The second and associated practice was the increasing proportion of the food budget devoted to ultra-processed foods; more in some sub-categories of food than others. The growth of spending on biscuits, cakes and other snack foods may be linked to the ready affordability and availability of such foods as well as to a decline in the home-cooked, multiple-course evening meal, discussed below.
During the 1990s, the amount of time that women devoted to food preparation declined with little concomitant uptake of domestic tasks by men. It appears that the adoption of commercially prepared and processed foods was a strategy, in part, to manage women’s move into the labour market. In 1989, 48 % of women were employed which increased to 56 % by 2010( 51 ). Women’s increasing work time could be reflected in the decreased time spent dining in other people’s homes, which also requires non-commercial food preparation that is usually undertaken by women. In addition, as household members have reduced their time preparing home-cooked meals, the growth of restaurants, cafés and other prepared food outlets has increased to fill the void.
Influences on food consumption have been divided into those that relate to food content and those concerned with the consumption environment, with the latter reflecting the social and physical aspects of consumption, via social norms and the ability of individuals to monitor what they are eating( Reference Waskink 52 ). The following practices can be seen to be influenced by the food environment.
A shift to de-structured dining, or vagabond eating( Reference Poulain 21 ), concerns a reduction in formal dining typified by the Australian evening meal, which traditionally involved the family consuming a home-cooked main course and dessert( Reference Banwell, Broom and Davies 53 ), and an increase in unscheduled and often solitary snacking. Our data sources do not indicate whether the number of courses in a meal has declined although they do show very little change in temporal patterns of eating and in the amount of time devoted to consuming meals and snacks. Scandinavian countries show similarly durable patterns of eating times between 1997 and 2012, although some sub-populations eat at different times from the main temporal patterns( Reference Lund and Gronow 54 ). However, there is a clear increase in spending on snack foods. This contradiction may be due to under-reporting of snacking, which tends to be difficult for consumers to identify for research purposes, in our time use data( Reference Kerver, Yang and Obayashi 33 ). It is plausible that increased snacking occurred; during the 1970s and 1980s, the dessert course began to disappear from the evening meal in Australia and households started stocking commercially produced biscuits, cakes and ice creams which could be eaten with a meal or at other times( Reference Banwell, Broom and Davies 53 ). These products were already widely available in supermarkets before the 1990s, suggesting that this dietary shift may have already been in train before these data were collected. We are also unable to determine whether the replacement of home-cooked foods with commercial snack foods has increased the overall energy consumption, although other studies have shown this to be so( Reference Ovaskainen, Reinivuo and Tapanainen 32 ).
Over the two decades of interest, the pace of eating has changed little. There was a small decline in the time spent eating overall, with slightly fewer eating episodes recorded; however, the time spent eating per episode remained stable suggesting that meals have not become markedly more rushed. At the same time, increasing interest has been paid to ‘slow food’ which advocates a return to locally produced foods and the use of unprocessed, raw ingredients cooked from scratch, and consumed at slow relaxed dining occasions. Our combined evidence suggests that home-cooked, slowly consumed food has not become more widely adopted. Evidence is mixed on the effects of eating duration on energy consumed with some proposing that lengthy meals increase the likelihood of eating more( Reference Waskink 52 ) while foods that can be ingested easily and quickly are associated with higher energy intake( Reference Viskaal-van Dongen, Kok and de Graaf 34 ). Furthermore, it is contested whether eating slowly or quickly has an impact on weight, with recent data collected from middle-aged women suggesting that it does not( Reference Leong, Gray and Horwath 55 ). Given that this aspect has changed very little over time it seems unlikely to be a major contributor to growing levels of obesity in Australia.
An increase in the time spent on solitary eating and a decline in time spent eating with others have occurred fairly consistently over the two decades. This may reflect broader contextual factors such as shrinking household size associated with an ageing population( Reference Pliner and Bell 23 ) and an increase in the proportion of one-person Australian households from 19·5 % in 1986 to 24·4 % in 2011( 56 , 57 ). It remains unclear whether an increase in solo eating leads to higher energy consumption than shared dining as it can be affected positively or negatively by the social practices of those present( Reference Sobal and Nelson 38 ), although it seems likely social eating with friends facilitates more food consumption( Reference Herman 58 ).
In comparison to some other aspects of food practice, little evidence supports the influence of de-structuration of meals and the pace of eating on energy intake. However, UK researchers( Reference Cheng, Olsen and Southerton 19 ) suggest they have important social functions because people use domestic eating to counter the temporal de-routinization taking place in other life spheres: ‘while tendencies indicative of temporal fragmentation are revealed, counter tendencies exist which suggest that the practice of eating is resilient to many forms of external pressure’ (p. 39) including ‘the unchanged duration of home based eating events’ (p. 56).
The current descriptive paper cannot make causal inferences between changes in aspects of food practice and health risks and outcomes; however, the temporal co-occurrence of these changes with increasing obesity and other health risks encourages further investigations into connections and relationships. The biggest limitation of our analysis is that it is based on food expenditure and time use patterns rather than food consumption. We do not directly observe trends in the quantity or quality of foods being consumed by households. Changes in relative prices may have led households to substitute one type of food for another without any change in their nutritional intake. In addition, not all foods purchased by households are consumed. There is evidence that household food wastage varies across food categories (and is especially high for fruit and vegetables and takeaway foods) and has increased over time as household size has decreased( Reference Baker, Fear and Denniss 59 ). Ideally, our analysis would be supplemented by data on trends in food consumption. However, the nationally representative nutrition survey undertaken by the Australian Bureau of Statistics in 1995 and 2011/12 is subject to a significant energy under-reporting problem that is increasing in magnitude over time( 5 ). Changes to survey methodology between the two surveys also mean that indicators of the food practices examined herein (e.g. energy or nutrient intake from commercially prepared or processed foods) cannot be compiled in a way that is comparable over time. In addition, some important consumption trends, such as increasing portion sizes, which have been linked to obesity in the USA( Reference Rozin, Kabnick and Pete 35 ), are likely to have occurred in Australia as well, but are unable to be captured in these data sets. Despite these limitations, our research brings together data sets not previously combined to offer a valuable picture of trends in Australian food practices over time. The measures of different facets of food consumption via household expenditure and time support each other, thus strengthening the findings.
Conclusion
It appears that the way in which eating is socially organised has evolved, with implications for the quantities and qualities of foods ingested. The changes in key aspects of food practice described here have occurred over the same time period that obesity and diet-related, non-communicable diseases have increased rapidly in Australia. Some aspects are implicated more than others: particularly the shift from domestic cooking to use of pre-prepared and ultra-processed foods, a reduction in time spent in food preparation and cooking, as well as an upsurge in time and money devoted to eating away from home. These are all likely to operate through the higher energy content of commercially prepared, compared with unprocessed or lightly processed, foods. Lying behind each of these practice aspects is a complex intermingling of economic and temporal considerations which reside in domains of life beyond the culinary: women’s labour force participation, which robs households of time to cook; the rise of the food-services sector, which has made commercially prepared foods more affordable and accessible. Through all of this are considerations of opportunity costs to prepare and eat foods at home or to buy time through spending money on pre-prepared foods. There are forces beyond the economic: for example, eating out is a pleasurable, leisure activity; processed foods are tastier; solo eating may be easier emotionally or is imposed through the demographic shift to single-adult households.
By taking a sociological lens to our analysis of dietary changes and their likely health impacts, we have illustrated the multiple connections between everyday lives and people’s engagement with food. Such an approach illustrates why obesity and related non-communicable diseases have not been amenable to simple health messages about diet and exercise.
Acknowledgements
Financial support: This work was supported by the Australian Research Council of Australia (ARC) Discovery Project (DP1400102856). The ARC had no role in the design, analysis or writing of this article. Conflict of interest: None. Authorship: D.V. analysed the data while C.B. and J.D. provided sociological insights on food trends. All authors wrote the article and provided references. Ethics of human subject participation: Not applicable.
Supplementary Material
To view supplementary material for this article, please visit http://dx.doi.org/10.1017/S136898001600255X


