


Obesity is becoming a major public health problem in both developed and developing countries( Reference Kelly, Yang and Chen 1 ). The most recent WHO global estimate showed that in 2014, 39 % of adults (≥18 years old) were overweight (38 % of males and 40 % of females). An estimated 11 % of adult males and 15 % of adult females were obese. Thus, approximately half a billion of the world’s adult population were obese( 2 ). The National Health and Morbidity Survey (NHMS) conducted in 2011( 3 ) reported that 29·4 % of Malaysian adults (≥18 years old) were overweight and 15·1 % were obese by the WHO classification( 4 ).
Previous studies have demonstrated a link between overweight and obesity and risk of all-cause, CVD, cancer and mortality from other causes( Reference Abdullah, Wolfe and Stoelwinder 5 – Reference Parr, Batty and Lam 7 ). The WHO listed overweight and obesity as the fifth leading risk factor for death globally in 2008. At least 2·8 million adults die each year as a result of being overweight or obese. Most of the large prospective observational studies that evaluated the relationships between BMI and risks of all-cause and cause-specific mortality were carried out in European, America and a few Asian countries( Reference Flegal, Kit and Orpana 8 , Reference Zheng, McLerran and Rolland 9 ). The relationship between obesity and risk of mortality has so far not been investigated in the Malaysian population. Our study aimed to determine the association between BMI and all-cause mortality and CVD mortality in Malaysian adults of various ethnicities.
Methodology
Study population
We analysed data from the third NHMS conducted in 2006. The NHMS was a nationwide, cross-sectional, population-based survey that collected data on socio-economic variables, anthropometric measurements, lifestyle risk behaviours, psychiatric morbidity, chronic illness and other health indicators. Findings from the survey are utilised in guiding health policies and evaluating intervention programmes by the Ministry of Health of Malaysia. The sampling method and overall findings of the survey have been described elsewhere( 10 ). A total of 32 844 adults aged 18 years or above participated in the survey. Prior ethical approval from the Malaysian Medical Research and Ethics Committee had been obtained (NMRR ID-10-731-6916) for the study to be conducted.
Follow-up
In Malaysia, under the Registration of Births and Deaths Act of 1957, all births and deaths in the country must be registered with the Malaysian National Registration Department (NRD). Therefore from birth, all Malaysians will have a unique NRD identification number that will be used in all official matters, including in death registration. Upon death, the personal details and cause of death would be presented to the NRD for death registration and issuance of the death certificate. Death registrations can be either medically certified or non-medically certified. Medically certified deaths are deaths in which the information on the cause of death is provided by medical officers, district health officers or coroners. In some circumstances, due to constraints in access to medical officers or coroners, informants such as policemen, medical assistants or other individuals may take over this responsibility, resulting in non-medically certified deaths( Reference Adnan, Bujang and Supramaniam 11 ). For non-medically certified deaths, cause of death is determined by interrogating the deceased’s close relatives and also verified by looking at available medical documents.
The NHMS was conducted in March 2006, whence the baseline information (sociodemographic, biochemical tests, smoking status and anthropometry measurements) were collected. Participants were then followed up for approximately 5 years from March 2006 to December 2010. Ascertainment of deaths among the NHMS cohort during this period was obtained by record-matching of the identification number with the NRD death records using IBM® InfoSphere® QualityStage software (IBM, Armonk, NY, USA). All deaths from CVD coded as ICD-10 codes I00–I99 according to the International Statistical Classification of Diseases and Related Health Problems, Tenth Revision (ICD-10)( 12 ) were classified as cardiovascular mortality.
Assessment of height, weight and BMI
All NHMS participants had their height and weight measurements taken during the survey. Those who had tuberculosis, chronic renal diseases, thyroid diseases, cancer and other debilitating diseases that may affect nutritional status were excluded from having their anthropometric measurements taken( 10 ). Height and weight were measured according to standard procedures recommended by the WHO( 13 ); BMI was calculated as weight divided by height squared (kg/m2) and categorised according to the WHO’s proposed classification for adult Asians( 14 ). Underweight was defined as BMI<18·5 kg/m2, normal weight as 18·5–22·9 kg/m2, at risk of overweight as 23·0–24·9 kg/m2, overweight as 25·0–29·9 kg/m2, obesity class I as 30·0–34·9 kg/m2 and obesity class II as BMI≥35·0 kg/m2.
Smoking status
Smoking status was classified into current, former and never smoker. Current smokers were those who had smoked at least once in the past 30 d. Former smokers were those who had smoked at least once in their lifetime but had not smoked in the past 30 d prior to the survey. Never smokers were those who had never smoked in their lifetime.
Hypertension
Two readings of systolic and diastolic blood pressure were taken at rest, 15 min apart, using the Omron Digital Automatic Blood Pressure Monitor model HEM-907 (Omron Healthcare, Kyoto, Japan) with appropriate cuff size. The average of the two readings was used. Hypertension was defined as systolic blood pressure ≥140 mmHg and/or diastolic blood pressure ≥90 mmHg or reported treated hypertension.
Hypercholesterolaemia
Fasting total cholesterol levels were measured using the Accutrend GC machine (Roche Diagnostics, Mannheim, Germany). Those with total cholesterol level ≥5·2 mmol/l or known hypercholesterolaemia were classified as having hypercholesterolaemia.
Diabetes mellitus
Participants who reported to be non-diabetic had their blood glucose measured in finger-prick blood, after an overnight fast of 8–10 h, using the Roche Diagnostics Accutrend GC glucometer. Fasting blood glucose ≥6·1 mmol/l or those who reported themselves as diabetic were classified as having type 2 diabetes.
Statistical analyses
Statistical analyses were performed using the statistical software package PASW Statistics for Windows, Version 18.0. All analyses took into account the complex survey design and unequal selection probabilities. Findings were reported as weighted estimates of the prevalence with 95 % confidence intervals. Time-independent Cox regression was applied to compare the risk of all-cause mortality and CVD mortality between underweight, at risk of overweight, overweight, obesity class I and obesity class II compared with normal BMI. Multiple Cox regression models were generated for each outcome (all-cause mortality and CVD mortality) for all participants, all participants excluding mortalities during the first 2 years of follow-up, healthy participants (excluding those with diabetes mellitus, hypertension and hypercholesterolaemia), healthy never smokers, never smokers, current smokers and former smokers. All models were adjusted for age, gender and ethnicity. Age was categorised into age groups of 18–19, 20–39, 40–59 and ≥60 years. Ethnicity consisted of Malay, Chinese, Indian and Others. Proportional hazards assumptions were examined. There were no significant two-way interactions between all the independent variables.
Results
Our study showed that more women (46·0 %) were classified as overweight and obese (≥25·0 kg/m2) than men (39·7 %). The prevalence of overweight and obesity was highest in the 40–49 years age group, never smokers and Indian ethnicity in both men and women. Current smoking was highest among normal-weight men and women. The prevalence of diabetes, hypertension and hypercholesterolaemia was highest among overweight men and women (Table 1).
Table 1 Baseline characteristics of participants by gender and BMI: Malaysian adults (n 32 839) aged ≥18 years, third National Health and Morbidity Survey, 2006
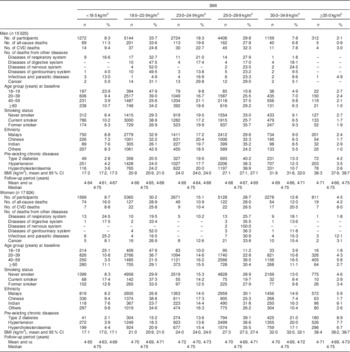
During the study period, there were 1035 deaths (590 men and 445 women) from all causes and 225 deaths (141 men and eighty–four women) from CVD, with total follow-up time of 153 814 person-years. Among the other causes of death reported were death from diseases of the respiratory system (n 103), diseases of the digestive system (n 29), diseases of the nervous system (n 10), diseases of the genitourinary system (n 29), infectious and parasitic diseases (n 41) and cancer (n 105; Table 1).
For all models except for current smokers, underweight was significantly associated with all-cause mortality. Overweight was inversely associated with all-cause mortality in all participants (adjusted hazard ratio (HR)=0·81; 95 % CI 0·68, 0·94). Mild obesity (BMI=30·0–34·9 kg/m2) was inversely associated with all-cause mortality in never smokers (HR=0·71; 95 % CI 0·53, 0·97; Table 2), but this inverse association disappeared among the healthy never smokers. CVD mortality was strongly associated with severe obesity (BMI≥35·0 kg/m2) in all participants (HR=2·15; 95 % CI 1·11, 4·15). After excluding mortalities during the first 2 years of follow-up, both underweight (HR=1·93; 95 % CI 1·05, 3·54) and severe obesity (HR=3·24; 95 % CI 1·46, 7·18) were found to increase risk of CVD mortality (Table 3).
Table 2 Adjusted hazard ratios (HR) for all-cause mortality by BMI category among Malaysian adults (n 32 839) aged ≥18 years, third National Health and Morbidity Survey, 2006
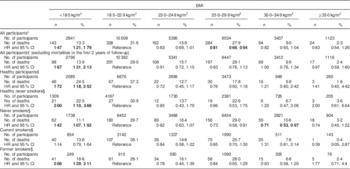
Significant HR and 95 % CI are indicated in bold font. No significant two-way interactions among all the independent variables.
* Adjusted for age group (18–39, 40–59 and ≥60 years), gender (male and female) and ethnicity (Malays, Chinese, Indian and Others) in the multiple Cox regression models.
† Adjusted for age group, gender and ethnicity in the multiple Cox regression models (excluding mortalities in the first 2 years of follow-up).
‡ Adjusted for age group, gender and ethnicity in the multiple Cox regression models (excluding participants with diabetes, hypertension and hypercholesterolaemia).
§ Adjusted for age group, gender and ethnicity in the multiple Cox regression models.
Table 3 Adjusted hazard ratio (HR) for CVD mortality by BMI category among Malaysian adults (n 32 839) aged ≥18 years, third National Health and Morbidity Survey, 2006
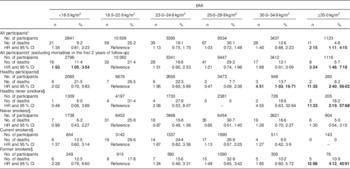
Significant HR and 95 % CI are indicated in bold font. No significant two-way interactions among all the independent variables.
* Adjusted for age group (18–39, 40–59 and ≥60 years), gender (male and female) and ethnicity (Malays, Chinese, Indian and Others) in the multiple Cox regression models.
† Adjusted for age group, gender and ethnicity in the multiple Cox regression models (excluding mortalities in the first 2 years of follow-up).
‡ Adjusted for age group, gender and ethnicity in the multiple Cox regression models (excluding participants with diabetes, hypertension and hypercholesterolaemia).
§ Adjusted for age group, gender and ethnicity in the multiple Cox regression models.
Further analysis was performed for all participants to determine the risk of CVD mortality and all-cause mortality by BMI categories after adjustment for smoking status, diabetes, hypertension and hypercholesterolaemia. Underweight remained significantly associated with higher risk of all-cause mortality, while lower risk was observed for the other BMI categories compared with normal weight; however, there was no difference in the risk of CVD mortality among the BMI categories (see online supplementary material, Supplemental Table 1).
Discussion
Our findings showed a decreased risk of all-cause mortality among all overweight (BMI=25·0–29·9 kg/m2) participants compared with normal-weight participants, and in mildly obese (BMI=30·0–34·9 kg/m2) never smokers compared with normal-weight never smokers. However, our data showed that underweight (BMI<18·5 kg/m2) was significantly associated with risk for all-cause mortality as compared with normal weight (BMI=18·5–22·9 kg/m2), while obesity (BMI≥30·0 kg/m2) was not associated with excess mortality risk. Similarly, in a 12-year prospective study on a nationally representative sample of Canadian adults, Orpana and colleagues( Reference Orpana, Berthelot and Kaplan 15 ) revealed that overweight (BMI=25·0–29·9 kg/m2) was protective against risk of death as compared with those with normal weight, while obesity class I (BMI=30·0–34·9 kg/m2) was not associated with excess risk of death. In a recent systematic review and meta-analysis involving more than 2·88 million participants with 270 000 deaths in ninety-seven cohort studies in North America (forty-one studies), Europe (thirty-seven) and other countries (nineteen), overweight (BMI=25·0–29·9 kg/m2) was significantly associated with lower risk of all-cause mortality while obesity class I (BMI=30·0–34·9 kg/m2) was not associated with higher mortality risk compared with normal weight (BMI=18·5–24·9 kg/m2). But excess risk of mortality was observed among participants with obesity class II (BMI≥35·0 kg/m2)( Reference Flegal, Kit and Orpana 8 ). However, that meta-analysis missed a number of studies and also excluded a large number of studies that used definitions of normal weight that differed from the WHO definition( Reference Aune, Sen and Prasad 16 ).
Other cohort studies have demonstrated a U- or a J-shaped relationship between current BMI and all-cause mortality, with risk of mortality being highest for underweight, low in normal, overweight and mild obesity categories, and high again in severe obesity( Reference Zheng, McLerran and Rolland 9 , Reference Adams, Schatzkin and Harris 17 , Reference Berrington de Gonzalez, Hartge and Cerhan 18 ). In a 10-year study of a large cohort of American adults aged 50–71 years, risk of mortality was highest among those with a BMI below 18·5 kg/m2 or above 40·0 kg/m2 relative to the BMI category of 23·5–24·9 kg/m2 ( Reference Adams, Schatzkin and Harris 17 ). Pooled data from nineteen prospective studies in the National Cancer Institute Cohort Consortium showed among that, 1·4 million healthy and never smoking white adults in whom 160 087 deaths occurred over a median follow-up of 10 years, excess risk of death was observed for individuals with BMI in the range of 15·0–19·9 kg/m2 and ≥25·0 kg/m2 compared with individuals with BMI of 22·5–24·9 kg/m2 ( Reference Berrington de Gonzalez, Hartge and Cerhan 18 ). Similar findings were reported by another pooled analysis of nineteen cohort studies in Asia with 120 700 deaths among 1·1 million Chinese, Japanese and Korean individuals followed up for a mean period of 9·2 years, which showed higher risk of all-cause mortality in BMI categories ≤15·0 kg/m2 and ≥35·0 kg/m2 compared with BMI of 22·6–27·5 kg/m2 ( Reference Zheng, McLerran and Rolland 9 ).
A recent comprehensive meta-analysis of 230 cohort studies which reported 3·74 million deaths among a total number of 30·3 million participants found that the risk association between underweight and all-cause mortality could be confounded by smoking status, since smokers tend to have lower body weight compared with never smokers. In the meta-analysis, the risk of mortality among underweight healthy never smokers and never smokers was attenuated compared with underweight current and former smokers( Reference Aune, Sen and Prasad 16 ). Similar findings were also reported in an analysis of two prospective cohort studies in the USA (the Nurses’ Health Study and the Health Professionals Follow-up Study) which involved 116 888 participants with 20 415 deaths( Reference Song, Hu and Wu 19 ). Our findings also showed higher risk of mortality among underweight former smokers compared with underweight healthy never smokers and never smokers. However, underweight current smokers did not show increased risk of mortality. This lack of association may be due to confounding by length of smoking duration and number of cigarettes smoked per day, which were not assessed in the present study. Furthermore, stratification by smoking status resulted in a small sample size that greatly reduced the power to detect an association.
Our study showed that overweight and obese individuals without debilitating illnesses also had significantly lower risk of all-cause mortality after adjusting for diabetes, hypertension and hypercholesterolaemia, suggesting that those who are overweight and obese have lower risk of all-cause mortality compared with normal-weight individuals regardless of the presence of these chronic diseases. Because pre-existing illnesses induce weight loss that may distort the BMI–mortality association( Reference Aune, Sen and Prasad 16 , Reference Song, Hu and Wu 19 ), we excluded mortalities that occurred in the first 2 years of follow-up. However, the association between underweight and heightened mortality risk persisted.
In our study, although excess risk of CVD mortality was observed only at a higher BMI (≥35·0 kg/m2) as compared with normal BMI (18·5–22·9 kg/m2), there was an increasing trend in risk of CVD mortality from overweight to mild obesity (BMI=30·0–34·9 kg/m2) that was statistically not significant. In the Prostate, Lung, Colorectal and Ovarian Cancer Screening (PLCO) Trial, the relationship between BMI and CVD mortality was examined among 86 000 US men and women. During the 13 years of follow-up, the risk of CVD mortality was found to be significantly higher among obese patients (BMI≥30·0 kg/m2) relative to patients of normal BMI (18·5–24·9 kg/m2). The risk for CVD mortality increased substantially from BMI category of 30·0–34·9 kg/m2 (HR=1·29; 95 % CI 1·13, 1·48) to BMI ≥40·0 kg/m2 (HR=2·21; 95 % CI 1·57, 3·21)( Reference Jiang, Ahn and Huang 20 ). Our results are in line with the PLCO Trial, as both found that being overweight (BMI=25·0–29·9 kg/m2) is not associated with excess risk of CVD death. Our results are also in concordance with reviews of previous studies that reported higher grade of obesity (BMI≥35·0 kg/m2) was strongly associated with increased risk of mortality but in not mild obese patients (BMI=30·0–34·9 kg/m2)( Reference Lavie, Alpert and Arena 21 – Reference Hastie, Padmanabhan and Slack 23 ). However, these studies were conducted among cardiovascular patient populations, while CVD status was not known among the current study population.
In our study, excess CVD mortality risk among the severely obese diminished after controlling for diabetes, hypertension and hypercholesterolaemia. One possible explanation is these conditions are a step/s in the pathway leading to CVD mortality, thus adjusting for these conditions masks the association between obesity and CVD mortality risk( Reference Flegal, Kit and Orpana 8 ). After excluding mortalities during the first 2 years, our results showed the risk of CVD mortality remained high among the severely obese, while among the underweight where previously there was no risk, the risk was increased. Therefore, this suggests there is a possibility of presence of undiagnosed debilitating illness at baseline that clouds the association of BMI with CVD mortality( Reference Aune, Sen and Prasad 16 ).
A major strength of the present study is that the BMI data came from a nationally representative, population-based study, while the mortality data were sourced from the NRD. Thus both data sets are considered valid and highly reliable. One of the limitations of the study is the relatively short follow-up period. The short duration of follow-up may explain the increased risk of all-cause mortality among the underweight compared with the normal-weight population, resulting in a U-shaped association instead of the J-shaped association reported by studies with longer follow-up( Reference Aune, Sen and Prasad 16 ). Besides the short follow-up, BMI was assessed only once at the point of entry, and not longitudinally. The number of years lived with obesity may modify the association between BMI and mortality( Reference Abdullah, Wolfe and Stoelwinder 5 ). There is also a possibility of reverse causation as our data analyses did not exclude those with recent substantial weight loss due to possible undiagnosed cancer or other debilitating illnesses at baseline, therefore possibly overestimating the risk of all-cause mortality and CVD mortality in the lower BMI categories( Reference Aune, Sen and Prasad 16 , Reference Song, Hu and Wu 19 ). Another limitation is the cases in which the deaths were non-medically certified. In these cases, CVD deaths may be misclassified into other poorly defined causes of death such as ‘old age’ or ‘sudden death’, consequently leading to underestimation of CVD mortality( Reference Faudzi, Amal and Zainal 24 ).
Conclusion
There was an association between BMI and all-cause and CVD mortality in the Malaysian adult population. Relative to normal BMI, underweight was associated with significantly increased risk of mortality from all causes while obesity class II was associated with higher risk of CVD mortality. Overweight was associated with a decreased risk of all-cause mortality; however, this association should be further verified in different sub-populations. Therefore, recommendations for maintaining a normal BMI through leading an active lifestyle and healthy dietary habits should be continued.
Acknowledgements
Acknowledgements: The authors would like to thank the Director General of Health, Malaysia for his permission to publish this paper. The authors would also like to express their appreciation to the Director of the Clinical Research Centre and the Director of the Institute for Medical Research for giving the support needed for this study, and the Malaysian National Registration Department for providing mortality data for this study. Financial support: This project was supported by a grant from the National Institutes of Health, Ministry of Health, Malaysia. The National Institutes of Health, Ministry of Health, Malaysia had no role in the design, analysis or writing of this article. Conflict of interest: The authors declare that there is no conflict of interest. Authorship: C.C.K. drafted the manuscript with contributions from M.G.S., K.H.L., S.S. and J.H. C.C.K., M.G.S. and K.H.L. performed the statistical analysis. G.H.H.T., K.G., Y.A.F. and N.M.A. critically reviewed the manuscript. J.H. is the principal investigator of this study. All authors have reviewed and approved the final version for publication. Ethics of human subject participation: The Malaysian Medical Research and Ethics Committee granted ethical approval for the NHMS (NMRR ID-10-731-6916).
Supplementary material
To view supplementary material for this article, please visit http://dx.doi.org/10.1017/S136898001600344X


