


The long-term objectives of the TALENT (Transforming Adolescent Lives Through Nutrition) consortium are to: (1) understand what adolescents in low- and middle-income countries (LMIC) are eating, what physical activity they are doing, and what drives their diet and activity choices; (2) ascertain the relationship of diet and activity with their nutritional status, growth, development and health; and (3) use this information to develop interventions to optimise adolescents’ diets and physical activity. The current study was the first stage in this process: through the qualitative research described in the papers in this issue, we aimed to understand adolescents’ diet and activity behaviour, and the key people and factors that influence that behaviour.
We carried out the study in eight LMIC settings representing varying stages of ‘urban transition’ – the trend away from ‘living off the land’ towards wage-earning in industries or through provision of services; from growing food to buying it; and from living in small remote hamlets to larger crowded villages, towns and cities. Urbanisation is associated with many nutritional/dietary changes, including greater year-round food availability but less home-cooked and more processed food, and generally lower levels of physical activity due to activity-sparing technologies(Reference Popkin, Corvalan and Grummer-Strawn1). These changes have led to the emergence of ‘a double burden of malnutrition’ in LMIC, with persistent poverty, food insecurity and dietary deficiencies alongside emerging overweight occurring within the same community, household or individual(Reference Popkin, Corvalan and Grummer-Strawn1,Reference Caleyachetty, Thomas and Kengne2) . There are knowledge gaps about how these transitions impact upon the diet and physical activity of adolescents in LMIC, which have in turn limited the development of nutrition policies targeted at this critical age group(Reference Akseer, Al-Gashm and Mehta3,Reference Bhutta, Lassi and Bergeron4) .
Along with qualitative data, we collected harmonised quantitative data that would enable us to describe some of the anthropometric, dietary and socioeconomic characteristics of adolescents. This was not intended to be representative of adolescents in general in each country, but rather to illustrate the context of adolescents whose qualitative data we collected; to describe nutritional vulnerabilities to inform the development of interventions; and, by bringing together information from all the settings, to illustrate the contrasts between them.
As described in qualitative papers, each of the eight TALENT centres had a target to recruit about eighty adolescents, half in the 10–12-year age group (‘young adolescents’) and half aged 15–17 years (‘older adolescents’), and with equal number of boys and girls, from whom a subset was chosen to participate in focus group discussions. The young adolescent group represents a pre- or early-pubertal stage of development, when adolescents are still largely under parental control for most aspects of their living, while the older group represents late or completed pubertal development and greater independence from parents in relation to diet and activity. Quantitative data were collected from this larger group, mainly to illustrate the context of their lives. The main objective of the study was to collect qualitative data; because we were asking adolescents to spend a considerable amount of time with us for focus group discussions, quantitative data collection was kept to a minimum. We therefore limited this to measurements of weight and height and a questionnaire that would take no more than 15–20 min to administer.
Methods
Study settings and participants
The communities studied included remote rural villages, urban slums or deprived townships and urban low-middle-class and middle-class residential areas (Table 1). Most study samples were ‘convenience’ samples, accessed through schools or community health workers; in The Gambia, purposive sampling from a demographic surveillance system database was used(Reference Hennig, Unger and Dondeh5). Samples ranged from N 41 in Jimma, Ethiopia, to N 112 in Dervan, India. Data were collected face-to-face by trained and experienced research staff (nutritionists, nurses or social workers) using local language(s) in each setting, or French (Abidjan) or English (Mysore) if preferred by participants. All teams were experienced in anthropometry from earlier research; they received additional training for the questionnaire in this study. The questionnaire was administered to adolescents alone (Abidjan, Jimma, Johannesburg, Dervan, Pune, Mysore) or adolescents together with their caregiver (West Kiang and Mumbai) by a researcher, except among older adolescents in Jimma, who self-completed it.
Table 1 Description of study settings, methods of quantitative survey, data collection dates and sample sizes

CHW = community health worker.
* Percentage of adolescents approached who agreed to participate; not available for Cote D’Ivoire and Mysore, where community meetings were held and participants asked to volunteer.
† Dietary data were collected from sixty-seven adolescents in Mumbai.
Questionnaire
A working group within TALENT, with representation from all eight centres, designed the questionnaire (see online supplementary material, Appendix 1). It included questions about family/household possessions, household amenities (drinking water source and toilet facilities), maternal and head-of-household education level and occupational status, adolescents’ mobile phone ownership and screen time, and frequencies of intake of food groups.
Family socioeconomic status, caregiver education and employment
We chose household possessions/assets as a measure of socioeconomic status. The list of possessions was based upon those in the Standard of Living Index questionnaire, used in the National Family Health Survey-4 (NFHS-4) in India(6). We removed electricity, pressure cooker and sewing machine and added water heater; the final list of twenty-one possessions was as follows: mattress, chair, bed, table, clock/watch, electric fan, bicycle, radio/transistor/music player, television, motorised two-wheeler (moped/scooter/motorcycle), car, water pump, animal-drawn cart, thresher, tractor, refrigerator, air conditioner, washing machine, computer/laptop, broadband internet connection and water heater. Additional socioeconomic questions included caregiver education level (mother’s and head of household’s years of schooling) and employment status (paid employment, self-employed or not employed) and the household’s drinking water source (categories from ‘piped direct to the house’ to ‘river’) and toilet facilities (from ‘private flush toilet’ to ‘open fields’).
Adolescents’ diet
Diet questions were based on the Minimum Dietary Diversity Score for Women produced by the Food and Agriculture Organization and USAID’s Food and Nutrition Technical Assistance III Project (FANTA), which is used to primarily derive a diet diversity score (DDS) as an indicator of dietary macro- and micronutrient adequacy(7). It has questions about fourteen mutually exclusive food groups: (1) grains, (2) vegetables or roots that are orange-coloured inside, (3) white roots and tubers or plantains, (4) dark green leafy vegetables, (5) fruits that are dark yellow or orange inside, (6) any other vegetables, (7) any other fruits, (8) meat made from animal organs, (9) meat and poultry, (10) eggs, (11) fish or seafood (fresh or dried), (12) beans, peas or lentils, (13) nuts or seeds, (14) milk or milk products. As recommended in the use of this questionnaire(7), teams were asked to select foods eaten by their population as examples, and to record whether adolescents had eaten foods in each group within the past 24 h. We additionally asked how often they ate foods in each group (‘every day’, 5–6 times per week, 2–4 times per week, once a week, or less than once a week, including never).
We also asked about snack and ‘fast’ foods, using the same two questions: (1) fried snacks, (2) savoury snacks in packets, (3) bakery items (e.g. cakes/biscuits/puffs), (4) sweets, (5) fast food/street food/restaurant food and (6) fizzy drinks (sugar-sweetened beverages). ‘Restaurant food’ was the term thought to be most understandable to participants to capture eating meals cooked in a café/restaurant setting, sometimes as takeaway food to eat at home, which tends to be high in fat or sugar. These snack and fast foods did not contribute to the DDS.
Adolescents’ mobile phone ownership and screen time
Thinking of developing interventions (including the potential use of digital platforms) to improve adolescents’ diets and activity in these settings, we wanted to know how many adolescents had access to phones and computers. We asked if adolescents owned their own mobile phone, and specifically whether it was a smartphone, how much time the adolescents spent on a computer each day (for schoolwork or entertainment) and for how many hours they watched television.
Anthropometry
Adolescents’ weight (to the nearest 100 g) and height (to the nearest millimetre) were measured using portable digital weighing scales and stadiometers.
Data processing
A DDS was calculated(7) by allotting 1 point if the adolescents reported eating foods from the following groups in the preceding 24 h, making a maximum possible score of 10: (1) either grains or white roots/tubers, (2) green leafy vegetables, (3) either orange-coloured vegetables/roots or orange-coloured fruits, (4) other vegetables, (5) other fruits, (6) either meat/poultry or fish/seafood or animal organs, (7) eggs, (8) milk/milk products, (9) beans/peas/lentils, (10) nuts/seeds. Height and weight were used to calculate the prevalence of stunting (≤2 sd height for age), low BMI/thinness (≤2 sd BMI for age), overweight (>1 sd and <2 sd BMI for age) and obesity (>2 sd BMI for age) using the WHO 2007 growth reference(8). Each site produced group-level metadata using SPSS or STATA (various versions), stratified by sex and age group, according to a common template. The sample size in each setting was small (Table 1), and so we describe gross differences between subgroups (e.g. between sexes and age groups) but did not test these statistically. We pooled data for both sexes and/or age groups in tables and figures if there was no clear evidence of subgroup differences.
Results
Anthropometry
Figure 1a and b shows the prevalence of stunting, low BMI, overweight and obesity in younger and older adolescents, respectively, by site. Stunting was present in all settings, and was similar between both sexes. The prevalence was higher among older than younger adolescents, and in India compared with the four African settings. The prevalence ranged in young adolescents from 0 % in Jimma to 16 % in Dervan, India, and in older adolescents from 8 % in Jimma to 37 % in Mysore, India. In most settings, low BMI was more prominent than overweight and obesity, with the exception of Johannesburg, where 26 % of young adolescents and 28 % of older adolescents were overweight or obese, while 0 and 5 %, respectively, had a low BMI. The highest prevalence of low BMI was among young adolescents in the two rural settings (West Kiang, The Gambia (18 %), Dervan, India (26 %)) and in the slum population of Mumbai, India (30 %); the same was true for older adolescents. The prevalence of overweight or obesity was low (<5 %) in the two rural settings (West Kiang and Dervan), followed by Jimma (10 %), Mumbai (8 %), Mysore (9 %), Abidjan (17 %), Pune (16 %) and Johannesburg (27 %). There were no clear differences in the prevalence of overweight or obesity between younger and older adolescents or between the sexes.

Fig. 1 Prevalence (%) of stunting, low BMI, overweight and obesity among (a) young adolescents and (b) older adolescents. ![]() , stunted (height <–2 sd), WHO 2007;
, stunted (height <–2 sd), WHO 2007; ![]() , low BMI (BMI <–2 sd), WHO 2007;
, low BMI (BMI <–2 sd), WHO 2007; ![]() , overweight (BMI >+1 sd), WHO 2007;
, overweight (BMI >+1 sd), WHO 2007; ![]() , obese (BMI >+2 sd), WHO 2007
, obese (BMI >+2 sd), WHO 2007
Maternal and head of household’s education and employment status, house ownership, household possessions, drinking water source and toilet facilities
Data from younger and older adolescents were pooled for these analyses, because the data related to households rather than individuals.
Caregiver education and employment
The median years of schooling was the highest (12 years for both mother and head of household) in Johannesburg and the lowest (0 year) in West Kiang (Fig. 2a). It was 8–10 years in Jimma and in all the Indian settings, except Dervan, and 5–7 years in Abidjan and Dervan. Employment status varied between settings (Fig. 2b). In Africa, the percentages of mothers in paid employment ranged from 3 % in rural West Kiang to 33 % in urban Johannesburg, and among the Indian settings from 18 % in rural Dervan to 43 % in urban Mysore. A high proportion of mothers in West Kiang (29 %), Abidjan (67 %), Jimma (51 %) and Pune (53 %) were self-employed, and a high proportion were not in paid employment in West Kiang (69 %), Johannesburg (53 %), Dervan (78 %) and Mumbai (71 %). Heads of household in paid employment ranged from 17 % in West Kiang to 46 % in Jimma, and among Indian settings from 23 % in Pune to 74 % in Dervan. Self-employed heads of household ranged from 15 % in Johannesburg to ~40 % in West Kiang, Abidjan and Jimma. A substantial proportion of heads of household were not in paid employment in West Kiang (43 %) and Johannesburg (52 %), but head-of-household non-employment was minimal in other settings.

Fig. 2 Education level (a) and employment status (b) of mothers and HoH. M, mother; HoH, head of household; ![]()
![]() , paid employment;
, paid employment; ![]()
![]() , self-employed;
, self-employed; ![]()
![]() , not employed
, not employed
If a caregiver was both a mother and a HoH, she was included in both analyses (5 % in West Kiang, 17 % in Cote D’Ivoire, 7 % in Ethiopia, 0 % in Johannesburg, 10 % in Dervan, 5 % in Pune, 9 % in Mumbai and 11 % in Mysore).
Household assets/possessions
Television ownership was ≥90 % in Johannesburg, Cote D’Ivoire, Pune, Mumbai and Mysore, and >70 % in all other centres except the non-electrified villages of West Kiang (5 %). Refrigerator ownership ranged from 0 % in West Kiang and 21 % in Dervan to 30–60 % in most other settings and 100 % in Johannesburg. Washing machine ownership was low (≤12 %) in rural settings. Ownership of an animal-drawn cart was mostly limited to rural or semi-rural settings (West Kiang and Pune). The highest ownership of a water pump was in semi-rural Pune, where the villages are electrified and irrigation water is available because of a local dam. Bicycle ownership was the highest in rural settings and low in large cities. Ownership of a moped or motorcycle was low in all the African settings, but was substantial in all Indian settings, except Mumbai. Fifty-seven per cent of families in Johannesburg owned a car (the highest among all settings), while two-wheeler ownership was negligible. Car ownership was 15–30 % in other urban settings, though lower (4 %) in Mumbai. It was zero in West Kiang and 8 % in Dervan (both rural settings), but as high as 37 % in semi-rural Pune. Computer ownership was the highest in Johannesburg (44 %), 20–30 % in Abidjan and Jimma, <20 % in all other settings, and zero in West Kiang. The items that showed the greatest range in ownership across settings were refrigerators, washing machines and motorised two-wheelers. See online supplementary material, Supplemental Figure 1.
Household amenities
The main drinking water source was a private supply piped directly into the house in cities (Johannesburg 100 %, Jimma 95 % and Mysore 88 %), around 40 % in other urban settings and rural Dervan, with the remainder mainly using a public tap (Fig. 3a). In West Kiang, none had water piped to the house. A private flush toilet within the household was the norm in Johannesburg, and owned by most families in Mysore (Fig. 3b). In Dervan, Pune and Abidjan, almost all households had their own pit toilet, while in West Kiang and Mumbai, almost all families used a shared or public pit toilet. Very small number of families had no toilet facilities and used open spaces for defaecation.

Fig. 3 Main source of drinking water (a) and toilet facilities (b) by setting (percentages, sexes and age groups pooled). ![]() , piped direct to house;
, piped direct to house; ![]() , public tap;
, public tap; ![]() , hand pump;
, hand pump; ![]() , well;
, well; ![]() , river;
, river; ![]() , tanker;
, tanker; ![]() , other;
, other; ![]() , own flush toilet;
, own flush toilet; ![]() , shared flush toilet;
, shared flush toilet; ![]() , public flush toilet;
, public flush toilet; ![]() , own pit toiled;
, own pit toiled; ![]() , shared pit toilet;
, shared pit toilet; ![]() , public pit toilet;
, public pit toilet; ![]() , open fields/no facilities
, open fields/no facilities
Adolescents’ diet
Dietary diversity
Taking all adolescents together in each setting, proportions achieving a DDS ≥5 ranged from 41 % in Mumbai and 44 % in Jimma to 100 % in West Kiang (Fig. 4a, see online supplementary material, Supplemental Figure 2). Median DDS showed a similar pattern, ranging from 4 in Jimma to 9 in West Kiang. Diet diversity was not markedly different between younger and older adolescents (Fig. 4b). It was lower in girls than boys in all the Indian settings, though the differences were mostly small; this was due to fewer girls than boys reporting the consumption of yellow/orange vegetables/roots and yellow/orange fruits in the past 24 h, while the opposite was true for white roots/tubers (data not shown). In Dervan, fewer girls than boys also reported eating fish, organ meat and nuts; in Pune and Mumbai, fewer girls than boys reported eating beans/peas/lentils; and in Mysore, fewer girls than boys reported having milk or milk products (data not shown).
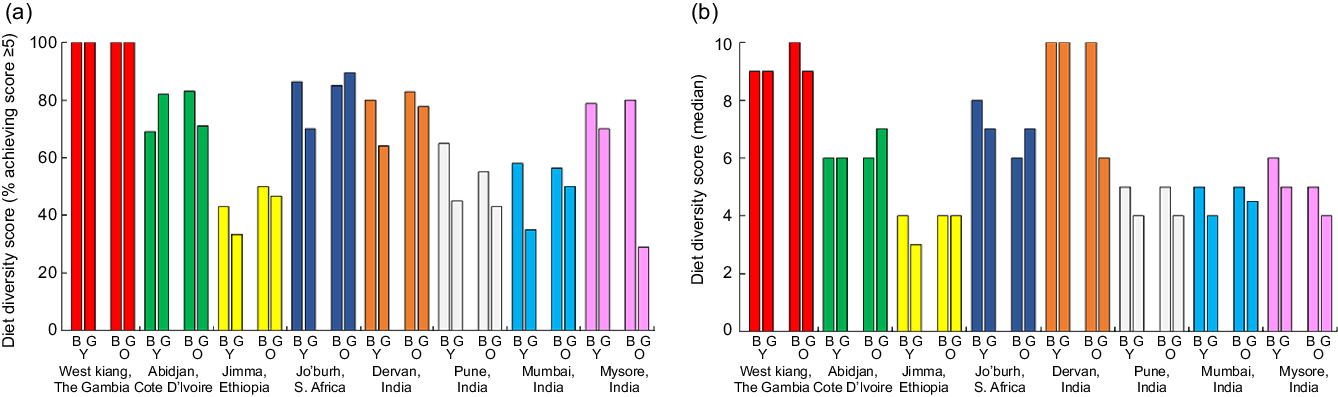
Fig. 4 Proportions of adolescents achieving a diet diversity score ≥5 (a) and median diet diversity scores (b) by setting, stratified by sex and age group. B, boys; G, girls; Y, young; O, older
Frequency of intake of foods
The frequency of eating eight selected food groups is shown in online supplementary material, Supplemental Figure 3; data are missing for Johannesburg and for some foods in West Kiang due to a misunderstanding about how these questions should be asked (missing data are labelled N/A in these figures). In all the settings with data, most adolescents ate micronutrient-rich vegetables and fruits (green leafy vegetables, yellow/orange vegetables/fruits) 2–4 times or less per week, and there were substantial proportions of adolescents who ate them less than once a week, especially in India. Protein- and micronutrient-rich foods of animal origin, such as eggs, meat and fish, were eaten infrequently in all settings. Although the intakes of milk/milk products and beans/peas/lentils were higher than those of eggs, fish and meat, most adolescents ate them only 2–4 times or less per week.
Snack foods
There were no obvious differences between boys and girls or younger and older adolescents in the consumption of snacks. The proportions of adolescents who reported eating savoury snacks in packets, bakery foods (e.g. cakes, biscuits, puffs) and sweets in the past 24 h were consistently high (70–90 %) in urban Johannesburg and rural Dervan (Fig. 5, see online supplementary material, Supplemental Figure 4). In semi-rural Pune, 86 % of adolescents reported eating savoury snacks in packets in the last 24 h, while only 7.5 % reported this in rural West Kiang. Otherwise, between 30 and 60 % of adolescents reported eating these foods in the past 24 h. Across the African sites, there was a consistent pattern suggesting that the intakes of savoury snacks, bakery items and sweets were higher in more urbanised or affluent settings; there was no clear pattern in India. The consumption of fizzy drinks varied widely across sites (Fig. 5). Over 80 % of adolescents in West Kiang, Johannesburg and Dervan reported drinking these in the past 24 h. In contrast, <20 % of adolescents in Jimma, Pune, Mumbai and Mysore did so. In West Kiang and Dervan, adolescents were probably reporting locally produced drinks, made from fruit juices/cordials/syrups with added bicarbonate to make them appear fizzy, which have less added sugar compared with branded sugar-sweetened beverages.

Fig. 5 Proportions of adolescents who ate selected snack foods in the past 24 h by setting (sexes and age groups pooled)
Mobile phones, smartphones and screen time
Ownership of a mobile phone was higher among older than younger adolescents (Fig. 6). It was the highest in Johannesburg and Abidjan (~60–70 % among older adolescents and 30–40 % among younger adolescents) and among older adolescents in Jimma (68 %). It was negligible in West Kiang for both age groups, among young adolescents in Jimma, and all the Indian centres. Most adolescents using a mobile phone had a smartphone (except in Jimma). Median hours of TV watching for leisure/entertainment ranged from 1 to 4 h in Africa and 1–2 h in India, with a large variation everywhere, and were generally higher among older adolescents (Table 2). Median time spent playing computer games was <1 h in most places, but was as high as 2 h among young adolescents in Abidjan and Johannesburg. A striking finding was that there was very little computer use for school work (median 0–1 h everywhere and in both age groups).

Fig. 6 Ownership of any mobile phone (solid bars) and a smartphone (hatched bars), stratified by age group, sexes pooled. Y, young; O, older adolescents; ![]() , any mobile phone;
, any mobile phone; ![]() , smartphone
, smartphone
Table 2 Screen time

Discussion
We collected quantitative data to describe the context of qualitative data collection, illustrate the contrast between settings and inform our thinking about the development of interventions to improve adolescents’ diet and physical activity levels in these settings. Although we included a middle-class area in one Indian setting (Mysore), we mainly targeted deprived neighbourhoods.
Anthropometry
Undernutrition (stunting and low BMI) was more prominent than overweight or obesity in most of the settings in our study. It was most prevalent in the least transitioned, rural settings and in the slums of Mumbai, where obesity was uncommon. Johannesburg had the highest prevalence of overweight/obesity (27 % overall) and yet >5 % of adolescents were stunted. The semi-rural Pune setting has experienced substantial economic improvement over the past 20 years due to electrification, irrigation, better roads and small industries, and here there were approximately equal prevalence rates of stunting, low BMI and overweight/obesity. There is an upward shift in BMI in most LMIC, and overweight and obesity are increasing, while underweight and thinness are decreasing(9). Within populations, the prevalence of thinness is inversely correlated with the prevalence of overweight/obesity(Reference Caleyachetty, Thomas and Kengne2,9) . However, inequalities in transition mean that both are often present, with persistent stunting and/or thinness in some individuals alongside emergent overweight/obesity in others – the ‘double burden of malnutrition’. South Asia and sub-Saharan Africa stand out with a high prevalence of both undernutrition and overweight(9,Reference Tzioumis and Adair10) . Few, if any, LMIC seem to have escaped from hunger and avoided the emergence of overweight/obesity(9,Reference Tzioumis and Adair10) . This has important implications for later health, because accelerated weight gain during adolescence is associated with a higher risk of type 2 diabetes, hypertension and metabolic syndrome(Reference Sachdev, Osmond and Fall11,Reference Adair, Fall and Osmond12) .
Consistent with published data, stunting was more prevalent in India than Africa(Reference Christian and Smith13). Within each of the TALENT settings, the prevalence of low BMI was similar for both age groups, while stunting was more prominent in older adolescents. This illustrates the difficulty in comparing adolescent growth across different settings. Stunting in LMIC has its onset prenatally and in infancy(Reference Christian, Lee and Donahue Angel14), and height z-scores tend to be stable through childhood(Reference Victora, de Onis and Hallal15). Thus, higher stunting rates at 15–17 years do not necessarily reflect the appearance of new cases of stunting, but could be an artefact resulting from a different tempo of growth during adolescence compared with the WHO reference. Because of variations in the onset and duration of pubertal growth, there is limited population-based data from LMIC that documents the entire period, which can start anytime from 10 to 15 years and continue until the age of ≥20 years(Reference Prentice, Ward and Goldberg16–Reference Ward, Cole and Laskey18). Information on how nutrition before and during puberty influences the pubertal growth spurt and final height as well as other aspects of human capital, such as cognitive function, is needed.
Household-level information
The household assets data give a snapshot of material wealth of adolescents’ families, and illustrate marked contrasts between the settings. Refrigerator ownership was one with most variability between settings. There is little data on how refrigerator ownership influences diet. Nigerian children whose families owned a refrigerator had higher intakes of micronutrient-rich foods; the authors attributed this to children’s greater access to fruit and vegetables(Reference Fadare, Mavrotas and Akerele19). On the other hand, a study in South Africa has found that refrigerator ownership was associated with a greater intake of sugar-sweetened beverages and greater adiposity among adolescents, which, the authors suggested, reflected more disposable wealth(Reference Feeley, Musenge and Pettifor20).
Parents’ education varied from 0 year in West Kiang to 12 years in Johannesburg, reflecting large differences in the past in LMIC’s access to universal education. There was also large variation in the employment status of mothers and heads of the household. Other studies, mostly from high-income settings, have shown a complex relationship of parental education, occupation, income and work patterns with adolescents’ diet, nutritional status and physical activity. These factors have been related to adolescents’ food security, BMI, diet quality, opportunities for the choice of diet and physical activity, family meal patterns and parental control of adolescents’ food intake(Reference Michels, Vynckier and Moreno21–Reference Loth, MacLehose and Fulkerson25). In future work in TALENT settings, it will be important to develop an understanding of how parental education and employment influences adolescents’ nutrition. Some adolescents had no access to safe drinking water and/or were using open spaces for urination and defaecation. Almost all had access to at least a shared pit or flush toilet, and a substantial number had a toilet in their house. This reflects recent improvements in water and sanitation facilities in LMIC, with India recording a significant improvement(26). Arguably, the situation in Mumbai slums was the worst, where most adolescents use public pit toilets, which are often poorly maintained. Apart from the possibility of an infection risk, lack of privacy can be a problem for girls coping with menstruation. With the level of population densities seen in the slums of ‘megacities’ like Mumbai, universal private toilet facilities seem less likely to be achievable, and current efforts are directed at improving the quality of shared facilities.
Diet
Diet diversity was the greatest in the two least transitioned rural settings, which also had the most undernutrition. This may be because of local agriculture and opportunities for home gardening and/or foraging, but food quantities were not assessed in our study. So, although the diets were diverse, they may not be sufficient to meet other dietary requirements. Diet diversity was lower for girls than boys in India. Given our small sample size, this should be interpreted with caution, but, consistent with evidence, especially from rural Indian communities, there is a tendency for boys to be fed on priority and, thus, have access to a greater variety of foods(Reference Aurino27). Our data indicate that adolescents’ intakes of micronutrient-rich fruits and vegetables and protein source foods are sub-optimal in all our study settings. This is consistent with previous data, and access to such foods partly reflects their affordability in all the settings(Reference Miller, Yusuf and Chow28,Reference Williams, Townsend and Rayner29) . At the same time, adolescents, even in rural communities, were frequently eating unhealthy snacks and drinks, often locally made and sold at extremely cheap prices. As reported in other studies in LMIC, the intakes of such foods often exceeded that of nutritious foods(Reference Keats, Rappaport and Shah30). Finding sustainable ways to improve diet quality among adolescents should be a research priority.
Screen time and mobile phone ownership
Screen time varied across settings, but adolescents in urban Abidjan and Johannesburg were spending on average ≥2 h a day watching television and ≥1 h playing computer games. The displacement of physical activity by screen time was a major concern reported by caregivers, as confirmed by other articles in this issue. Television ownership was almost universal among the families studied, except in The Gambia. TV time has been robustly linked to BMI in adolescents, through a combination of sedentariness, snacking, exposure to food advertisements and reduced sleep time(Reference Robinson, Banda and Hale31,Reference Stiglic and Viner32) . Ownership of computers, access to the internet and the use of computers for schoolwork were all markedly low. Investigators from all the settings reported that school students use internet centres and smartphones for school projects. Smartphone ownership was negligible in most settings, but ~20–40 % of young adolescents and ≥50 % of older adolescents in Abidjan and Johannesburg had smartphones. We did not collect data on this, but we are aware anecdotally that smartphones owned by family members are frequently shared with adolescents. There is evidence that smartphone usage is associated with reduced physical activity, a risk factor for obesity, and with problems of mental health, possibly because of sleep impairment and/or exposure to harmful online material or bullying(Reference Bailin, Milanaik and Adesman33–Reference Kenney and Gortmaker35). However, they are also a valuable platform to provide health information and engage adolescents in interventions to improve health(Reference Looyestyn, Kernot and Boshoff36,Reference Chaplais, Naughton and Thivel37) . Smartphone ownership among adults was estimated in 2017 at 22 % in India and 51 % in South Africa, which increased by 10–20 % between 2015 and 2017 in LMIC(38), but there is limited ownership data relating to adolescents.
Strengths and limitations
A major strength of our data is the harmonised approach across eight settings, providing valuable and contextual information about the pool of adolescents from which the focus groups were derived and for whom we have qualitative data. Data were collected by trained staff fluent in languages spoken by the participants. A limitation was that, except for West Kiang, the adolescents were recruited by schools or health workers (convenience sampling), and not population-based. A further limitation was that the sample size for quantitative data in each setting was small, limiting robust sub-group comparisons. One site (Jimma, Ethiopia) did not reach the target sample for recruitment; this could reduce the generalisability of their data, but the data remained useful in contextualising their qualitative work. Two centres (South Africa and The Gambia) did not have data on the frequency of intake of all foods, due to a misunderstanding in asking questions (they asked about the frequency of intake of foods only if the adolescent reported eating that food within the past 24 h); the frequency data are, therefore, incomplete for these two sites. Other data collected from these sites were, however, useful. Finally, the possibility of under- or overreporting (e.g. social desirability bias) could not be verified.
Conclusions
Our quantitative data captured considerable diversity in anthropometry, socioeconomic parameters, diet and mobile phone usage and screen time across the TALENT settings. Our findings imply that there is a need to address the ‘double burden of malnutrition’ across the settings and, particularly, increasing diet diversity and reducing intakes of unhealthy snack foods and sugar-sweetened beverages are important targets. One useful approach will be to work with adolescents in these communities and other stakeholders to co-create solutions that are feasible, acceptable and scalable to improve the nutrition of young people.
Acknowledgements
Acknowledgements: We thank the adolescents, caregivers and research staff who contributed to this research. Financial support: This study was funded by a Global Challenges Research Fund/Medical Research Council pump priming grant (grant number MC_PC_MR/R018545/1). The funding agency was not involved in the study design, data analysis or writing of this article. Conflict of interest: The authors have no conflicts of interest to declare. Authorship: C.H.D.F. and M.E.B. led the study, which was co-designed with contributions from all members of the TALENT consortium. Quantitative data were analysed by M.A., H.C., R.E.J., J.J., C.J., S.J., S.H.K., G.M. and K.J.R. C.H.D.F. drafted the manuscript, which was reviewed by all co-authors. P.H.-J. co-ordinated all the manuscripts and contributed to their intellectual content. Ethics of human subject participation: This study was conducted according to the guidelines laid down in the Declaration of Helsinki, and all procedures involving human subjects were approved by the following ethics committees: the Gambia Government/MRC Joint Ethics Committee, The Gambia; the Research Ethics Committee (Medical) of the University of the Witwatersrand, Johannesburg, South Africa; the Ethics Committee of the Institute of Health, Jimma University, Ethiopia; the National Research Ethics Review Board of Côte d’Ivoire; the Institutional Ethics Committee of the CSI Holdsworth Memorial Hospital, Mysore, India; the Intersystem Biomedical Ethics Committee, Mumbai, India; the Institutional Ethics Committee of the BKL Walawalkar Rural Medical College, Dervan, India; the Institutional Ethics Committee of the King Edward Memorial Hospital, Pune, India; and the Research Ethics Committee of the University of Southampton, UK. Written informed consent was obtained from all caregivers for their own and their child’s participation; written or verbal assent was obtained from younger adolescents.
Supplementary material
For supplementary material accompanying this article visit https://doi.org/10.1017/S1368980020001901.


