


The relationship between the food environment and diet-related health outcomes is well established(Reference Morland, Diez Roux and Wing1–Reference Larson, Story and Nelson5). Evidence suggests that the quality of foods purchased is related to the availability, access to and type of food retailers in one’s community. Higher density of smaller food retailers (e.g. convenience stores) and fast-food restaurants are associated with poor diet quality, and higher rates of obesity and diet-related chronic disease(Reference Morland, Diez Roux and Wing1–Reference Gibson4,Reference Caspi, Lenk and Pelletier6) . Convenience stores are a specific type of small food retailer defined as retail businesses primarily focused on offering quick purchase of food and services (e.g. gasoline) in a convenient location(7). For the purposes of this manuscript, we are including retailers with or without the sales of gasoline in the definition of a convenience store, but not including other similar small store formats such as corner stores or other limited service store types. Convenience stores are dynamic environments where customers make food purchase decisions quickly, spend limited amounts of time and visit frequently(8). Convenience stores are an important source of food purchasing for many Americans(Reference Caspi, Lenk and Pelletier6,Reference Ver Ploeg, Mancino and Todd9) . More than half of the US population visits convenience stores daily(7). In low-income and rural communities, convenience stores are ubiquitous and may be one of the primary sources of foods(Reference Campbell, Shapiro and Welsh10).
Given their importance for low-income communities(8,Reference Mozaffarian, Afshin and Benowitz11) , convenience stores are an important food retail space to consider for interventions to promote healthier food purchases. There is, however, limited evidence on effective strategies to promote healthier purchases of foods in convenience stores, in part because these food retailers are usually part of large chain and/or corporate food retail enterprise, making engagement for research and practice more challenging(Reference Gravlee, Boston and Mitchell12). Most research in small food stores focuses on interventions in corner stores(Reference Pinard, Byker Shanks and Harden13,Reference Gittelsohn, Rowan and Gadhoke14) , which are differentiated from convenience stores in that they are locally owned, independently run and typically offer a limited stock of culturally relevant food offerings (e.g. Latinx stores, Asian markets). Winkler et al. found that corporate or franchise-owned stores were more likely to have a lower healthier-to-unhealthier shelf space ratio compared with independently owned stores(Reference Winkler, Lenk and Caspi15). Interventions in corner stores have been found to be effective and feasible in increasing access, availability and sales of healthier foods as well as increasing consumers’ nutrition-related knowledge and improving dietary behaviours(Reference Gittelsohn, Rowan and Gadhoke14,Reference Ayala, Baquero and Pickrel16–Reference Baquero, Linnan and Laraia18) .
Given the evidence for corner store interventions, similar efforts within convenience store chains have the potential to be scaled and reach large population segments with corporate level buy-in. While some convenience store chains are already implementing healthier food initiatives in their stores(19), there is little research on the impact of these initiatives on customer behaviours and purchasing. Previous interventions in convenience stores have tested placing and promoting fruits and vegetables in checkout end-caps to promote sales of those items(Reference Collin Payne20), using floor arrows to direct customers to the produce section of the store and placing signage to indicate scarcity and increase customer demand(Reference Chapman, Sadeghzadeh and Koutlas21); however, a healthier checkout programme remains untested in convenience store chains.
Despite the lack of previous research on healthy checkouts in convenience stores, there are many indicators in the food retail literature that suggest the potential impact of this type of intervention. For example, evidence suggests that product placement alone can prompt purchase(Reference Kerr, Sallis and Bromby22) and that placement of products in the checkout space is particularly powerful because nearly every shopper must go through this area(Reference Almy and Wootan23). For ready-to-eat products, like most foods in a convenience store, just seeing these products can create an urge to consume them(Reference Dholakia24). This powerful combination is recognised by retailers and manufacturers with billions of dollars of trade promotions being paid each year to have products placed in prominent locations in stores(Reference Rivlin25).
The present study aimed to address this gap in the literature by (1) testing the feasibility of implementing and evaluating a healthier checkout programme in a convenience store chain and (2) evaluating the impact of the intervention on sales of healthier items placed in the checkout space.
The findings of this study contribute to the healthier food retail evidence base of intervention strategies that can be used in convenience stores. The results of this study may enhance our ability to engage retailers, non-profit partners and policymakers in discussions about healthier food retail research and policies.
Methods
Partnership
This study involved a partnership between a regional convenience store chain, the Partnership for a Healthier America (PHA), a health-promoting non-profit organisation, and a team of academic researchers. This partnership began when the convenience store chain partnered with PHA for their Shifting Retail Environments initiative(26). As part of this initiative, the retailer committed to implementing healthier practices in their stores with guidance from PHA, which in this case, included the healthier checkouts strategies. To help show impact of PHA’s initiatives, the retailer agreed to participate in an expanded evaluation of the healthier checkout strategies in their stores through the provision of retail sales data. At this point, PHA partnered with the team of academic researchers, who are all members of the Robert Wood Johnson Foundation Healthy Eating Research/Nutrition and Obesity Prevention Research and Evaluation Network (HER/NOPREN) Healthy Food Retail Working Group(27). The researchers and PHA used the guidance from the Grocery Retailer Academic Collaborative (GRAC)(28) to solidify the partnership with the convenience store corporate management. GRAC is a framework for guiding the development of partnerships between retailers and academic researchers that includes suggestions to establish a transparent and equitable relationship. In this case, this included developing a memorandum of understanding related to expectations and responsibilities of the involved parties and a non-disclosure agreement that described the sharing, use and dissemination of the sales data and other proprietary information. To ease burden on the convenience store corporate management, PHA served as the main point of contact for the study and facilitated regular communication between the research team and the convenience store chain corporate management during the planning, implementation and evaluation phases of this study.
Study design
The 3-month, quasi-experimental pilot study was conducted in twenty stores in New Hampshire. The stores were selected for their proximity to the research team and because each of these stores had a similar layout for their checkout space. Ten stores were randomly assigned to the intervention group and ten stores to the comparison group. While the stores were originally randomly assigned by the research team, later discussions with the convenience store management required forced assignment of five different stores, not included in the original sample, to the intervention group. These stores substituted the five stores that were initially randomised. The original five randomly assigned stores became ineligible due to changes in the store design and layout of the checkout space. We did not re-randomise due to limited time before the start of the pilot. The final sample of stores (n 20) in the study had an identical store layout, creating consistency among stores in the design and layout of the checkout space.
Procedures
The intervention tested the behavioural assumption that placing healthier items in the checkout space, which is a noticeable location where nearly all customers go within the store, would result in increased exposure to the healthier products and increased purchase of those healthier items. PHA and the convenience store corporate office worked together to select a total of eight healthier items for introduction into the checkout space in the intervention stores, replacing eight less healthy items that had originally been located at checkout. The convenience store corporate office created standard plan-o-grams (a visual map of how the checkout space should look with specific locations where each item should be displayed) that included the eight healthier items to be used across all intervention stores. The eight healthier items were required to meet nutrition criteria established by the PHA Healthier Packaged Food and Beverage Product Calculator Criteria based on the 2015 Dietary Guidelines for Americans(29). PHA created this online tool for food retailers, manufacturers and distributors to be able to easily identify healthier products to stock, sell and market(Reference Fox and Corbett30,31) . The eight healthier items included three varieties of dried fruit crisps (store brand), three nut-based snack mixes (store brand) and two flavours of KIND® bars. The three varieties of fruit crisps were newly introduced as part of this pilot study, while the other five healthier items were previously available in all twenty stores but not in the checkout space. In the intervention stores, all eight items were placed both in the checkout space and in another location in the store. In the comparison stores, the eight items were available in the store but not located in the checkout space. This store chain makes small weekly updates to their plan-o-grams through plan-o-gram management software where the changes are made at the corporate level, and store-level managers can log in, access the new plan-o-grams and implement the changes in their store. Consistent with this weekly protocol, the corporate management team communicated the incorporation of the eight healthier items in the checkout space to store-level managers through the plan-o-gram management software. The store managers were responsible for implementing the changes in the stores using usual protocols for changing store stock. The corporate management does not routinely check the accuracy of implementation of the plan-o-gram at the store level, but does encourage store managers to self-monitor the accuracy of the plan-o-gram implementation in their store.
Fidelity assessment
Fidelity assessments were conducted in intervention and comparison stores to assure adherence to the implementation protocols. The research team developed fidelity data collection tools based on the intervention checkout plan-o-gram provided by the retail partner and also collected information that was potentially relevant to the purchase of the new items in the checkout space. The tool has five sections: (1) store data including the date and time of data collection, and the names of the data collectors; (2) healthier product availability including position in the checkout space, price, portion size, depth of stock (defined as number of units of each item present in the shelf space, which was assessed to ensure the new healthier items would be available for purchase); (3) availability of additional items in the checkout space that were not on the intervention plan-o-gram; (4) promotion of the eight healthier items in the checkout space (e.g. marketing materials such as shelf labels or signs) and (5) information about other promotions near the checkout space (see supplementary material for a de-identified copy of the fidelity assessment tool).
A pared down version of the fidelity tool was developed for comparison stores. This tool gathered information about the eight healthier items by asking yes/no questions as to whether the items were present in the checkout space, and anywhere else in the store, as well as unit and depth of stock (number of units of each item present), of the item, if the item was marked as being present in either the checkout space or other areas of the store.
Fidelity to the intervention was assessed in nine of the ten intervention stores and three of the ten comparison stores. Two trained research assistants each conducted one fidelity check per store, for a total of twenty-four fidelity checks. Fidelity was not assessed in one of the intervention stores because there was a miscommunication between the research team and retail partner about the location of one of the intervention stores. Fidelity was only assessed in three comparison stores because none of the eight healthier intervention items were found at checkout spaces after three comparison store fidelity checks, indicating 100 % fidelity in those stores. If any of the eight healthier items had been found in the three comparison stores’ checkout spaces, all of the comparison stores would have been visited to assess fidelity. The two research assistants collected the intervention store fidelity data over two consecutive days using smartphones to enter data into Qualtrics online survey software. Comparison store fidelity data were collected using a paper survey and were later entered into Microsoft Excel. Research assistants also took photographs of any special promotions in each store visited. Inter-rater reliability scores were calculated to determine reliability of the fidelity data collection procedures.
Outcome assessment
The researchers obtained 27 weeks of weekly sales data for all twenty stores from the retail partner including both total store sales and sales of each of the eight healthier items. The sales data dates ranged from 22 April 2018 through 15 July 2018 (baseline/pre-intervention period) and 22 July 2018 through 20 October 2018 (intervention period). The research team received eight Excel spreadsheets from the retail partner. The first four spreadsheets contained information for the baseline/pre-intervention period. Spreadsheet 1 contained weekly total store sales for comparison stores, spreadsheet 2 contained weekly total store sales for intervention stores, spreadsheet 3 contained weekly sales of the promoted intervention items for comparison stores and spreadsheet 4 contained weekly sales of the promoted items for intervention stores. The other four spreadsheets contained this same information, but for the intervention period. The research team then combined the information from these eight spreadsheets into one spreadsheet (which was organised by store and by intervention status) and then imported this Excel spreadsheet into Stata/SE for analyses. Of note, if the promoted intervention item was new to the store (as in the fruit crisps), the weekly sales for that item during the pre-intervention period were minimal.
Data analysis
All analyses were conducted using Stata/SE (version 15; StataCorp LLC). The inter-rater reliability comparison between the two research assistants was calculated using percentage agreement and a weighted kappa statistic assessed overall agreement for each numeric question on the fidelity instrument in both the intervention and the comparison stores. Fidelity check data examined whether the promoted intervention items were available in the checkout space and if they were in the correct position, meaning that they are in the assigned position according to the checkout space plan-o-gram. Photographs that data collectors took of in-store promotions were not formally analysed, but were visually reviewed by the research team to provide context of the store layout and to verify fidelity data if questions arose.
The research team conducted three different analyses with the sales data. First, intention-to-treat analyses were conducted in which stores were analysed according to their original treatment assignment. Separate intention-to-treat analyses were conducted for each of the eight healthier items. To control for total store sales (thereby ensuring that any changes in sales of the promoted intervention items were not simply due to overall store sales increasing), proportions of weekly sales of the intervention items to each week’s total store sales were calculated in all stores for all 27 weeks of sales data. T-tests were then performed using these proportions to assess changes in mean baseline v. intervention sales between the ten intervention stores and ten comparison stores.
Next, aggregated sales of the eight healthier promoted items were analysed using t-tests to examine changes in mean baseline v. intervention sales (as a proportion of total store sales) between the ten intervention stores and ten comparison stores. Last, to address inconsistent adherence to the intervention (as identified by the fidelity assessment), the research team conducted per-protocol analyses. In these analyses, only stores that had the healthier items present in the checkout space were included in the intervention group analysis. The number of stores included in the per-protocol analyses therefore varied from two to six depending on whether the store had the healthier items present at checkout during the fidelity assessment.
Results
Intervention fidelity results
Inter-rater reliability scores
Among intervention stores, the average percentage agreement across all numeric questions was 95·3 %. The average Kappa across all numeric questions was 0·87, considered to be ‘almost perfect’ agreement(Reference Landis and Koch32). Among comparison stores, the average percentage agreement across all numeric questions was 92·8 %. The average Kappa across all numeric questions was 0·62, considered to be ‘substantial’ agreement. Given the high level of agreement, only scores from the first rater were used for the fidelity assessment analyses.
Fidelity to the intervention
Across the nine stores where intervention fidelity was assessed, the eight healthier items were present 48·6 % of the time and in the correct position on the store’s checkout plan-o-gram in 28·5 % of the fidelity checks. Among the fidelity checks in which the healthier items were present in the correct position on the plan-o-gram, 67·4 % had a depth of stock ≥3. Individual items were present as follows: apple fruit crisps (present in five stores), banana fruit crisps (six stores), strawberry fruit crisps (five stores) ‘ballpark’ peanut and sunflower seed nut mix (four stores), toffee peanut and cashew mix (three stores), honey-roasted nut mix (two stores), KIND® Carmel Sea Salt bar (five stores) and KIND® Dark Chocolate Sea Salt bar (five stores). None of the three comparison stores where fidelity checks were conducted had any of the eight healthier items present at checkout.
Sales data results
Intention-to-treat analyses
Table 1 summarises the average weekly sales from 13 weeks pre-intervention (baseline), as well as average weekly sales (in US dollars) during the 14-week intervention period for each of the eight healthier items in both the intervention and comparison stores. Table 2 reports changes in the weekly average proportion of sales of the eight healthier food items to total store sales (this adjusts for changes in total store sales volume) for each of the eight healthier items in both the intervention and comparison stores. There were no significant differences in adjusted sales between the baseline and intervention period among the intervention and comparison stores for any of the eight healthier items.
Table 1 Average weekly sales, in US dollars, of featured food items from a healthier checkout intervention in convenience stores (n 20) in New Hampshire, USA in 2018*
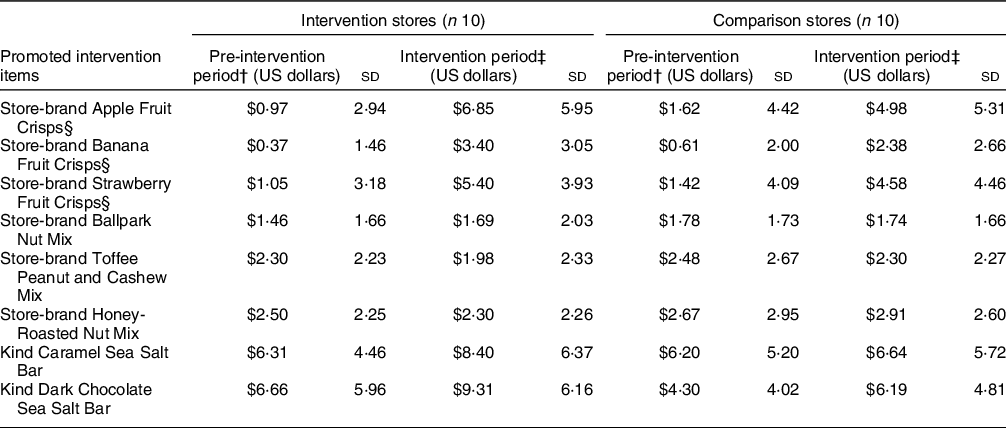
* These are raw sales numbers and do not take into account total store sales.
† Weekly average of 13 weeks of baseline sales data (April 2018–July 2018).
‡ Weekly average of 14 weeks of intervention period sales data (July 2018–October 2018).
§ Fruit crisps were not available in stores for most of the pre-intervention period.
Table 2 Mean proportion of sales of featured food items to total store sales from a healthier checkout intervention in convenience stores (n 20) in New Hampshire, USA in 2018
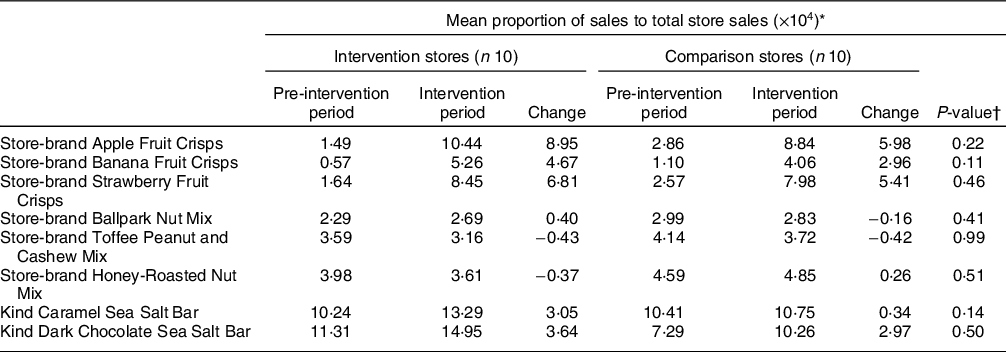
* Proportions were multiplied by 10,000 to be easier to read and interpret. Statistical analyses were conducted using unadjusted values.
† P-values are based on t-tests, comparing the proportional change in intervention stores to the proportional change in comparison stores.
Aggregate sales analysis
No significant differences in sales between the baseline and intervention period among the intervention and comparison stores were found for the eight healthier items combined (a 26·7 proportional increase in intervention stores v. a 17·34 proportional increase in comparison stores, P = 0·12). Figure 1 displays a graph of the proportion of sales of all eight of the healthier items to total store sales across the 27-week study period in the intervention and comparison groups.

Fig. 1. Average Weekly Proportion of Sales of the eight Healthier Promoted Items to Total Store Sales (Vertical line represents the intervention administration.) ![]() , Intervention stores;
, Intervention stores; ![]() , control stores
, control stores
Per-protocol analyses
There were no statistically significant differences in the average changes in sales between intervention and comparison stores for the eight healthier items in the per-protocol analyses. However, for two items, results were suggestive of statistical significance (Table 3): banana fruit crisps (a 5·68 v. a 2·96 proportional increase, P = 0·06) and KIND® Sea Salt Caramel bars (a 2·86 increase v. a 0·34 proportional increase, P = 0·07).
Table 3 Mean proportion of sales of featured food items to total store sales from a healthier checkout intervention among comparison stores (n 2–6)* and the intervention stores (n 10) that had the healthier items present at checkout

* Sample size (n) of the intervention stores in the per-protocol analysis varied from 2 to 6 stores, with only stores that actually stocked the healthier items included in the intervention sample. The actual number of stores stocking each item/included in each analysis is listed after the food item.
† Proportions were multiplied by 10,000 to be easier to read and interpret. Statistical analyses were conducted using unadjusted values.
‡ P-values are based on t-tests, comparing the proportional change in intervention stores to the proportional change in comparison stores.
Discussion
This study implemented and systematically evaluated the short-term impact of a healthier checkout intervention on food sales and developed a fidelity assessment that researchers and non-profit partners may find useful. Results from this evaluation contribute to understanding the impact of this healthier checkout intervention on sales volumes and revenue and provide important information for researchers and non-profit partners who are interested in sustainable strategies to encourage the purchase of healthier foods at checkout.
To our knowledge, this is the first study to evaluate a healthier checkout intervention in a convenience store setting. Some studies conducted in grocery retailers have found that healthier checkout lanes increase sales of healthier items(Reference Collin Payne20,Reference Chapman, Sadeghzadeh and Koutlas21,Reference Adjoian, Dannefer and Willingham33) , while others have had encouraging, but inconclusive findings(Reference Winkler, Christensen and Glumer34). Although this study did not find a significant difference in sales between the baseline and intervention periods among intervention and comparison stores, the research team did find that sales of the eight healthier items had greater increases in intervention stores, two of which were marginally significant sales changes. These results contribute to this body of evidence, highlighting the need to continue evaluating the impact of these strategies in a variety of store settings, including convenience stores.
Fidelity assessments
Through fidelity assessments, we found considerable variations in the implementation of the healthier checkout plan-o-gram with intervention stores having a range of 0 (none) to 8 (all) of the healthier products in the checkout space. This finding is consistent with the results of a recent systematic review(Reference Middel, Schuitmaker-Warnaar and Mackenbach35) on barriers and facilitators to healthy food retail interventions that found that both store stocking of promoted foods and other aspects of intervention fidelity were highly variable across other healthy food retail intervention studies(Reference Rosecrans, Gittelsohn and Ho36–Reference Mead, Gittelsohn and Roache38). Similar variation in fidelity of food product stocking was also found in food policy analyses, including the assessment of store compliance with the Minneapolis Staple Food Ordinance, a local city ordinance which required food stores to have a minimum stocking requirement of healthy foods(Reference Laska, Caspi and Lenk39).
Additional efforts are needed to support stores that implement healthier retail strategies to assure that interventions are implemented as planned. This includes working with larger chains to understand corporate policy for implementing changes in the product displays/plan-o-grams. Co-creation of health interventions with stakeholders has been shown in the literature to increase programme impact and improve health outcomes(Reference Greenhalgh, Jackson and Shaw40,Reference Halvorsrud, Kucharska and Adlington41) . Although corporate retail management was very involved with the design of this intervention (through selecting the healthier items to be placed at checkout, identifying appropriate stores to participate and providing feedback on study findings), developing a method for rolling out the intervention was deemed as something the retailer would manage. This type of intervention implementation process makes it more compatible with common retail practice and may facilitate making positive changes in the space more sustainable and easier to scale. However, given the fidelity findings of this study, co-creation of methods to assure intervention fidelity, such as encouraging corporate offices to do additional monitoring of study implementation or engaging/incentivising store-level managers to participate in the research project, may be beneficial.
Further, this study underscores the importance of research teams assessing intervention fidelity to interpret accurately the intervention outcomes. Intervention fidelity is critical for the effectiveness of the intervention, as there is often a dose–response relationship where interventions implemented with higher levels of fidelity, or individuals with the highest exposure to the intervention experience the greatest impact/outcomes(Reference Baquero, Linnan and Laraia42–Reference Shin, Surkan and Coutinho46). Fidelity issues that are not addressed in intervention impact analyses have the potential to attenuate the strength of the findings of healthy food retail interventions(Reference Trude, Kharmats and Jones-Smith47), limiting the strength of the evidence around retail interventions.
Working with retail chain partners and other stakeholders
This study provides important lessons for working with convenience store chain partners. Several issues that came up along the way impacted intervention implementation. For example, our retail partner ran into procurement issues causing delays in the original implementation timeline, while they re-assessed what other healthier options could feasibly be procured and stocked in the checkout space. Additionally, the retailer did not initially understand all the business aspects that could impact the research design. For example, this study was planned to be conducted in the state of Maine, where a member of the research team is located. In working with the retail partner, the researchers learned that the retail chain was conducting other market research in Maine stores, that would impact the study design. Thus, the partners transitioned the pilot location to stores in New Hampshire to allow for a cleaner intervention design. While this change was preferred by the research team, the additional travel was not included in the original study budget; thus, this change limited the ability of the research team to visit stores in-person. Other examples of this included changing the intervention stores after the randomisation process or conducting promotions of certain items during the intervention period, which researchers only learned of during the fidelity check and data analysis period.
Finally, it is essential to consider outcomes that are important to each stakeholder. After running preliminary analyses, the research team and PHA partners shared our findings with the retail partner, as well as learned about the retailer’s own independent evaluation of the success of the pilot intervention. The retailer expressed concern about potential for ‘opportunity costs’ or losses in revenue because of items that were displaced by the healthier products in the checkout space. In future studies, key factors that each partner associates with programme success (or lack thereof), such as these ‘opportunity costs’ should be discussed in the planning process. In addition, researchers should examine different intervention designs to address the business bottom line and operating concerns. While the analyses conducted by the research team (presented above) did not allow for analyses of these potential losses, it is important to understand the retailer’s perspective when determining the success of an intervention. This allowed the research team to discuss future research directions with the retailer and other convenience store industry stakeholders.
Study strengths and limitations
The study has several strengths: first, the use of objective sales data as a main outcome was a significant strength, as few healthy retail interventions have been able to access convenience store sales data. The strong partnership between the retailer, the academic research team and the non-profit partner made this evaluation possible. The use of the GRAC framework aided in the success of this partnership through setting up clear and equitable expectations for the roles and responsibilities of each partner documented in the memorandum of understanding and for the use of shared sales data and other proprietary information documented in the non-disclosure agreement. Third, the research team developed and implemented rigorous fidelity assessments in the intervention stores which identified implementation issues and allowed additional statistical analysis to address these issues. Finally, while there were some miscommunications between the partners, which is to be expected with any new collaboration, there was also regular communication and feedback between the retailer, non-profit partner and research team that ultimately strengthened the study design. This communication allowed the research team to share findings with the retailer, obtain additional information about the retailer’s perspectives on the study findings and collaboratively discuss next steps, including suggestions for future research.
While this intervention had many strengths, it is important that the limitations are noted. First, the intervention was shorter than initially planned due to delays in implementation related to product procurement issues. Additionally, the small sample of twenty stores and broken randomisation limited our ability to test the effect of the intervention. Future studies are needed to determine the impact of a healthier checkout intervention over longer times and across a larger sample of stores. In addition, the retail partner ran promotions that included some of the healthier checkout items during the intervention period that may have impacted sales. Specifically, a buy-one-get-one free promotion was run on some of the eight healthier items at the same time that they were introduced to the checkout location by the retail partner. In this promotion, the customer could purchase a healthier beverage (i.e. bottled water) and receive a free healthier snack item, which included the three healthier nut mix products. Because the promotion provided the healthier snack items for free, they were not captured in the sales data analyses conducted for this study. The research team was unaware of this promotion until after the promotion was being implemented. Because the promotions occurred in both intervention and comparison stores, we hypothesise that the effects of the promotions impacted both intervention and comparison store sales similarly; thus, we are still confident in the results presented here. Additionally, three of the healthier promoted items (the fruit crisps) were introduced into the stores shortly before the intervention period began, so there were only a few weeks of pre-intervention period data available for those three items. This pilot study demonstrates that it is necessary to account for the placement and promotion of healthier and unhealthier foods throughout the store in evaluation plans to truly capture the additional effect of these strategies in purchasing healthier foods. Given that this was a pilot study, the research team completed as much fidelity assessment as was feasible within the study parameters. Fidelity assessments are critical to the monitoring of the intervention implementation as demonstrated in this study. A strength of this study was the rigorous assessment of fidelity in intervention stores; however, because the retailer does not routinely conduct fidelity assessments of the plan-o-gram in stores, we are unable to assess if the fidelity issues we saw were unique to the intervention or were similar to the level of deviation from the plan-o-gram that is normally seen in the store. This study could have been strengthened through additional fidelity assessments in the comparison stores, and additional fidelity checks would have been completed if any of the eight healthier items were found to be in the checkout space of the three comparison stores that were assessed for fidelity. However, since none of the sampled comparison stores had any of the healthier products at checkout and because the fidelity data collection required out-of-state travel which was not originally budgeted for in the study, the research team chose to prioritise robust fidelity assessment in the intervention stores and limit the scope of the fidelity data collection of comparison stores. Future studies would benefit from additional monitoring of intervention fidelity. In addition, in this study, the data collectors were not blinded to the store treatment condition (intervention v. comparison); thus, they may have positively biased the results of the fidelity assessment in intervention stores; however, the use of two data collectors and calculation of IRR between the data collectors reduces these concerns. Finally, the research team was unable to capture the ‘opportunity costs’ of displacing the eight less healthy items that were replaced in the checkout space by the eight healthier items.
Conclusion
Working with a convenience store chain partner is feasible for delivering healthy retail interventions; however, all parties involved would benefit from having clear communication and expectations set at the beginning of the study. The GRAC framework(28), developed by the HER/NOPREN Healthy Food Retail Working Group, provides helpful guidance on how future interventions can successfully set expectations, develop communication channels and build partnerships between researchers, retailers and non-profit partners so that the partnership leverages the strengths of each partner, facilitates building trust and establishes clear expectations.
This healthier checkout intervention was implemented in a convenience store chain. Placing healthier items in the checkout space may increase sales of those items; however, given that this was a pilot study, these results lacked the statistical power to be able to find significant relationships. Additional studies with larger samples and longer duration are needed to further explore this promising healthy retail strategy.
Acknowledgements
Acknowledgements: The authors would like to thank the regional convenience store chain that participated in this study, the Partnership for a Healthier America for their technical assistance and resources, and the two research assistants Caroline Cooper and Whitney Huff for conducting the fidelity data collection. Financial support: This work was funded by Healthy Eating Research (HER), a national programme of the Robert Wood Johnson Foundation (RWJF). This journal article was supported by the Grant or Cooperative Agreement Number (5 U48 DP005021-03) funded by the Centers for Disease Control and Prevention, Prevention Research Center Program. The funders had no role in the design, analysis or writing of this article. Its contents are solely the responsibility of the authors and do not necessarily represent the official views of the Centers for Disease Control and prevention or the Department of Health and Human Services. Conflict of Interest: None of the authors has conflicts of interest to declare. Authorship: B.B., E.A.S. and C.S. designed the study, and managed all study activities. B.B. and E.A.S. conceptualised this manuscript. M.P. conducted data collection activities and prepared the methods of the study. M.D.M. and L.C. conducted the data analysis. L.A.L. provided overall feedback on the study design and manuscript. All authors contributed to the preparation of the manuscript. Ethics of human subject participation: The project was deemed not to involve human subject research and was determined exempt from IRB review and oversight as defined by 45 CFR46.101 (b) (2) by the University of New England Institutional Review Board.
Supplementary material
For supplementary material accompanying this paper visit https://doi.org/10.1017/S1368980021001488


