


In the European Union, multiple claims regarding sugar content are defined to help the consumer identifying beneficial nutritional properties of foods (e.g. “Low in sugar”, “no added sugars”, “sugars-free”). However, previous studies showed that foods having a claim do not always have a better nutrient profile that foods without( Reference Taillie 1 , Reference Emrich 2 , Reference Kaur 3 ). The objective of this study was to analyse the sugar content of soft drinks across Europe, stratifying by the presence of a sugar claim, using a branded food composition database.
The labelled sugar content of soft drinks launched from 2014 to 2016 in nine European countries was obtained from the Mintel Global New Products Database. Products having any kind of claim regarding (added) sugars (Low in/No/Reduced) were compared with products without claims in the whole zone studied, using t-test. Patterns between countries were assessed with an ANOVA.
Sugar content in products with and without claims varied between countries (p < 0·01). Overall, products with a claim had a significantly lower mean sugar content than products without (3·2 and 8·3 g/100mL respectively, p-value < 0·0001). However, different patterns were observed inside countries, with overlapping inter-quartiles ranges between the two groups of products (Figure).
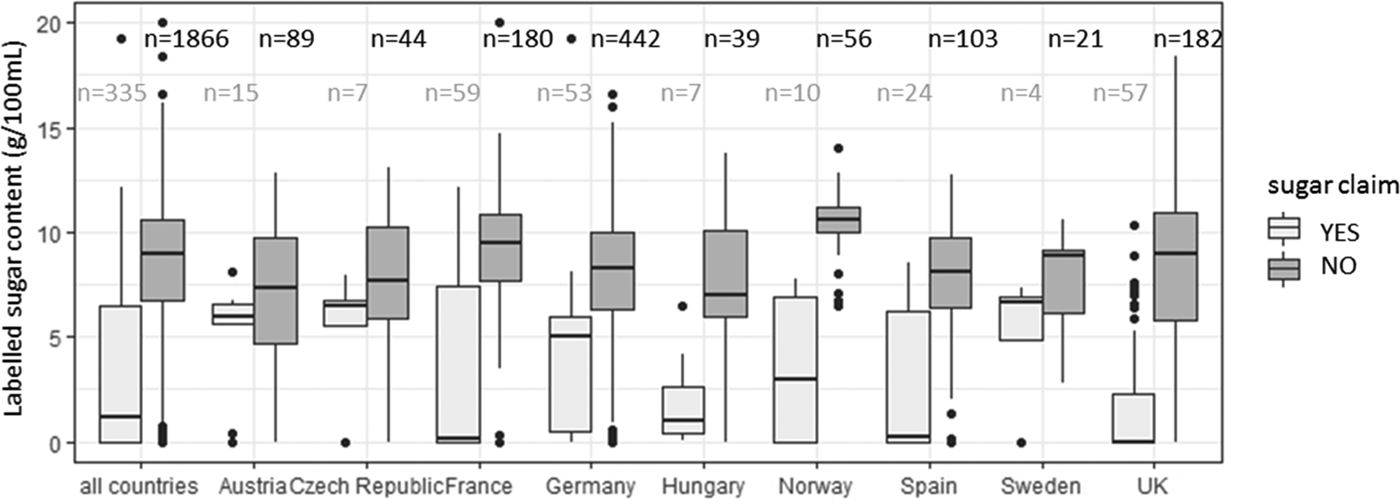
Figure: Sugar content in soft drinks in Europe
The sugar level of products across Europe showed variability between countries, linked to different preferences and habits. At a country level, products having a content claim had a lower mean sugar content than products without claims, but products with lower content in sugars did not necessarily bear a claim. These observations need to be confirmed in other food categories.
Acknowledgements
The authors thank Mintel for providing with data for this analysis.

