


Food legislation in outline
There is a legal requirement to provide information on food labels. The laws regarding food labelling that apply in the UK are based on the European Union's (EU) community legislation. This will remain the case for the foreseeable future while negotiations with the EU take place. It is expected that, at the point when the UK leaves the EU, the pertinent legislation will be incorporated into UK law, although over time the legislation may evolve. There are two pieces of particularly relevant legislation: the Food Information for Consumers (FIC) Regulation(1, 2) and the Nutrition and Health Claims Regulation(3).
Food information to consumers regulation
This FIC(1) came into force at the end of 2011 and covers all aspects of food labelling. It specifies information that must be placed on food labels (of the majority of pre-packed foods) by law. A minimum font size has also been set for this information. Exceptions, not covered by the legislation, include supplements and foods for specific groups, which are covered by other legislation. The majority of rules have applied since December 2014, with mandatory provision of back-of-pack (BoP) nutrition information from December 2016. Previously, providing nutrition information was optional unless a nutrition or health claim (see later) was made. Front-of-pack (FoP) labelling remains optional but the format that must be used has been specified in the FIC Regulation.
One of the ways of accessing information about the composition of a food or beverage is to look at the ingredients list. By law(1) this includes all the ingredients of the food (including water and food additives), in descending order of weight, according to the amounts that were used to make the food. The ingredient names must be listed in the language relevant to the country where the food is being sold. There are fourteen sources of allergens that have to be highlighted in the ingredients list if they are present: milk, eggs, nuts, peanuts, soya, foods containing gluten (wheat, barley, rye), sesame seeds, fish, crustaceans, molluscs, mustard, celery, lupin, sulphur dioxide. Typically this is done using bold text.
BoP nutrition labelling information, in the form of a nutrition table, has been compulsory on all pre-packed foods in the EU since December 2016(1). In fact, for products that provided BoP nutrition information prior to 2014, declarations using the revised format have been a legal requirement since December 2014. Certain nutrients have to be included in the table, even if the level in the product is zero. The order of these nutrients is also regulated via the FIC Regulation. Additional nutrients can be included on a voluntary basis, for example fibre, polyunsaturates. A list of vitamins and minerals can also be listed provided that at least 15 % of the reference intake (RI) is provided per 100 g food or 7·5 % RI/100 ml for beverages. For single serve packages, the 15 % rule applies to both foods and beverages. The RI for vitamins and minerals, referred to as nutrient reference values in some instances, are prescribed in the legislation(1) and are often different from the reference nutrient intakes that are used in the UK, i.e. those to be found in the Dietary Reference Values report(4).
FoP labelling remains voluntary although rules apply when such information is provided. Two options are allowed: energy alone (not calories; with values provided in both kcal and kJ), or energy in combination with (total) fat, saturates, (total) sugars and salt (as a measure of sodium). National schemes for the presentation of this information are allowed, provided they do not mislead consumers or conflict with the FIC Regulation. The scheme recommended by the UK government since 2013 (and updated in 2016), to provide consistency, is the multiple colour coded traffic light format(5). Consistency was considered important because multiple formats in the marketplace may impede consumer comprehension and discourage use(Reference Grunert and Wills6, Reference Draper, Adamson and Clegg7). The scheme combines information about the amount (in grams) of the specified nutrients per portion of food, information about the proportion this amount represents of the RI for each nutrient (again reference values are prescribed in the legislation(1)), with colour coding (red, amber, green) and the words high, medium or low (Fig. 1). The colour coding and the words are determined by the criteria shown in Table 1. If FoP information is provided in addition to the mandatory BoP panel, the serving size needs to be declared (150 g in the example shown in Fig. 1), as does the energy value for 100 g, provided in kJ first, followed by kcal. The RI used for labelling are the values derived for women based on a daily energy intake of 8400 kJ (2000 kcal): 70 g total fat; 20 g saturates; 90 g total sugars; and 6 g salt.
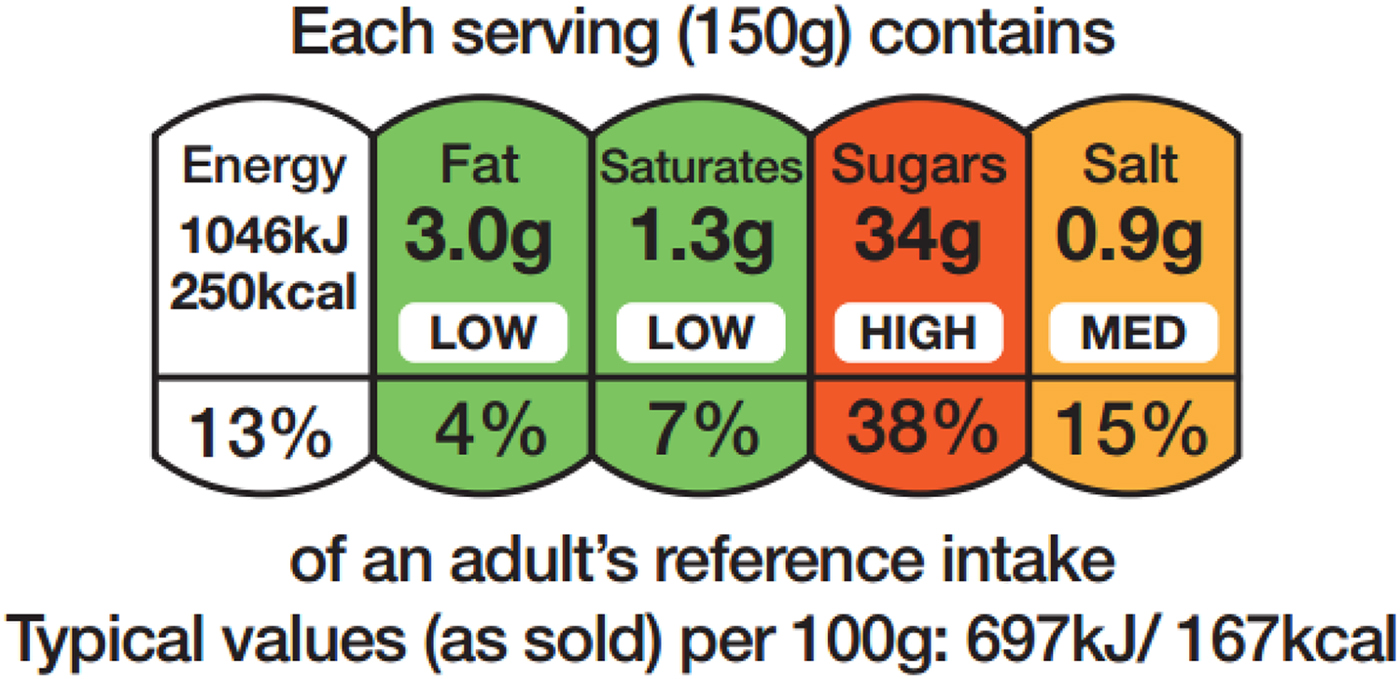
Fig. 1. An example of the colour coded multiple traffic light scheme used in the UK.
Table 1. Thresholds used in the UK front-of-pack labelling scheme. The thresholds shown are those for foods; different thresholds apply for drinks(5)
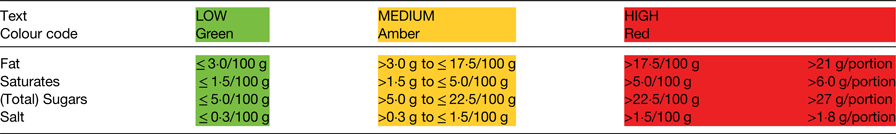
For foods in the red category, in portions or servings of <100 g, cut-off points between amber and red for each nutrient (e.g. fat) have been set at 25 % of the reference intake (RI). For portions/servings bigger than this, the cut-off points have been set at 30 % of the RI.
Nutrition and health claims
In December 2006, EU decision-makers adopted a Regulation on the use of nutrition and health claims for foods(3). This established harmonised EU-wide rules for the use of health or nutritional claims on foodstuffs, and the process for establishing the scientific validity of the claims. One of the key objectives of this Regulation is to ensure that any claim made on a food or drink label in the EU is clear, reliable and substantiated by scientific evidence(3). Another objective of the legislation is to encourage innovation in the food industry. Although the rules laid down in the Regulation may change in the UK in the future, following exit from the EU, these rules continue to apply in the meantime and are expected to be subsumed into UK-specific legislation following exit from the EU.
Before 2007, there was no formal regulation on claims but there were voluntary schemes in some countries, including Finland, the Netherlands, Sweden and the UK. The Regulation(3) covers all foods, drinks and dietary supplements sold in the EU and it applies to all commercial communications, including the food label itself, advertorials and other promotional materials. Any claim made should be truthful and should not attempt to mislead consumers. Also, it should not call into question the safety or nutritional content of other foods or the adequacy of a balanced diet. The claim itself must apply to the product as consumed, prepared according to the manufacturer's instructions, and the effects described in the claim must be understandable to consumers. Claims about preventing, treating or curing a disease are not permitted. Also not permitted are: claims on alcoholic beverages (more than 1·2 % alcohol) other than reference to low/reduced alcohol or energy; claims that suggest health could be affected by not consuming the product; claims that make reference to a rate or amount of weight loss; and claims that make reference to recommendations of individual doctors and health professionals.
An increasing number of foods sold in the EU now carry nutrition and health claims. Permitted nutrition claims are defined in legislation(3) and a register of permitted health claims now exists (see later).The scientific assessment of evidence in support of health claims is carried out by the European Food Safety Authority (EFSA), an independent scientific body whose role is to provide scientific advice to the European Commission (EC). The process is described in more detail later. The EC uses EFSA scientific opinion on the evidence in support of a specific claim, alongside consideration of consumer understanding of the claim, to decide whether to approve or reject the claim.
What types of claim are covered?
Nutrition claims
Nutrition claims state or suggest that a food has beneficial nutritional properties, by describing what a food or drink contains in reduced or increased amounts, or does not contain; for example, source of vitamin C, low fat, high fibre, energy reduced, sugar-free, high in PUFA(3). In order to make the claim, conditions of use (COU) have to be followed. Permitted nutrition claims and their COU are listed in an Annex to the Regulation and on the EC website(8). The COU has been made consistent with the Food Information to Consumers Regulation (1169/2011)(1) that came into force in December 2014, which governs nutrition labelling. Examples of the COU for particular nutrition claims are:
Source of vitamin C(3): to make this claim, a food has to contain at least 15 % the nutrient reference value (NRV) for vitamin C per 100 g and a drink at least 7·5 % of the NRV for vitamin C per 100 ml. To claim ‘high in’ vitamin C, the food or drink has to provide at least 30 or 15 %, respectively. Note that the term RI is often used on labels instead of NRV. The same rules apply for a list of other vitamins and minerals for which NRV have been set but if a nutrient is not on the list, a claim cannot be made.
(1) Low in fat(3): the food contains no more than 3 g fat/100 g or, for a liquid, no more than 1·5 g fat/100 ml. A particular exception is semi-skimmed milk, for which the rule is no more than 1·8 g fat/100 ml.
(2) High in fibre(3): at least 6 g fibre/100 g or at least 3 g fibre/418 kJ (100 kcal). The threshold for source of fibre is 3 g/100 g.
(3) Energy reduced(3): the energy (calorie) content has been reduced by at least 30 %.
(4) Sugar-free(3): contains no more than 0·5 g sugars/100 g or 100 ml.
(5) High in PUFA(3): at least 45 % of the fatty acids present are polyunsaturated and together these provide more than 20 % of the energy in the product.
Health claims
A register of permitted and rejected health claims is published by the EC(9). The scientific opinions from EFSA Dietetic Products, Nutrition and Allergies Panel, which detail the decisions on each of the submitted claims, are published in EFSA official journal. A health claim is defined in the Regulation as any claim that states, suggests or implies that a relationship exists between a food category, a food or one of its constituents and health. The Regulation(3) sets out the approval processes for the different categories of health claims (known as Article 13·1, Article 13·5, Article 14(a) and Article 14(b) health claims), which are summarised later.
Article 13·1 health claims
Article 13·1 health claims are those supported by ‘generally accepted scientific evidence’. There has been some confusion as to exactly what this means. The claims accepted onto this list are generally those that are supported by substantial scientific evidence that is already in the public domain and is likely to be found, for example, in a standard nutrition science text book. Examples of approved Article 13·1 health claims(9) include:
(1) Protein contributes to the maintenance of muscle mass.
(2) Iron contributes to normal oxygen transport in the body.
(3) Vitamin D contributes to the maintenance of normal bones.
(4) Folate contributes to maternal tissue growth during pregnancy.
The word ‘contributes’ often features, emphasising that physiological function often requires a number of nutritional (and other) inputs. Also, the word ‘normal’ often features in these permitted claims, and research with consumers suggests that this terminology is not always well understood.
The evaluation procedure for Article 13·1 claims began once the Regulation(3) was introduced and involved the competent authorities of each Member State compiling a list of potential claims and submitting these to EFSA over the period 2008–2010. A list of supporting references was provided for each claim but a full dossier of evidence in support of each claim was not required (as these claims are intended to be supported by generally accepted scientific evidence). Approximately 40 000 potential health claims were submitted. The list was whittled down to about 4000 claims once duplications and ineligible claims were removed. The scientific basis of these claims was assessed by EFSA on behalf of the EC. The EC then published lists of accepted and rejected Article 13·1 claims in the Community Register of claims in May 2012. These claims officially entered into law on 14 June 2012 and businesses were required to comply with the published list by December 2012, in line with the 6-month transition period allowed in the Regulation. The Article 13·1 list of health claims is now in effect closed, although a number of submitted claims on botanical substances are currently on hold and it is assumed that published opinions, resulting in acceptance or rejection, on these will follow at a later date.
Article 13·5 health claims
Article 13·5 health claims are those based on more recently generated scientific evidence, i.e. more recent than the evidence used for 13·1 claims, and hence potentially less accessible than the type of evidence required for the latter. Applicants wishing to make an Article 13·5 claim must submit a detailed dossier providing all the evidence for the claim. This is considered by EFSA, which then submits its opinion on the strengths and weaknesses of the evidence to the EC; the EC makes the decision to accept or reject the claim, taking into account consumer understanding as discussed later. Articles 13·5 (and 14) allow application for a ‘proprietary’ health claim, which is a claim that is reliant for its substantiation on data owned by a company or individual and not currently in the public domain. In this case, if approved, the health claim cannot be used by companies other than the applicant for 5 years following its acceptance onto the health claims register (examples include a claim for the effect of a slowly digestible starch on postprandial blood glucose and claims for an effect of cocoa flavanols on the elasticity of blood vessels(9)). Proprietary data submitted as part of a successful health claim dossier will only lead to a proprietary health claim if EFSA agrees that the claim's acceptance could not have been reached without the proprietary data. If the same conclusion could be drawn from the published data alone, the health claim is unlikely to be granted proprietary status.
Article 14 health claims
Article 14 health claims are those that relate to either reduction of disease risk (Article 14a) or to children's health and development (Article 14b)(3). As with Article 13·5 claims, a detailed dossier of evidence must be submitted in order to apply for an Article 14 health claim. Although claims on disease risk reduction are permitted (Article 14a), the claim must refer to the effect on a risk factor for a disease rather than on the risk of the disease directly. For example, reduction of blood cholesterol as a risk factor for heart disease rather than the reduction of heart disease risk per se. This distinguishes the European Regulation from the rules that exist in some other countries, e.g. the USA where a direct relationship with disease risk, rather than with a surrogate marker of risk, is allowed. So, definitions of ‘health’ claims differ and the level of evidence required to support the link between specific nutrients and risk factors (Europe) and diseases (USA) also varies between countries. In the USA, for example, health claims are permitted on the basis of weaker evidence (known as a qualified claim) so long as the claim is accompanied by specified disclaimers, such as ‘limited and not conclusive evidence suggests ….’. For unqualified claims, associated with stronger evidence, significant scientific agreement exists and so no disclaimer is required. The situation in Europe is discussed in more detail in Buttriss(Reference Buttriss10).
Examples of approved Article 14a health claims are given below(9). All of the words in the claim (i.e. both sentences) have to be included and for some claims, there are specific COU, which are detailed in the published record(9):
(1) Oat β-glucan has been shown to lower blood cholesterol. High cholesterol is a risk factor in the development of CHD(9).
(2) Plant sterols and plant stanol esters have been shown to lower blood cholesterol. High cholesterol is a risk factor in the development of CHD(9).
Health claims referring to the development and health of children (Article 14b) should be substantiated with data obtained in studies conducted in children specifically(3). As with Article 13·1 claims, the word ‘normal’ often features and the wording is often quite detailed. Examples of approved claims in this category(9) include:
Reference to general non-specific health benefits
Article 10·3 of the Regulation(3) concerns references to general non-specific benefits of a nutrient or food for overall good health or health-related well-being. Such statements can only be made if accompanied by a specific authorised health claim, which must appear next to or following the generic statement. For example, a product claiming to be ‘good for you’ could support this using a claim about its vitamin content e.g. ‘Contains vitamin C. Vitamin C contributes to the normal function of the immune system’. As discussed earlier, use of ‘contains vitamin C’ requires that the food or beverage meets the COU for ‘source of’, which is at least 15 % of the NRV (RI) for a food(1).
Nutrient profiles
The Regulation(3) includes reference to a nutrient profiling system which, once in place, would restrict the use of both nutrition and health claims to those ‘healthier’ foods/drinks that comply with the profile. The Regulation states that health claims will not be allowed unless all of the nutrient profiling criteria are met. It states that nutrition claims would be permitted on products that fail to meet no more than one criterion but the nutrient threshold that is exceeded would have to be stated on pack e.g. low fat, high in sodium.
The nutrient profiling system was scheduled for 2009 but has yet to emerge. A draft system was developed with thresholds for sodium, SFA and sugars for different food categories. Although extensive discussions with EFSA and with stakeholders have taken place and continue, no system has so far been agreed.
The delay has resulted in uncertainty for those considering investing in research that might support a health claim because products that are eligible to make a nutrition or health claim now (in the absence of the nutrient profiling system) could be prevented from doing so in the future, depending on the structure of the nutrient profiling system adopted. The process used to assess claims applications has been summarised by Buttriss(Reference Buttriss10) and official guidance from EFSA has recently been updated(11, Reference Turck, Bresson and Burlingame12).
Do shoppers use information on food labels?
Nutrition information on food labels has been considered a means of encouraging customers to make healthier choices when shopping for food. In recent years, the traditional nutrition information table situated on the BoP has increasingly been supplemented with FoP information in the UK. FoP formats are typically based on four key nutrients (total fat, total sugars, saturates, sodium (expressed as salt) plus energy, as shown in Fig. 1).
But do shoppers notice these labels, do they read and understand them and do they use them in purchasing decisions? Much of the published research was undertaken prior to the FIC Regulation coming into force. For example, Grunert et al. (Reference Grunert, Wills and Fenandez-Celemin13) studied these questions using a combination of in-store observations in three major supermarkets, in-store interviews and questionnaires filled in at home. The respondents’ nutritional knowledge was also measured. The supermarkets all provided FoP signposting on their own brand products although the formats were different in the three stores (guideline daily amount (GDA) labelling, traffic lights or traffic light colour-coded GDA labelling). Across six product categories (ready meals, soft drinks, yoghurt, breakfast cereals, confectionery, salted snacks), 27 % of these UK shoppers were found to have looked at nutrition information on the label before making a selection, using objective measures, with GDA labels and the BoP nutrition table being the main sources consulted.
Studies based on self-reported behaviour have found far higher percentages of subjects (40–60 %) claiming the use of label nutrition information sometimes or often, but this is suggested to be over-reporting associated with social desirability bias(Reference Grunert and Wills6). In a pan European study (UK, Sweden, France, Germany, Poland, Hungary), using objective measurement, on average just 16·8 % of participants made use of label information. This ranged from 8·8 % in France to 27 % in the UK(Reference Storcksdieck genannt Bonsmann and Wills14). Again, participants were able to use different labelling systems similarly successfully to identify the healthier options out of a choice of three meals(Reference Grunert, Fenandez-Celemin and Wills15). This lower usage than claimed aligns with another UK study(Reference Malam, Clegg and Kirwan16).
Understanding of FoP labels, measured via a variety of tasks, was high, with up to 87·5 % of respondents being able to identify the healthier product in a set of three(Reference Grunert, Wills and Fenandez-Celemin13). Regression analysis showed that usage mainly related to interest in healthy eating, whereas an understanding of the nutrition information mainly related to nutritional knowledge. Both, in turn, were reflected by demographic variables but in different ways. So the majority of respondents in this study had little difficulty in understanding FoP nutrition information and in putting it to use in making inferences about the healthiness of products. Ease of use was similar for the three formats tested, GDA labelling, traffic lights and traffic light colour-coded GDA labelling. This finding is aligned with other research from the UK(Reference Malam, Clegg and Kirwan16).
It is often assumed that the major hurdle preventing more use of nutrition information is that nutrition labelling is difficult to understand for many people and that finding the optimal format will increase usage rate. But the results from Grunert et al.(Reference Grunert, Wills and Fenandez-Celemin13) suggest that the degree of understanding is much higher than the extent of usage (70–90 % v. 27 %). So, why does the high ability to understand the information not translate into higher usage? Their research found that the degree of use is product category specific. For example, seeking nutrition information was most likely when the product category was yoghurt, which was considered to have a healthy image, and least likely for confectionery, perceived as indulgent. Grunert et al. (Reference Grunert, Wills and Fenandez-Celemin13) note that this effect has been reported in other studies(17, 18) and suggest that this finding signals the opportunity to consider different approaches for different food categories. For example, are there merits in using energy (calorie) labels as the approach of choice for confectionery, as is already happening in some product ranges?
The analysis of demographic determinants by Grunert et al. suggests that understanding is mainly related to nutritional knowledge whereas, with usage, the effect of demographics is completely mediated by interest in healthy eating, which they found to be higher in higher social grades and among women and older people(Reference Grunert, Wills and Fenandez-Celemin13). It was also somewhat poorer for people with higher BMI and, surprisingly, in people living with children under age 16 years.
So, in this study, usage is influenced by an interest in healthy eating (motivation to eat healthily) and understanding by nutritional knowledge(Reference Grunert, Wills and Fenandez-Celemin13). Grunert et al. pose the question whether the debate on the best form of FoP nutrition labelling has concentrated too much on understanding and too little on the motivation for healthy eating(Reference Grunert, Wills and Fenandez-Celemin13). They suggest that only when labelling policy is embedded in a broader nutrition policy that uses multiple approaches to increase interest in healthy eating can both ‘understandability’ and use of nutrition information on food labels be expected to increase. Since this work was published, BoP nutrition labelling has become mandatory and, in the UK at least, FoP labelling is even more commonplace and consistent.
In some European countries including The Netherlands and Sweden, health symbols have been adopted, such as the Choices Logo(19) and the Keyhole(20), respectively. Their use requires foods to fulfil certain nutrition profiling criteria before becoming eligible to carry the logo. A study by Van Herpen et al. (Reference Van Herpen, Hieke and van Trijp21) compared several different formats (traffic light labels, nutrition tables and symbols), finding that all labels helped consumers differentiate healthy v. less healthy products compared with a no-label control; but to different degrees. Multiple traffic lights were particularly effective both within and between product categories. Also, reference point information (the nutrition table) was found to be important; but less helpful in isolation, that is in the absence of FoP information. Signpost logos that focus on overall healthfulness were least effective when used in isolation(Reference Van Herpen, Hieke and van Trijp21). Related studies in Germany and Holland showed that all three objectives below were met by a scheme that included reference point information at the nutrient level e.g. the traffic light label (the approach now adopted in the UK). The objectives were: communicated product healthfulness across different categories, and within a category, and communicated product healthfulness when viewed in isolation and in comparison with another product. In summary, evidence to date suggests that preferences for FoP schemes vary from country to country(Reference Grunert, Wills and Fenandez-Celemin13–Reference Grunert, Fenandez-Celemin and Wills15) but this may in part be the result of familiarity and relative support for different schemes by government and non-governmental organisations. Generally, studies have found FoP information to be more effective than the BoP nutrition facts panel in conveying nutrition information to shoppers(Reference Van Herpen, Hieke and van Trijp21).
Several studies have considered the way in which traffic light colours are interpreted. For example, in an online choice experiment, Scarborough et al. (Reference Scarborough, Matthews and Eyles22) asked subjects to compare twenty pairs of the randomly selected FoP labels for ‘ready meals’ from a total of 300 and to select the ready meal that they considered the healthier of the two. The presence of reds was found to be more important in determining the decision than greens. Also, saturated fat and salt had a greater influence on the decision than sugar or total fat. But of course, this may have been influenced by the external environment at the time of the experiment, in particular, topical media coverage.
The government has issued some guidance on interpretation of the colours used in FoP labelling(5):
(1) When you are choosing between similar products, try to go for more greens and ambers, and fewer reds, to help you eat a healthier diet.
(2) While the colours provide at-a-glance information, the % RI information will give you a little more detail about how much of an average adult's daily intake limit of each nutrient is in a portion and will help you put it in the context of a healthy balanced diet.
(3) The %RI also enable you to make more accurate comparisons between equal portions of products. You can use the detailed RI information to help you choose between products that have the same colour per 100 g/ml or the same portion size.
In 2017, following a trial comparing four different approaches in sixty supermarkets (shown in Fig. 2), the French government opted for the NUTRI-SCORE model of FoP labelling, developed by Hercberg and colleagues. The other models tested were: a scheme based on the UK multiple traffic lights approach; a monochrome approach based around RI; and the so-called SENS developed in France. NUTRI-SCORE is a derivative of the UK approach to determining whether products can be advertised to children, often referred to as the OfCOM model, which scores foods and drinks on the basis of their content of energy, total sugars, saturated fat and salt, and subtracts from the total a score derived from the content of protein, fibre and fruits/vegetables/nuts. The French NUTRI-SCORE scheme contains a few adjustments, for example, cheese is treated differently than in the UK system. The resultant number emerging from the algorithm determines which colour the food or drink attracts, on a five-point scale (A–E), which are colour coded green through to red (Fig. 2). Rating systems are also used elsewhere, for example the Australian government recommends the use of a five-star health rating system(23).
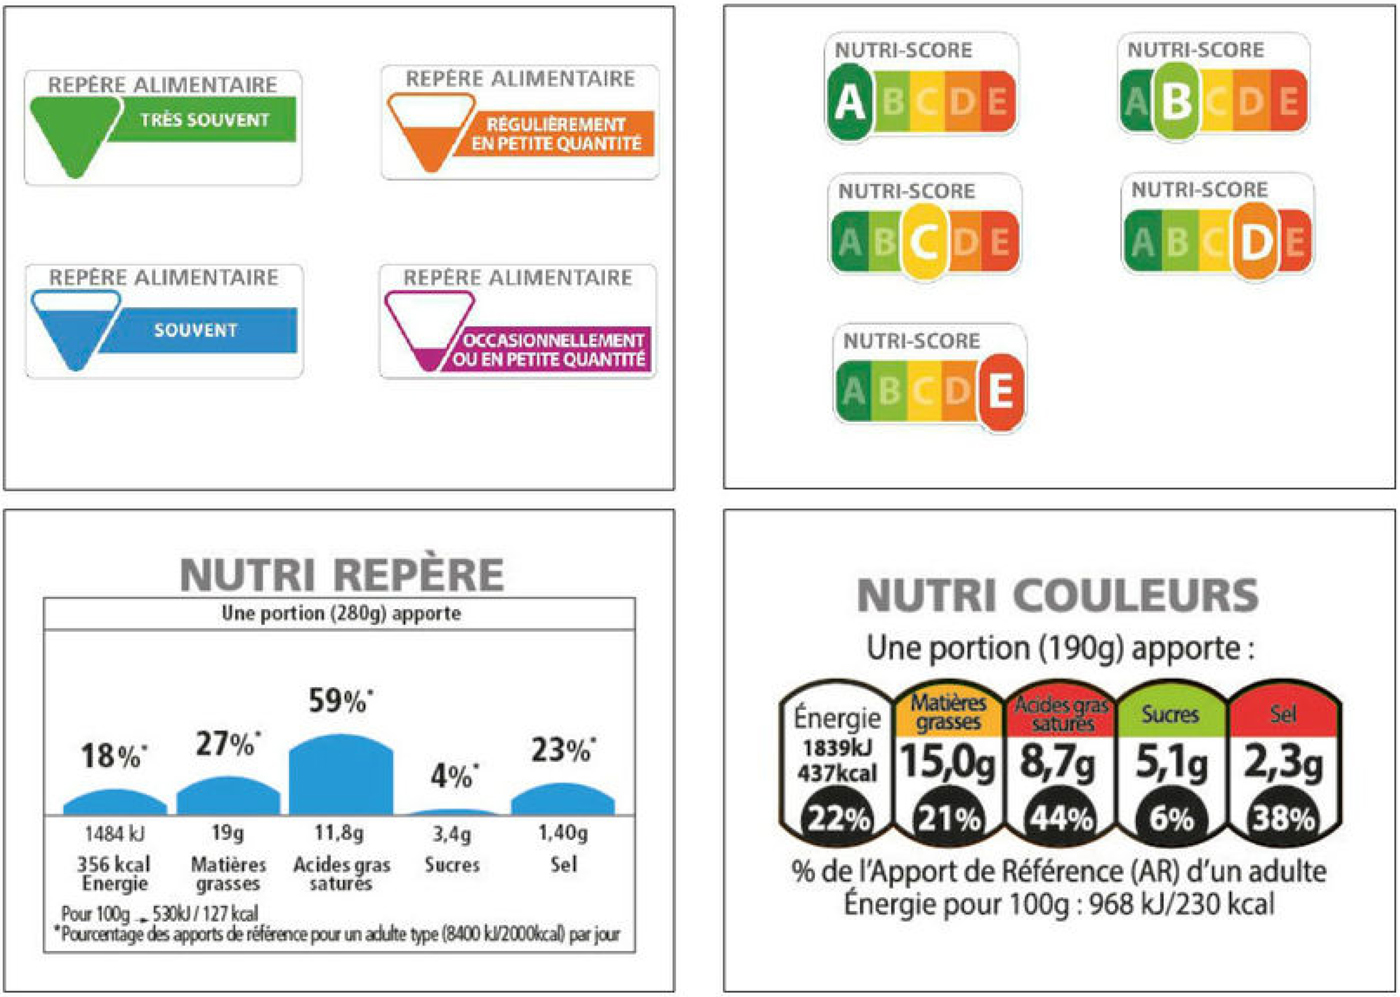
Fig. 2. The four front-of-pack labelling schemes compared in a real life study in France in 2016 (information courtesy of Dr France Bellisle).
Eating away from home
Some studies have considered the impact of nutritional labelling on dietary intake in out-of-home eating settings(Reference Hoefkens, Lachat and Kolsteren24–Reference Clegg, Jordan and Slade27). A study in the UK(Reference Clegg, Jordan and Slade27) showed that the prominence of energy (calorie) information posted in catering outlets was important, i.e. presented so that the information stood out from other information, with consideration given to label size, use of distinct colours and possibly consistency of label format and location. These findings are consistent with those from the EU FLABEL project (EU contract no. 211 905)(Reference Bialkova and van Trijp28). Meals eaten at restaurants typically contribute more energy and fat than those eaten at home and Littlewood et al. (Reference Littlewood, Lourenco and Iversen29) report that menu labelling is effective in decreasing energy intake, in terms of both the amount ordered and the amount consumed. They also found that inclusion of traffic lights and other interpretative information improved the effectiveness of menu labelling.
Thomas(Reference Thomas30) discusses obstacles to menu labelling in restaurants and cafes, and the need for practical support to encourage greater provision of information. Barriers include lack of nutritional expertise, limited availability of nutrition information for exotic ingredients, ability to provide accurate information for dishes cooked in a restaurant setting where standardised recipes may not be used, limited space on the menu, loss of flexibility in changing menus and resistance to change. Also reported are perceived burden and lack of benefit and perceived adverse impact on revenue. However, despite these issues, the out-of-home sector is responding to government challenges on the reformulation of foods and portion size; it has a crucial role to play in facilitating healthy choices in the context of current obesity trends.
Nutrition and health claims on pack
Claims and symbols are another way to attract shoppers’ attention. Van Herpen and van Trijp(Reference van Herpen and van Trijp31) found that health logos, such as the Swedish keyhole symbol(20), can enhance healthy product choice. However, in a supermarket environment, compared with an experimental situation in a laboratory, this type of directive labelling will only ever be present on a relatively small number of foods(Reference Hodgkins, Barnett and Wasowicz-Kirylo32). The EU-funded FLABEL project tested a hypothetical label that combined a FoP label and a health logo, using eye tracking (what shoppers look at and for how long), in a real-life setting(Reference Grunert, Fernadez Celemin and Storcksdieck genannt Bonsmann33). They found that overall attention to the label was only slightly increased but the healthiness of choices made by shoppers with a lower degree of self-control was improved.
Nutrition and health claims reflect positive attributes of a food, such as high in fibre, a source of vitamin C and research has investigated whether the presence of such claims distorts shoppers’ evaluation of a food's healthiness? It has been proposed that cognitive bias may lead people to believe that the presence of a claim on a food means it is healthier than a similar product without a claim (positivity bias)(Reference Talati, Pettigrew and Neal34). Talati et al. (Reference Talati, Pettigrew and Neal34) concluded from their systematic review that nutrition facts panels can decrease bias (if used/interpreted correctly) but FoP labelling shows greater promise in countering cognitive biases created by health claims.
The aim of the EU funded Clymbol project was to determine how health-related information, provided through claims and symbols, set in their usual context, affects consumer understanding, purchases and consumption, using product sampling, eye-tracking, laboratory and instore experiments, structured interviews and analysis of population panel data. A full description of the six work packages within the Clymbol project has been published(Reference Hieke, Kuljanic and Wills35). A product sampling survey was undertaken in five European countries, comprising over 2000 randomly selected foods, 26 % of which carried at least one claim(Reference Hieke, Kuljanic and Pravst36). Of these, 64 % were found to be nutrition claims, 26 % health claims, 6 % were health-related ingredient claims and 6 % were symbols. The prevalence of claims varied by country and by food category. Using the composition of the foods, those carrying claims were judged to have marginally better nutritional profiles than those without claims(Reference Kaur, Scarborough and Heike37), concurring with similar studies in the UK(Reference Kaur, Scarborough and Matthews38) and Australia(Reference Hughes, Wellard and Lin39). The public health implications of these modest differences are unclear.
An output from the project is a methodology to explore whether individual claims are understood by the ‘average’ consumer, how an understanding of claims and symbols can be improved and whether claims and symbols trigger healthier choices (www.clymbol.eu ). A technique now widely used in such research is eye tracking which enables information to be collected in real life situations, e.g. in a supermarket aisle, rather than in a laboratory situation. This has revealed the tiny window of milliseconds in which any packaging information, a claim or nutrition label, has the potential to attract the shopper's attention in the context of all the other factors that drive choice and purchasing habits, including price, taste and texture, familiarity and family preferences, convenience and pack size.
What can be done to improve usage of labelling information to inform healthier choices?
The challenge is not just about providing information because purchases are often habitual, and decisions are relatively fast and made in the context of a number of competing priorities. The evidence suggests that about 25 % of UK shoppers use nutrition labels(Reference Grunert, Wills and Fenandez-Celemin13) and the information is used more by women, parents, higher educated and higher income groups. Most subjects in studies can use labels to rank products and are familiar with traffic light labelling. The energy (calorie) content is often used as a shortcut to judge healthiness and some shoppers report looking out for particular nutrients they wish to avoid for their own health or that of their children. Other cues are considered to be claims such as ‘1 of your 5 a day’, ‘low fat’ and health claims. Usage varies with the category, being most frequently used for yoghurts, cereals and ready meals. However, a nutritional profile in relation to health is only one of several choice criteria. Studies to date have found that influence of nutrition labelling on food purchasing decisions is weak, especially when compared with taste, price, use by date, brand, convenience and family preferences(Reference Grunert and Wills6, Reference Grunert, Fenandez-Celemin and Wills15). As long as shoppers perceive trade-offs between taste, in particular, and health, interest in eating healthily will be limited. This emphasises the role of product reformulation and product development to provide healthier choices that still taste good.
Consumer attention and motivation remain major barriers, ultimately limiting the impact of nutrition labelling information on health. Eye tracking research reveals that the length of time spent by shoppers looking at labels is 25–100 ms regardless of the system used. Hence, the immediate challenge is to draw attention to the label as a source of useful information about nutrient composition. Some retailers have used product range descriptors and symbols to draw attention to products that meet a set of healthy eating criteria.
Time pressures are considered to be a barrier but, arguably, some online shoppers may have more time to compare products, suggesting that supermarket shopping websites have the potential to inform decisions from a nutritional perspective.
Online shopping
Provision of standardised nutrition information on food packaging is now a legal requirement and therefore a high degree of consistency now exists on the physical packaging. The regulation also applies to distance selling, i.e. online services, yet a study published in 2015 found much less consistency(Reference Stones40). Several studies have found that positioning of nutrition labels on a mock online shopping webpage is important in terms of fixation time(Reference Bialkova and van Trijp28, Reference Graham and Jeffery41). Positioning information above ‘the fold’ (i.e. visible without the need for scrolling) was found to be important. At the time of her study, Stones(Reference Stones40) found that nutritional information was not typically displayed on the search results page, meaning that products could not be compared at ‘point of purchase’ despite the finding of Higginson et al. (Reference Higginson, Kirk and Rayner42) that this is the most common task performed with nutrition labels in other settings. However, in all cases, nutrition labels were present on the product description page once the product had been clicked from the results page. Above the fold information was most likely to be summary information (e.g. multiple traffic lights) rather than the more detailed nutrition table. Information expressed as %RI appeared more frequently on the supermarkets’ own brands than on branded products available online but, for some of the supermarkets, typically this information was available less frequently online than on physical products. Over the intervening period, the information provided has become more comprehensive. Stones(Reference Stones40) suggests some novel ways in which online shopping could be used to choice edit or filter products. One example given is filtering sausage products by fat content to prompt lower fat choices, another example concerns an opportunity at the online checkout to view a basket ‘health check’ (see Fig. 3). Other opportunities include providing more information on healthy eating on shopping websites and associated apps (computer programs designed to run on a mobile device such as a smartphone or tablet computer), providing online filters to encourage healthier choices, and providing healthy eating advice during the online shopping experience.
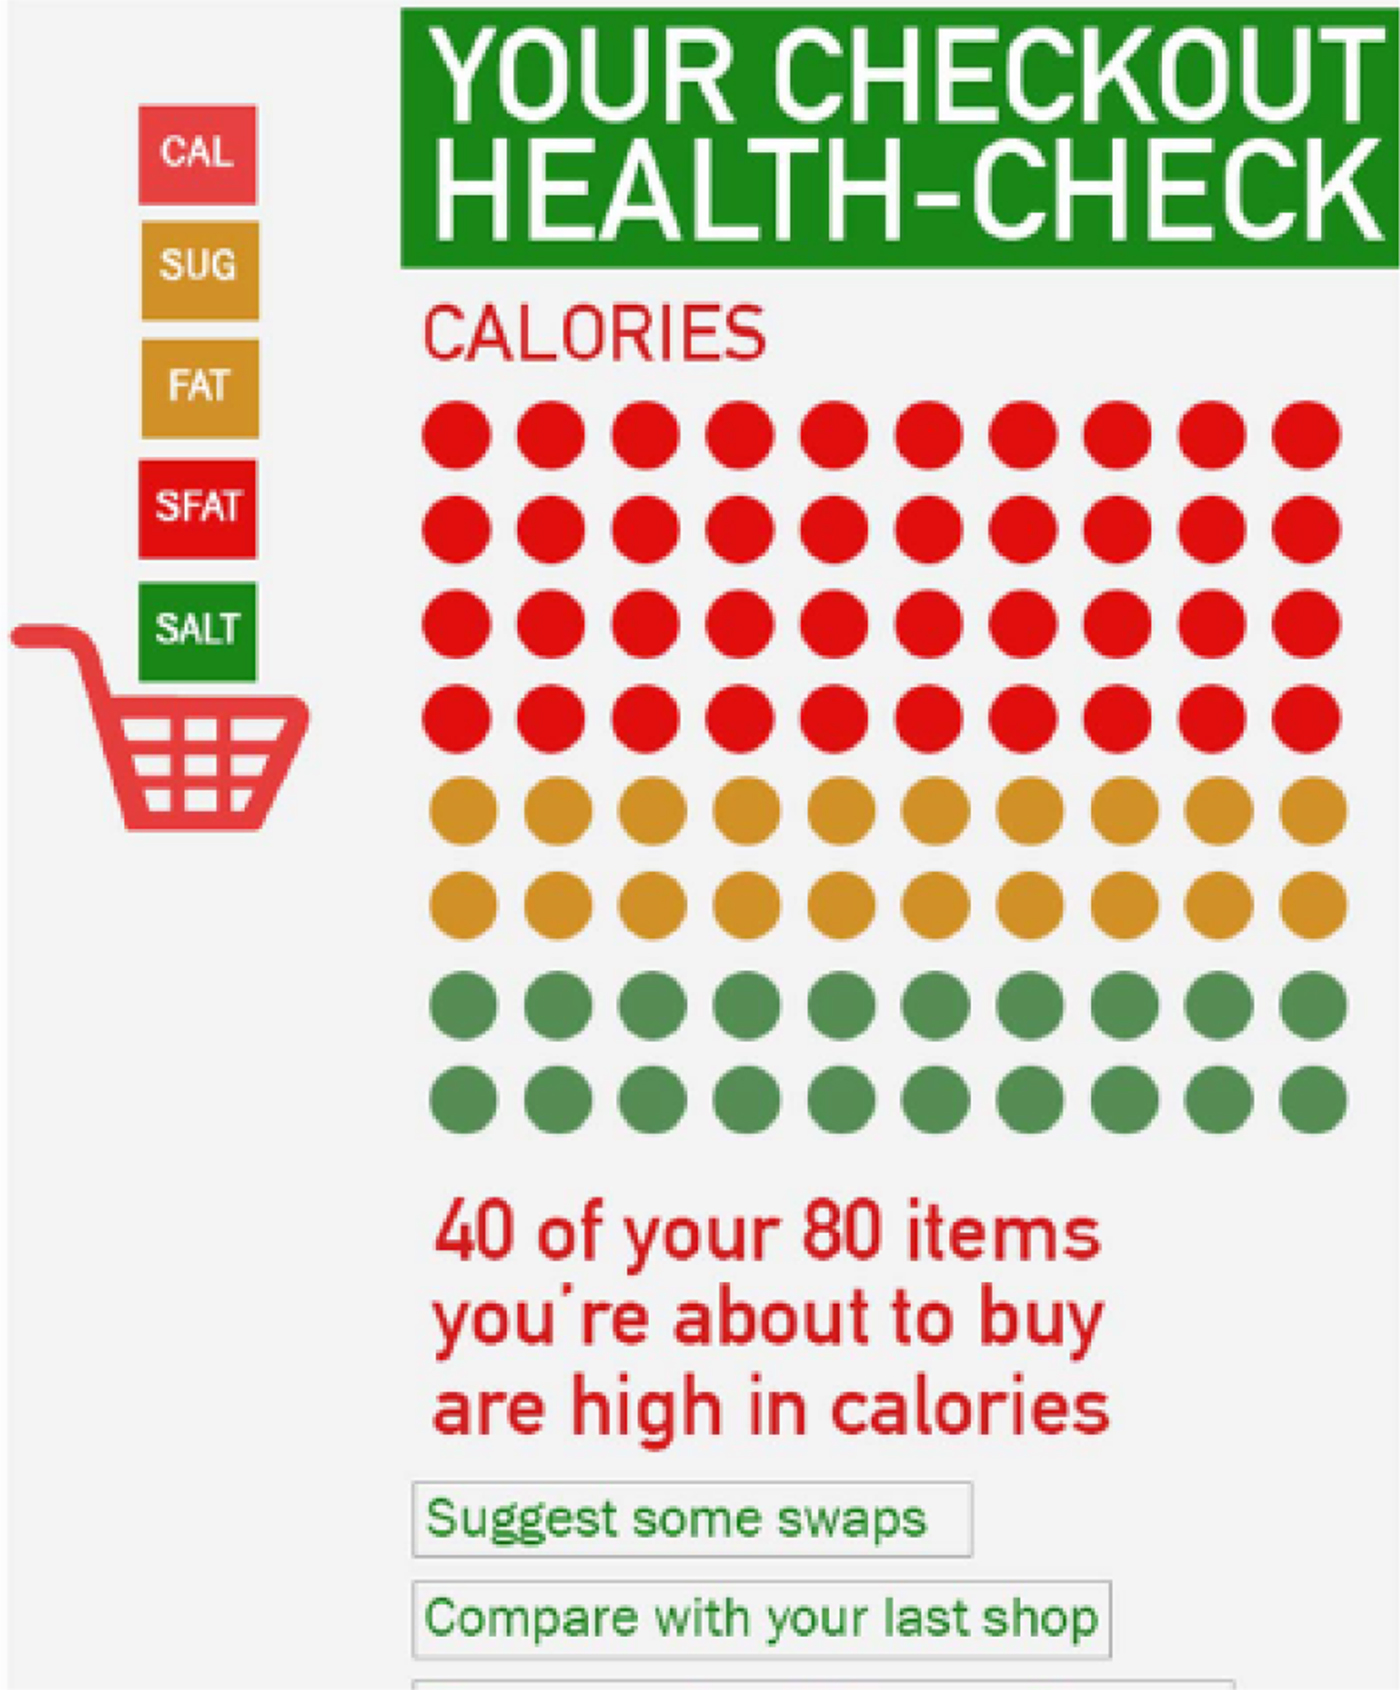
Fig. 3. A proposal for an optional pop-up health-check at the checkout(Reference Stones40).
Areas of confusion
Research conducted by the Institute of Grocery Distribution(43, 44) has been considering ways to encourage greater use of labelling information in order to support healthier choices. This research has explored the barriers and levels of understanding and identified common areas of confusion and cues other than nutrient information that people use to make healthier choices. The work has employed a number of approaches, including desk research, focus groups, observational studies, eye-tracking and intercept interviews. The research has identified a considerable amount of confusion around the term energy, about portion size information and the term RI commonly used, in line with legislation, alongside nutrient information on food packaging.
With regard to energy, there is evidence of a disconnect between the language we use as nutritionists (energy) and shoppers’ understanding of this term, which is epitomised by the following quote from the Institute of Grocery Distribution's focus group research(43): ‘It is a bit misleading on the one hand they are talking about calories, which you need to keep down and then they are talking about energy which is good. I am not going to get energy from a pudding. That is misleading.’ With regard to RI, a number of issues were identified by study participants: the %RI values are difficult to manipulate and then use over the course of a day; the information about RI is not available on all products, for example vegetables or fruit, suggesting these foods may ‘not count’; it is difficult to accommodate accompaniments over the course of a day (how much of the RI should be allowed for other parts of a meal?). Others questioned why the label uses just one RI when there is a big difference between the energy requirements of men, women and children. Based on the research, the Institute of Grocery Distribution has published a framework of messages that can be used to help explain the main areas of confusion(45). These messages cover RI, energy, interpretation of traffic light colours and use of the portion size information provided on labels. The messages have been tested with shoppers(44) and are intended for use by food businesses and organisations providing guidance on interpreting the nutrition information on labels.
Conclusions
Food labelling legislation exists to inform the public about the ingredient and nutrient composition of foods and to protect the public from misleading claims or claims not supported by sound scientific evidence. A wealth of information is now provided on food packaging, which is broadly understood by those who use it but is not as widely utilised as it might be to inform choice. Although guidance exists from governments and other organisations, more could be done to tackle the barriers to usage and clarify areas around which there is confusion.
Financial Support
None.
Conflicts of Interest
None.
Authorship
The author had sole responsibility for all aspects of preparation of this paper.


