Food consumption data at a country level
Food balance sheets
At a country level, dietary consumption is surrogated using indirect approaches that embed household food purchases, or even food balance sheets (FBS) from which per capita food data availability can be estimated. In FBS, food availability for human consumption is calculated by taking into account production, imports, exports, stock variation and utilisation elements, such as feed, seed, losses and industrial uses( 1 ). FBS are one of the most important sources of data on food availability for human consumption in most countries. However, it remains a challenge to collect accurate data about all the food groups, and the quality of the food data cannot always satisfy high-quality standards. As a result, FBS figures of food consumption are prone to measurement errors( Reference Del Gobbo, Khatibzadeh and Imamura 2 ). Furthermore, FBS neither give any indication of the differences that may exist in the diet consumed by different population groups, such as people of different socio-economic groups, ecological zones or geographical areas within a country( Reference Claro, Jaime and Lock 3 ), nor do they provide information on seasonal variations in the total food supply.
Household expenditure surveys and individual food consumption surveys
Data obtained through household and individual food consumption surveys (IFCS) are often the preferred source of food consumption estimates because they provide more information on food actually consumed than FBS do( Reference Serra-Majem, MacLean and Ribas 4 ). However, it should be emphasised that the food data collected in household consumption and expenditure surveys reflect the quantity of food acquired by a household rather than that consumed by its members. Data on the latter are collected in IFCS, also called dietary intake surveys or diet monitoring surveys. Compared with the household consumption and expenditure survey method, the IFCS method yields a more reliable measure of dietary adequacy and exposure to contaminants at individual and household levels because it is based on actual food consumption rather than food acquisition( Reference Engle-Stone and Brown 5 ). Further, since the data are collected at the individual level, comparisons can be made across age and sex groups, and inequalities in intra-household food distribution can be identified. However, collection and processing costs for these individual data are considerably higher than for the data collected in household consumption and expenditure surveys. For this reason, implementation of the IFCS method at the country level may be challenging for low- and middle-income countries( Reference Pisa, Landais and Margetts 6 ), therefore limiting the use of this approach for cross-country comparisons.
Although dietary monitoring and surveillance is crucial in the development of targeted interventions among population groups at risk of nutritional inadequacies, several countries (particularly those in deprived regions such as Africa) have no representative national IFCS system in place yet( Reference Pisa, Landais and Margetts 6 ). Furthermore, in most countries where food consumption surveys are conducted, the data are not collected routinely, which undermines trend analyses( Reference Micha, Khatibzadeh and Shi 7 , Reference De Keyzer, Bracke and McNaughton 8 ). Despite the challenges involved, IFCS are performed in several countries and serve as the basis to evaluate compliance with nutrient intake requirements or exposure to potentially harmful dietary contaminants/components. Opportunities and barriers identified in past and ongoing IFCS can serve as a basis to develop and optimise future surveys in regions where IFCS are still lacking. Furthermore, harmonisation of the methodologies of data collection in national surveys, as well as of recruitment, training and supervision of interviewers will increase the comparability of the data collected. A cross-continental comparison of national food consumption survey methods has already been published, including studies reporting on IFCS from 1985 to December 2011( Reference De Keyzer, Bracke and McNaughton 8 ). This previous review described how few countries endeavoured to increase the potential of their national IFCS through implementation in other national health surveys (e.g. health interview surveys or health examination surveys), an approach likely to be cost-effective, especially in resource-constrained environments often reported in low- and middle-income countries( Reference De Keyzer, Bracke and McNaughton 8 ).
In this review, we compare national IFCS and their potential for health research through integration in national health surveillance programmes worldwide. More specifically, we inventoried methods and designs used in national IFCS. We further discuss and compare these methodological properties between nations and cross-continentally and evaluate the potential for embedding food consumption survey in national health surveillance programmes.
Procedure for selecting the studies to be included in this review
This review builds on existing reviews that focused on one or a limited number of continents in order to create an exhaustive inventory of all published IFCS conducted all over the globe( Reference Pisa, Landais and Margetts 6 , Reference De Keyzer, Bracke and McNaughton 8 – Reference Merten, Ferrari and Bakker 10 ). This extended systematic literature search followed a similar methodology as the one applied by De Keyzer et al. ( Reference De Keyzer, Bracke and McNaughton 8 ), although extended with additional searches using search engines such as Google and Google Scholar, ScienceDirect and including also relevant non-English search terms, namely French and Spanish. The Inventory Framework constructed by De Keyzer et al. ( Reference De Keyzer, Bracke and McNaughton 8 ) was used as a basis for describing the methodological properties of the IFCS included in this global review. After debate and brainstorming between the authors, it was decided to categorise the IFCS properties into eight aspects: (1) general survey information; (2) target population, survey design and sampling; (3) dietary intake and other assessments; (4) recruitment of participants; (5) fieldwork characteristics; (6) data/nutrient analyses; (7) recruitment and training of the interviewers; (8) characteristics of national IFCS integrated into broader health surveys. The framework was designed as a table listing IFCS in rows and property fields in columns. In total, forty-six fields were created. The fields to be completed per survey are presented in Annex 1.
As proposed by Blanquer et al. ( Reference Blanquer, Garcia-Alvarez and Ribas-Barba 11 ), a combined strategy for data acquisition was used. Firstly, a systematic literature search was performed. The electronic databases Medline (PubMed), Web of Science, ScienceDirect and Scopus libraries were used to identify studies reporting on IFCS from 2011 to December 2016. Text terms with appropriate truncations, Boolean operators and relevant indexing terms were used. A set of Medical Subject Headings was used in PubMed and Web of Science. The reference lists in the articles, reviews and textbooks retrieved were also investigated for additional publications yielding a substantial amount of grey literature such as reports available on websites of governmental institutions. The key words used in the search (in English, French and Spanish) were: ‘national nutrition survey’; ‘food and nutrition survey’; ‘dietary consumption survey’; ‘dietary intake’; ‘nutrition examination’; ‘nutrition survey’ and ‘dietary intake assessment’. Co-authors from the FAO provided additional information on the surveys available in their databases (FAO/WHO Global Individual Food consumption data Tool (http://www.fao.org/nutrition/assessment/food-consumption-database/en/)). These surveys include datasets that have been identified through the Global Dietary Database initiative (http://www.globaldietarydatabase.org/the-global-dietary-database-measuring-diet-worldwide.html). Additional terms referring to a country or continent were added to this search query to obtain region-specific information. The selection of continents was based on the seven-continent model excluding Antarctica (no permanent habitation).
Only studies including a national representative sample (or proxy representative) of the population were included in this review. The exclusion criteria used were: (1) age (nutrition surveys in subjects under 18 years only were excluded given their age-specific approach in terms of dietary intake assessment (DIA); representative surveys including adults and children were included in the inventory tables with the full age range); (2) indirect or ecological measurement of food intake (e.g. FBS or household budget surveys); (3) absence of DIA (e.g. nutritional assessment based on anthropometric or clinical measurements); (4) publications or reports not available in English, French or Spanish and/or not accessible online. It is noteworthy that no exclusions were made based upon the DIA method used as long as it concerned direct intake assessment methods at an individual level (e.g. 24-h dietary recall (24-HDR), food diary, FFQ).
The first step of the search strategy yielded a total of 9687 articles. From these, 8138 articles met at least one of the exclusion criteria during the selection based upon titles. The abstracts of the remaining 1549 articles were reviewed and compared with the inclusion/exclusion criteria, yielding 145 potentially relevant articles. From these articles, a total of 113 articles were selected as relevant according to our inclusion/exclusion criteria after having reviewed the full articles. Single surveys from individual countries were identified based upon these 113 selected articles, leading to a total of thirty-nine countries from six continents that were retained for inclusion in our extraction tables (Fig. 1).
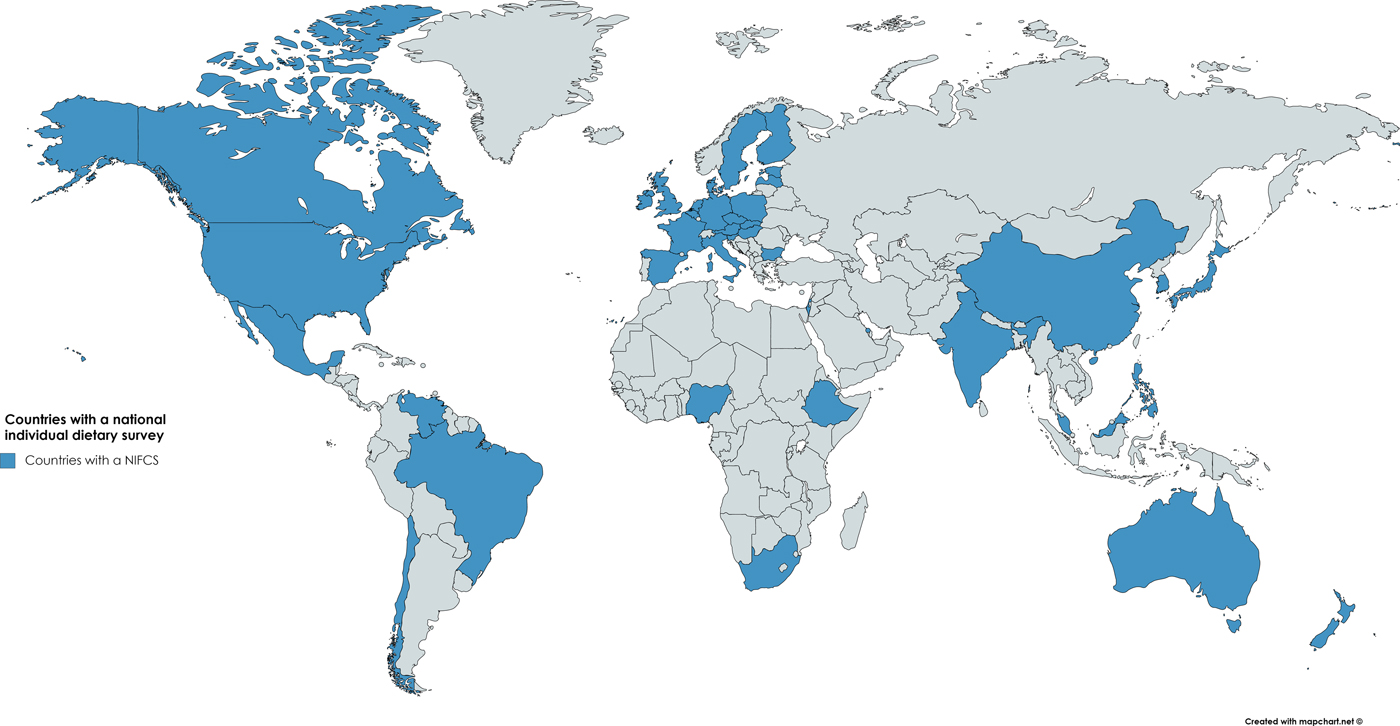
Fig. 1. Mapping of the countries in which at least one national individual food consumption survey has been conducted before 2017 (highlighted in blue). Africa: Nigeria, South Africa, Ethiopia; North and South America: Brazil, Canada, Chili, Mexico, the USA, Venezuela; Asia: Bahrain, China, India, Israel, Japan, South Korea, Malaysia and Philippines; Europe: Austria, Belgium, Bulgaria, Czech Republic, Denmark, Estonia, Finland, France, Germany, Hungary, Ireland, Italy, Latvia, The Netherlands, Poland, Slovakia, Slovenia, Spain, Sweden, the UK; Oceania/Australasia: Australia and New Zealand.
The results of these thirty-nine IFCS are presented according to the eight major aspects listed in the Methods section, clustered by continent (Tables 1–3 and Supplementary Tables S1–S4). It should be noted that for countries in which repeated IFCS have been conducted, only the methods of the last IFCS (with reserve of full report available online) have been included in the tables. IFCS that are still ongoing and for which no online reports or publications are available yet have not been included in the tables.
Table 1. Countries included in the study and general study information (individual food consumption surveys that are still ongoing and for which no online reports or publications are available yet have not been included in the tables)
F, female; M, male; NS, not specified; NA, not applicable; NR, not reported.
* Repeatability of the surveys was categorised according to the following three definitions:
-
(1) Erratic, characterised by lack of consistency, regularity or uniformity (e.g. when the survey has only been conducted once);
-
(2) Regular, recurring/repeated at fixed, uniform or normal intervals, arranged in or constituting a definite pattern (e.g. with regular funding every × years);
-
(3) Continuous, uninterrupted in time; without cessation (e.g. continuous funding available for uninterrupted running of the survey).
Table 2. Dietary intake data collection and other dietary assessments of national nutrition surveys per continent
NS, not specified; NA, not applicable; NR, not reported; 24-HDR, 24-h dietary recall; Dietary record, synonym to Food record; CAPI, computer-assisted personal interviewing; CAI, computer-assisted interviewing; AMPM, Automated Multiple-Pass Method; CSPro, Census and Survey Processing System; BINAT, Israeli Nutrient Database.
* If non specified, possibly 1 assumed.
Table 3. National surveys embedded into broader health surveys
BP, blood pressure.
Overview of the different study designs and methods used in the national food consumption studies
General survey characteristics
National IFCS systems are available in most of the high-income countries, while such surveys are scarce in low- and middle-income countries (such as Africa, Eastern Europe and several Asian countries). The IFCS were cross-sectional, with only few having a continuing character (Table 1). Nineteen surveys were identified as being conducted erratically (Ethiopia( 12 ), Nigeria( Reference Maziya-Dixon, Akinyele and Oguntona 13 ), South Africa( Reference Shisana, Rehle and Simbayi 14 ), Bahrain( Reference Wahab, Gharib and Al Sairafi 15 ), Belgium( Reference Bel, Van den Abeele and Lebacq 16 ), Bulgaria( Reference Petrova and Angelova 17 ), Czech Republic( Reference Ruprich, Dofkova and Rehurkova 18 ), Estonia( Reference Pudule, Grinberga and Kadziauskiene 19 , Reference Pomerleau, McKee and Robertson 20 ), Finland( Reference Reinivuo, Hirvonen and Ovaskainen 21 ), France( Reference Dubuisson, Lioret and Touvier 22 ), Hungary( Reference Szeitz-Szabó, Bíró and Bíró 23 ), Ireland( Reference Harrington, Robson and Kiely 24 ), Latvia( Reference Merten, Ferrari and Bakker 10 ), Poland( Reference Sekula, Nelson and Figurska 25 ), Slovakia( Reference Merten, Ferrari and Bakker 10 ), Slovenia( Reference Merten, Ferrari and Bakker 10 ), Brazil( Reference Sichieri, Pereira and Martins 26 ), Chili( Reference Hugo, Patricia and Marcelo 27 ), New Zealand( 28 )); fifteen on a regular basis (at a fixed frequency; e.g. annually, biennial; India( 29 ), Israel( Reference Keinan-Boker, Noyman and Chinich 30 , 31 ), Japan( 32 ), South Korea( Reference Kim 33 ), Malaysia( 34 ), Philippines( 35 ), Austria( Reference Elmadfa, Freisling and Nowak 36 ), Denmark( Reference Pedersen, Christensen and Matthiessen 37 ), Germany( Reference Heuer, Krems and Moon 38 ), Italy( Reference Leclercq, Arcella and Piccinelli 39 , Reference Sette, Le Donne and Piccinelli 40 ), The Netherlands( Reference Rossum, Fransen and Verkaik-Kloosterman 41 ), Spain( Reference Ortega, Lopez-Sobaler and Ballesteros 42 ), Sweden( Reference Becker and Pearson 43 ), Canada( 44 ), Mexico( Reference Barquera, Hernandez-Barrera and Campos-Nonato 45 )), while five were continuous (ceaselessly from one year to another) surveys over years (China( Reference Zhang, Zhai and Du 46 , 47 ), the UK( Reference Bates, Lennox and Prentice 48 ), the USA( 49 ), Australia( 50 ), Venezuela( 51 )). Japan was one of the first countries to start collecting IFCS routinely with data collected throughout years since 1946. Other countries conducted IFCS regularly: India, Israel, Japan, South Korea, Malaysia, Philippines, Austria, Denmark, Germany, Italy, The Netherlands, Spain, Sweden, Canada and Mexico. For the USA and China, participants are included in a cohort for tracking over time. Countries which have integrated IFCS in their health survey are: South Africa, Australia, China, Japan, South Korea, Malaysia, Canada, Mexico and the USA. All of the IFCS integrated in health surveys, besides South Africa, have the advantage of being continuous (Australia, the USA and China) or regular (Canada, Japan, South Korea, Malaysia and Mexico), while most of the other IFCS are rather erratic.
Target population, survey design and sampling method
Supplementary Table S1 summarises the study design aspects and methods of the selected surveys. The age of the target populations ranged from <1 year to over 80 years (in surveys that do not include an age <18 years limit). In all surveys, both sexes were included except for the Nigerian IFCS that included solely women. Different sampling designs were used to select study participants with a majority applying a multistage and stratified sampling. The sampling frames used for the selection of sampling units were based either on census data (e.g. the USA, Mexico, Brazil, South Korea and New Zealand), a combination of frames like healthcare registries and labour force data (Canada), strata from counties (China) or other sampling frames, such as enumeration blocks, which are geographical areas artificially created to have several living quarters (Malaysia).
Numbers of participants and participation rates
In Table 1 and in Supplementary Table S1, recruitment aspects of all selected surveys are listed. Sample sizes of single surveys ranged from about 400 (Spain and Slovenia) to over 30 000 (Canada and Brazil). Participation rates were above 90 % in Malaysia, Ethiopia and South Africa; between 80·0 and 89·9 % in the USA (National Health and Nutrition Examination Survey (NHANES) 2001, 2005), Mexico (National Health and Nutrition Survey 1999), Brazil, China and South Korea; between 70·0 and 79·9 % in Canada, the USA (NHANES 2003, 2007 and 2009) and Australia (for the FFQ); and below 70 % in Japan, Australia (for 24-HDR) and New Zealand. Overall, participation rates were lowest in European countries (between 23 and 80 %, except for Poland and Slovakia where response rates were 96 %). The integrated surveys often seem to have higher response rates, a random sampling design and are therefore often more representative for the general population. Although the higher response rates in these integrated surveys may be due to other factors that are out of the scope of this inventory, these numbers are demonstrating the feasibility of integrating an IFCS in other health surveys as the extra respondent burden seems not to reduce the response rate.
Dietary intake assessment methods
Most surveys used 24-HDR as the principal DIA method (Table 3). Multiple recalls for all participants were available in China (three recalls) and in most of the European countries. In some countries, duplicate recalls were available in a subsample only (Canada, South Korea, Australia and New Zealand). Computer-assisted personal interviewing was performed in the USA, Malaysia, Brazil and New Zealand. In the surveys from China and Australia, the 24-HDR was performed with paper and pencil in a face-to-face interview. In South Korea, a face-to-face interview was performed, no interview software was reported, and in Mexico, the method of administration of the 24-HDR was also not reported in the study report. A prospective DIA method was only used in Brazil and Japan (2-d estimated dietary records and 1- or 3-d semi-weighed dietary records, respectively). Finally, Mexico (Mexican Health and Nutrition Survey 2006) and South Africa used only a semi-quantitative FFQ to report on frequencies of intake during the past 7 d. An FFQ (formerly called food propensity questionnaire) was also used in addition to a principal DIA method to identify frequencies of consumption and non-consumers of various food groups in Canada, the USA, Japan, South Korea, Malaysia, Australia and New Zealand (National Nutrition Survey 1997) and several European countries. For particular population groups such as children, the 24-HDR interview is often complemented with a food diary, or food diaries can also be used as stand-alone method. This is the case in most European countries and allows food consumption that occurred when the children were in the presence of care givers who differ from the adult being interviewed (e.g. care givers of kindergarten) to be captured( Reference Freisling, Ocke and Casagrande 52 , Reference Ocke, Brants and Dofkova 53 ).
Additional assessments and measurements
Almost all IFCS collected additional information in addition to the dietary intake data. The most common extra parameters included in the IFCS were anthropometrics (measured or estimated), physical activity questions/measurements and socio-demographical information (Supplementary Table 3). Anthropometrical data were always collected through measurements performed by trained researchers in the IFCS integrated in health surveys, while in other dietary surveys, these were often estimated (respondent recall/report).
Fieldwork characteristics and data controls
In Table 2 and Supplementary Table S1, the fieldwork aspects of the nutrition surveys are presented. Interviews were conducted either face-to-face or by telephone. Places other than the homes of the participants for administrating the DIA were examination centres (e.g. South Korea and several European countries and mobile examination centres in the USA). The time-span of the fieldwork was at least 1 year (all seasons) in almost all European countries, Canada, the USA, Brazil, South Korea (Korean NHANES 2008 and onwards), Malaysia, Australia and New Zealand. In the African countries running an IFCS, only few seasons/months were included in the fieldwork period.
Food linking and statistical analysis
Supplementary Table S4 summarises features related to data analyses of the dietary intake data. Surveys using multiple measures of intake allow for correcting of within-person variability. Most surveys used the Nusser method( Reference Nusser, Carriquiry and Jensen 54 ) (using Software for Intake Distribution Estimation SIDE or C-SIDE) developed at the Iowa State University to calculate distributions of usual intake (Canada, the USA NHANES 2003, Brazil, South Korea and New Zealand and few European countries). For the USA, from NHANES 2005 and onwards, the NCI method developed by the National Cancer Institute was used (https://epi.grants.cancer.gov/diet/usualintakes/method.html). Finally, in the Australian survey, an equation developed by the US National Academy of Science was used to adjust for within-person variance( Reference Mackerras and Rutishauser 55 ). Misreporting of energy intake was assessed using either the Goldberg method( Reference Goldberg, Black and Jebb 56 ) (the USA, Malaysia, Australia and most European countries) or the equations by Black and Cole( Reference Black and Cole 57 ) (Canada). Whether the Goldberg method was applied at the individual or group level was not always specified. Two surveys indicated that no calculation of misreporting was performed (South Korea and New Zealand), while several surveys did not report whether misreporting was analysed and if any misreporting adjustments were done.
Recruitment and training of field staff
In Supplementary Table S2, recruitment and training of the interviewers and field staff in the nutrition surveys are described. In twenty-three IFCS, the interviewers were nutritionists or dietitians. In some countries, interviews were performed by trained interviewers (sometimes in addition to the nutritionists) who are familiar with local food customs (New Zealand) or professional interviewers working on a variety of surveys (Canada). For interviewers in the USA, a high school diploma was considered to be the minimum education requirement, as this is necessary for government jobs. However, also dietitians/nutritionists were available to perform the IFCS in the USA. Training was provided on a variety of topics such as interviewing and probing skills (Canada, the USA, Brazil, China, South Korea, Malaysia, Australia and New Zealand), training on contacting participants and software training. The duration of these training sessions ranged from 3 d (China) to 3 weeks (India). The average duration of reported training programmes for interviewers was approximately 7 d.
Characteristics of individual food consumption survey integrated in National Health Surveillance Systems
In the past decades, several IFCS have been integrated in a broader health surveillance system with South Africa the most recent (since 2013). In total, nine countries have incorporated their national IFCS into continuous NHANES (see Fig. 2; Table 3): Canada, Mexico, the USA, China, Japan, South Korea, Malaysia, South Africa and Australia. South Africa included their IFCS in their South African NHANES, though the survey data only allow a rough estimate of the dietary intake among this population as a less detailed and closed FFQ has been used as primary DIA method. The dietary assessment methods used in these integrated surveys varied from the use of multiple 24-HDR (the USA) to less detailed semi-quantitative methods such as FFQ (in South Africa). Most of the integrated surveys are face-to-face and often carried out at home. It should be noted that even for IFCS surveys not part of a larger health interview or health examination survey questionnaires on health and physical activity were often included, as shown in the overview in Supplementary Table S3.

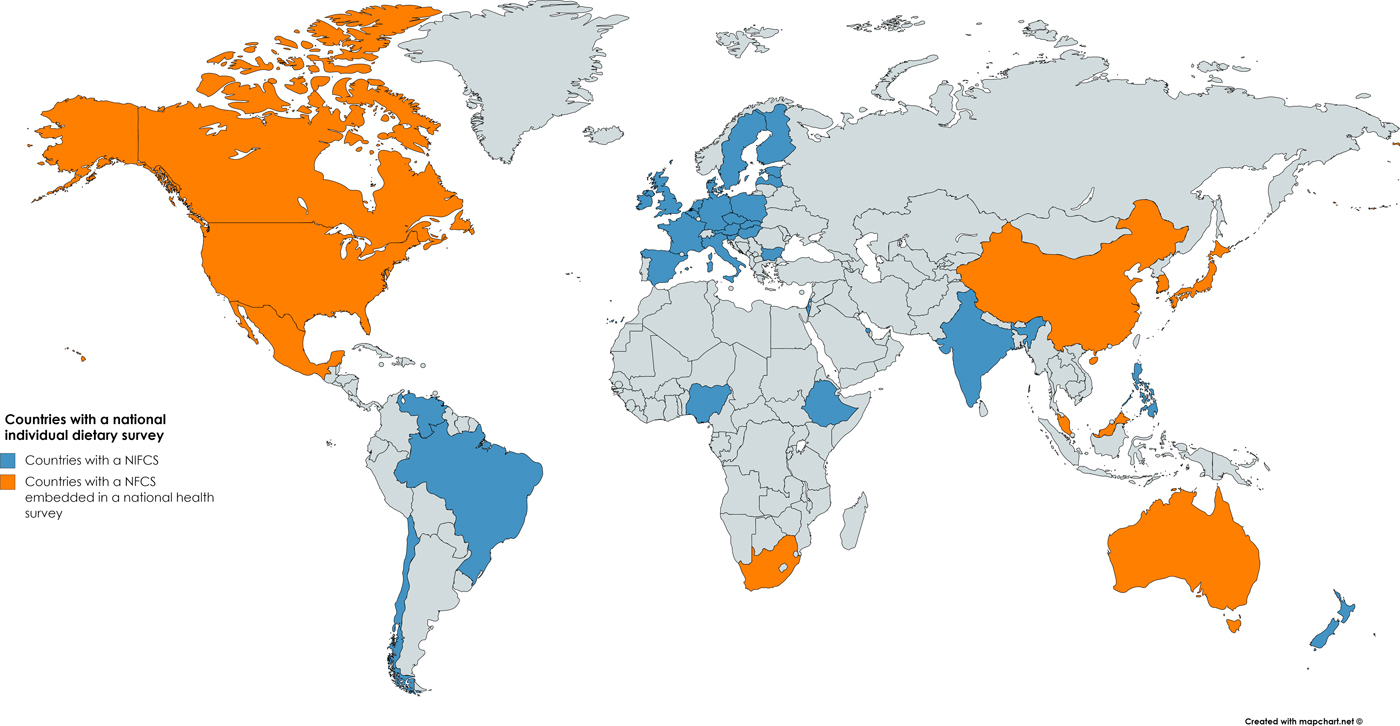
Fig. 2. Mapping of the countries in which at least one national individual food consumption survey has been conducted before 2017 (highlighted in blue/orange), indicating those that were integrated in a national health survey in orange (written in bold italic in the legend). Africa: Nigeria, South Africa, Ethiopia; North and South America: Brazil, Canada, Chili, Mexico, the USA, Venezuela; Asia: Bahrain, China, India, Israel, Japan, South Korea, Malaysia and Philippines; Europe: Austria, Belgium, Bulgaria, Czech Republic, Denmark, Estonia, Finland, France, Germany, Hungary, Ireland, Italy, Latvia, The Netherlands, Poland, Slovakia, Slovenia, Spain, Sweden, the UK; Oceania/Australasia: Australia and New Zealand.
Critical appraisal and recommendations
The present inventory is the first of its kind to present the wide range of methodological aspects associated with national IFCS across all continents. The present inventory comprises of IFCS performed in thirty-nine countries from six continents: Africa, Asia, Australasia, Europe, North-America and South-America. National IFCS systems are available in most of the high-income countries, while still scarce in low- and middle-income countries, such as several African and Asian countries. Computer-assisted interview software is frequently used in national nutrition surveys because it allows structured and standardised collection of dietary intake data. The present overview shows that several countries use the US Department of Agriculture-based computer-assisted interview software and food classification. The leading role of this department is not surprising given its long history that goes back to 1892( Reference Ahuja, Moshfegh and Holden 58 ).
While the use of DIA software from another country can be appropriate, the same is not true when it comes to using food composition data from another country. Many national or regional food composition tables or databases contain incomplete, outdated and unreliable data. For this reason, nutrient intakes are often assessed by borrowing data from US Department of Agriculture data or from neighbouring countries( 59 ).
Although dietitians or nutritionists were recruited for performing the interviews in most of the national IFCS (e.g. China, Japan, South Korea, Malaysia and Australia); in other countries, interviews were performed by trained interviewers, who were familiar with local food customs although not necessarily dietitians or nutritionists (e.g. New Zealand and several European countries), or professional interviewers working on a variety of surveys (Canada). For interviewers in the USA, a high school diploma was considered to be the minimum education requirement, as this is necessary for government jobs. All surveys rely either on professional interviewers involved in a variety of surveys or survey staff with a given minimal educational qualification, complemented with specific software and interview training. The reason why other specialisations different from dietitian/nutritionist (e.g. nurse) may be required in the IFCS integrated in health surveys for conducting interviews may be because these IFCS are part of the national health surveillance systems that include a large battery of health and lifestyle modules to be investigated in addition to the nutrition module (e.g. anthropometrical and blood pressure measurements requiring a nurse or clinician).
It is noteworthy that some national health surveys also include a nutrition module that most of the time includes an FFQ, though the dietary information obtained through these modules is rather limited and focuses on particular indicators, such as the WHO health indicators. A particular example is Singapore where every 6 years, a health interview survey is conducted that is integrated in the national IFCS. Although the 24-HDR method was used in the previous Singapore health interview surveys, presently they only use an FFQ as primary DIA method.
This inventory demonstrates the increasing integration of IFCS in national health surveillance systems and vice-versa, and this not only in high-income countries but also in continents including lower middle-income countries such as Africa, Asia and South America (Table 3). The level of detail and the extent of different health and lifestyle domains included in these surveys differs importantly from survey to survey with a trend towards more detailed questionnaires and DIA methods used in high-income countries compared with less detailed methods in surveys ran in low- or middle-income countries, although often covering a broad scope of health and lifestyle topics (collected with less detail).
The NHANES of the USA was one of the first surveys to embed an IFCS in a health examination survey. It demonstrated the added value of this integrated approach through its large publication record reporting on diet-related disease outcomes( Reference Henney, Taylor and Boon 60 ). In the 1960s, the NHANES began to assess the health status of individuals from the age 6 months through to 74 years, including measures of hypertension, elevated serum cholesterol and overweight. Individual food consumption was added as a survey component in the 1970s. The NHANES and related IFCS conducted by US Department of Agriculture were integrated in 2002, and at that time the dietary reports from the integrated survey became known as What We Eat in America. During the four decades in which individual food consumption has been tracked in nationally representative cross-sectional surveys of the population, there have been improvements in the data collection methods and protocols used to estimate individual food consumption. These improvements included for instance the collection of more than 1 d of consumption on at least a subsample of the population and questions about tap water consumption and water softening, dietary supplement use, etc. The quality of data has improved, but of course some bias and measurement errors still exist given that the estimates rely on self-reported data. The present NHANES survey relies on the gold standard for dietary measures, two or more 24-HDR per person and allows the assessment of usual dietary intakes, including food and nutrient intakes but also contaminants and bio-active components. The NHANES also collects information on race/ethnicity on the basis of self-reported categories as follows: non-Hispanic whites, non-Hispanic African Americans and Mexican Americans. Health examinations are performed in the NHANES Medical Examination Center( 61 ). It is noteworthy that despite the higher respondent burden implied by these integrated surveys (which often include several detailed health modules and physical examinations in addition to the dietary assessment module), the response rate is quite high in comparison with many other non-integrated IFCS. This could indicate that the response rate does not only depend on the respondent burden, demonstrating the feasibility of such integrated approaches in high-income countries. Some middle-income countries such as Mexico, Malaysia and South Africa also confirmed the feasibility of this integrated approach showing high response rates, although using less detailed or less ideal methods for DIA (only 1×24-HDR or FFQ). The feasibility and cost-efficiency of the integration of national IFCS in existing health surveys should be further investigated.
Given that quantitative IFCS are expensive and difficult to implement in low-income countries, questionnaire methods have been developed to assess the dietary diversity of the diet as a simple proxy to measure micronutrient adequacy in women's and children's diets at the individual level( Reference Hoddinott and Yisehac 62 – Reference Arimond, Ballard and Deitchler 65 ). Tufts University, in collaboration with FAO, are in the process of developing and pilot testing a new DIA software for use in low-income countries, considering the logistical and financial constraints that limit the feasibility of using the same DIA methods as those used in the high-income countries (INDDEX, http://inddex.nutrition.tufts.edu/). Considering the high prevalence of technology illiteracy in the low-income settings, this newly developed software will require administered interviews. FAO is also developing, together with WHO, a comprehensive international database of individual quantitative IFCS (http://www.fao.org/nutrition/assessment/food-consumption-database/en/). A prototype has been published. While this tool is being finalised, FBS represent the easiest and the most widespread source of standardised data that permit international comparisons over time.
This review presents an inventory of methodological aspects related to the performance of national IFCS in the different continents worldwide. Although substantial efforts have been made to undertake a comprehensive overview, it is inevitable that some surveys may not be captured. It is worth noting that, to avoid omission of any surveys in continents where surveys are not necessarily published in public literature or reports, the studies included in our inventory were compared with those identified in the frame of the FAO review afore-mentioned. Of the nine countries on which FAO had focused, only one nationwide survey had been identified that was not identified in our search. We consider that the two-step approach using both available literature and expert consultation was the best method available to create the comprehensive overview presented.
Conclusion
This review shows that IFCS have been implemented in most high-income countries, although routine IFCS are still lacking in several countries and are even completely absent in most of the low- and middle-income countries, particularly in African and Asian countries. The methods used for DIA in national nutrition surveys are relatively similar across continents with the 24-HDR method as the predominant assessment method worldwide. However, caution is still warranted when comparing results from IFCS between countries due to important differences in levels of detail or other methodological aspects, such as different food classification systems used and differences in conversion factors used for calculating nutrients.
This inventory will help to identify the gaps and needs and for prioritising resource allocations. In addition, it could serve as a basis to advocate for national IFCS to be incorporated into NHANES in order to create more research opportunities for investigating diet–disease relationships and a frame to plan and evaluate the effect of diet-related (e.g. fortification) policies and nutrition recommendations. The nine countries that integrated their IFCS within their NHANES can serve as proof-of-principle for other countries, considering their strengths and limitations. Such integration of national IFCS in national health surveillance systems would avoid fragmentation of resources and could as such be a cost-efficient opportunity for countries where IFCS are still lacking or executed only sporadically because of lacking resources.
Supplementary material
The supplementary material for this article can be found at https://doi.org/10.1017/S0029665117001161.
Acknowledgements
The authors would like to thank Rachel Wasson for her support in reviewing the tables and the figures and Artur Aghajanyan for his help in the search for additional individual food consumption surveys in low- and lower middle-income countries. This work was undertaken during the tenure of the postdoctoral fellowship of E. K. A., from the International Agency for Research on Cancer, partially supported by the European Commission FP7 Marie Curie Actions – People – Cofounding of Regional, National and International Programmes (COFUND). This work was undertaken during the tenure of an IARC-Ireland Postdoctoral Fellowship of A. M., from the International Agency for Research on Cancer, supported by the Irish Cancer Society.
Financial Support
None.
Conflicts of Interest
None.
Authorship
I. H., F. B. Z. and M. J. G. launched the idea to investigate cross-continental comparisons of national food consumption surveys with particular focus on the possibilities for integration in National Health Surveys. I. H. conducted the systematic review as main reviewer and drafted the manuscript. E. K. A. was responsible for the data extraction of the selected literature in the tables and assisted in the literature searches. A. M. has performed consistency checks in the tables and manuscript. C. L., P. A. and A. B. contributed to extra studies to be included in the tables thanks to an extra search conducted in the frame of a project focusing on additional individual food consumption surveys in low- and lower middle-income countries. All authors contributed to the writing of the manuscript and the interpretation of the results. All the authors have read and approved the final version of this paper.
Annex 1. Overview of the Inventory Framework, including eight aspect categories and fifty indicator fields (Tx indicates the table number in which the indicator is included with x = number)