


Introduction
Many parasites have complex life cycles, infecting several hosts before reaching sexual maturity. Infection success is dependent on several factors, including timing of transmission and environmental conditions (Wolinska and King, Reference Wolinska and King2009; Karvonen et al., Reference Karvonen, Kristjánsson, Skúlason, Lanki, Rellstab and Jokela2013; Stutz et al., Reference Stutz, Schmerer, Coates and Bolnick2015; Franke et al., Reference Franke, Armitage, Kutzer, Kurtz and Scharsack2017). Further, population-level differences in host resistance contribute to differential infection prevalence (Hamley et al., Reference Hamley, Franke, Kurtz and Scharsack2017; Weber et al., Reference Weber, Steinel, Shim and Bolnick2017a; Piecyk et al., Reference Piecyk, Hahn, Roth, Dheilly, Heins, Bell and Kalbe2021). In the current study, we used a fish–cestode host–parasite system to investigate when infection occurs and to examine changes in infection prevalence (% of infected fish) during the winter when the host has fewer resources.
The study system
Following the last glacial maximum, oceanic threespine stickleback (Gasterosteus aculeatus) colonized freshwater habitats where they had to adapt to new environmental conditions, including new parasites. The cestode Schistocephalus solidus is trophically transmitted with a 3-host life cycle. The free-swimming, first larval stage (coracidium) hatches in freshwater and, after ingestion by the first intermediate host, a cyclopoid copepod develops into the second larval stage (procercoid). After the second intermediate host, the threespine stickleback, consumes the infected copepod, S. solidus will penetrate the fish's gut wall and develop into the third larval stage (plerocercoid). Most of the parasite's growth occurs in the stickleback host and the threshold weight for successful reproduction is around 50 mg (Tierney and Crompton, Reference Tierney and Crompton1992). When the infected stickleback is ingested by the final host, a warm-blooded vertebrate and typically a piscivorous bird, reproduction occurs rapidly (Tierney and Crompton, Reference Tierney and Crompton1992; Barber et al., Reference Barber, Wright, Arnott and Wootton2008). The tapeworm's eggs are released into the water with the bird's feces within a few days of infection and the cycle begins again. Alaskan stickleback typically spawn from mid-May through June (Heins et al., Reference Heins, Singer and Baker1999), and females produce several clutches per breeding season. Shortly after hatching, young-of-year stickleback (juveniles that are <1 year old) start eating macroinvertebrates, and stickleback as small as 15 mm feed heavily on copepods, the potential host of S. solidus. As the stickleback grow, they consume fewer copepods (Milinski and Christen, Reference Milinski and Christen2005), making it likely that stickleback become infected early during their lives (Pennycuick, Reference Pennycuick1971; Christen and Milinski, Reference Christen and Milinski2003; Heins et al., Reference Heins, Eidam and Baker2016). Heins et al. (Reference Heins, Eidam and Baker2016) provided empirical evidence that young-of-year stickleback in Cheney Lake (AK, USA) were infected during their first summer. Pennycuick (Reference Pennycuick1971) found a similar pattern in Priddy Pool (Somerset, England), where over 78% of young-of-year stickleback were infected within months after hatching. Both of these studies only tracked individual populations, but we know that: (1) different freshwater populations of stickleback exhibit very different S. solidus loads (Pennycuick, Reference Pennycuick1971; Heins and Baker, Reference Heins and Baker2003, Reference Heins and Baker2011, Reference Heins and Baker2014; Heins et al., Reference Heins, Birden and Baker2010, Reference Heins, Baker and Green2011; Morozińska-Gogol, Reference Morozińska-Gogol2011; Weber et al., Reference Weber, Steinel, Shim and Bolnick2017a), and (2) there can be strong variation in infection intensity within lakes between years (Pennycuick, Reference Pennycuick1971; Heins and Baker, Reference Heins and Baker2011).
The mechanisms behind the population-level variation in S. solidus infections are an area of ongoing research. It was long assumed that the high mobility of the definitive bird host would lead to high gene flow/migration rates in S. solidus and consequently results in a panmictic genetic structure (reviewed in Nadler, Reference Nadler1995). However, recent work (Sprehn et al., Reference Sprehn, Blum, Quinn and Heins2015) found evidence for fine-scale population structure of S. solidus in the Cook Inlet region of southcentral Alaska. It is assumed that these observed patterns of genetic variation in S. solidus may represent adaptions to host genotypes. Indeed, evidence suggests co-evolution between hosts and parasites on different geographical scales (Hamley et al., Reference Hamley, Franke, Kurtz and Scharsack2017; Weber et al., Reference Weber, Steinel, Shim and Bolnick2017a; Piecyk et al., Reference Piecyk, Hahn, Roth, Dheilly, Heins, Bell and Kalbe2021). Additionally, infections measured in the laboratory and in the wild have shown that the environment in which hosts and parasites interact substantially affects the strength and specificity of selection, and different components of host–parasite fitness seem to be differentially altered by the environment (Wolinska and King, Reference Wolinska and King2009; Karvonen et al., Reference Karvonen, Kristjánsson, Skúlason, Lanki, Rellstab and Jokela2013; Stutz et al., Reference Stutz, Schmerer, Coates and Bolnick2015; Franke et al., Reference Franke, Armitage, Kutzer, Kurtz and Scharsack2017). To further our knowledge regarding changes in natural infection levels over time and importantly across different populations, we studied 3 different Alaskan stickleback populations for 2 consecutive cohorts: 2018/19 and 2019/20, measuring the infection rate in young-of-year and 1-year-old stickleback. We chose stickleback populations with different adult infection rates (Heins et al., Reference Heins, Birden and Baker2010, unpublished data) and were interested if these differences were already detectable in young-of-year fish. We expected that young-of-year fish from the high infection population would already harbour more S. solidus larvae than young-of-year fish from the low infection population. Further, we hypothesized that infection prevalence would decrease over the winter as infected sticklebacks should have an increased mortality compared to uninfected sticklebacks.
Methods
Collections and procedures were approved by annual Aquatic Resource Permits from the Alaskan Department of Fish and Game (P-18-011, P-19-0111, P-20-004), and IACUC approved animal care protocols (013R).
We chose Walby, Cornelius and Wolf lakes in southcentral Alaska for this study as they are easily accessible for repeated sampling and adult fish in Walby Lake and Cornelius Lake show strong differences in their S. solidus infection rates. Over a period of 7 years (1996, 1999–2004), the mean infection prevalence (% infected fish) in Cornelius fish was 7 ± 4% (standard deviation) (unpublished data). The mean infection prevalence in Walby fish was 50 ± 20% (standard deviation) over a sampling period of 8 years (1996–2003) (Heins et al., Reference Heins, Birden and Baker2010). No data were available on infection prevalence in Wolf fish. Since the study already included 1 high and 1 low infection lake, we decided to include a lake without prior knowledge of the infection intensity. To assess infections of the 2018 cohort, we sampled Walby Lake and Cornelius Lake in August 2018 and June 2019. To assess infections of the 2019 cohort, we sampled all 3 lakes in August 2019 and June 2020. The lake coordinates and sample sizes are listed in Table 1.
Table 1. Lake coordinates and sample sizes for young-of-year (yoy) and 1-year-old (1 yo) stickleback from cohort 2018 (yoy-2018 and 1 yo-2019) and cohort 2019 (yoy-2019 and 1 yo-2020) for the sample lakes

Young-of-year stickleback infection rate
In mid-August of 2018 and 2019, we caught young-of-year stickleback (juveniles that are <1 year old) based on size, using 4-inch aquarium nets in shallow areas of the sampled lakes. In August, young-of-year stickleback should be between 2 and 3 months old, depending on the time of hatching during the spawning season (Heins et al., Reference Heins, Singer and Baker1999). On the day of collection, we euthanized the stickleback with an overdose of MS-222 (Tricaine-S, Syndel, Ferndale, USA), and determined the infection status based on a protocol previously established by Wohlleben et al. (Reference Wohlleben, Franke, Hamley, Kurtz and Scharsack2018). In short, following dissection, we screened the body cavity and organs for S. solidus under a dissection microscope [Trinocular Zoom Stereo Microscope, EMZ-TR (0.7×–4.5×), Meiji, Tokyo, Japan]. If no S. solidus were discovered, we rinsed the body cavity with water into a Petri dish and screened the dish and the body cavity immediately. If we still could not find any parasites, we incubated the dissected stickleback in water at room temperature for about 30 min, and subsequently screened again. Each stickleback was either screened 3 times by 2 different people or until S. solidus parasites were found. This method was found to be reliable for detecting parasites as early as 24 h after infection (Wohlleben et al., Reference Wohlleben, Franke, Hamley, Kurtz and Scharsack2018).
One-year-old stickleback infection rate
We collected stickleback 1 year and older from the sampled lakes in the first 2 weeks of June 2019 and 2020 using unbaited, 6 mm wire-mesh minnow traps set for a day at different locations near shore. We euthanized the fish until quiescent with MS-222 and stored them in 10% buffered formalin until further examination. At Clark University, we dissected the fish and examined the body cavities for any plerocercoids under a dissection microscope [Trinocular Zoom Stereo Microscope, EMZ-TR (0.7×–4.5×), Meiji]. We removed, counted and, if possible, weighed (to the neatest 0.1 mg) all parasites (Table S1) with a digital scale (College Precision Balance, B303-S, Mettler Toledo, Greifensee, Switzerland). We used a dial calliper (Dial Calliper, 505-647, Mitutoyo, Kawasaki, Japan) to measure the standard length (to the nearest 0.1 mm; body length from the tip of the nose to the last vertebrae) and recorded the weight before and after dissection (to the nearest 0.1 mg) (College Precision Balance, B303-S, Mettler Toledo) of all stickleback.
Calculating age distribution of 1-year and older stickleback
In spring, several age groups of stickleback are present in the same lake, and random sampling results in the capture of mixed age groups. Therefore, we had to determine the age distribution in our samples to assess the infection rate of 1-year-old fish. Typically, when determining age-based growth for fish, weight is preferred over length since the latter slows down throughout life, whereas weight continues to increase nearly linearly (Baker et al., Reference Baker, Heins, Foster and King2008). However, S. solidus infection is likely to reduce the weight of the host fish, which should lead to a biased weight distribution. Therefore, for this experiment, length was chosen as it should be a more accurate measure (Barber and Svensson, Reference Barber and Svensson2003; Heins et al., Reference Heins, Baker and Green2011, Reference Heins, Eidam and Baker2016). To estimate the size that appears to separate 1-year-olds from older stickleback, we grouped the stickleback based on their standard length and initially assessed the distribution visually (Fig. S1). To verify these first estimates, we used a maximum likelihood-based method and grouped the data with a combination of a Newton-type algorithm and the EM algorithm (MacDonald and Pitcher, Reference Macdonald and Pitcher1979). We used the population mean plus the population standard deviation as the age determinant for 1-year-old stickleback. With this method we likely excluded some 1-year-old stickleback, but the certainty is higher that no 2-year-old stickleback were incorporated in downstream analyses. The exact cut-off values and statistical data are shown in Table 2. This method of determining age did not work for the samples from Cornelius Lake since relatively few 1-year-old compared to older fish were caught during sampling. Therefore, we used 7 years of dissection data that were originally collected for other purposes (unpublished data) to determine the cut-off size for 1-year-old stickleback as described above.
Table 2. Population parameters and maximum cut-off values for 1-year-old stickleback

Cornelius Lake samples from cohort 2018 (Cornelius – original) could not be used to determine age cut-off values (lack of small fish in the samples), therefore 7 years of data from Cornelius Lake fish (Cornelius – collection) were used instead. The cut-off value is the population mean + the standard deviation. Population mean and standard deviation were calculated using a maximum likelihood-based approach.
Statistics
All statistical analyses were performed in the R statistics software (Version 4.0.3) (R Core Team, 2020). All R packages used are listed in the Supplementary Material (Table S2). To test for differences in infection prevalence (dependent variable) between lakes (independent variable) within age group and cohort, we ran a binomial logistic regression using generalized linear models (Crawley, Reference Crawley2012). Since there were only 2 layers of the independent variable (Lake) in 2018, we did not calculate a post-hoc comparison. For the comparison of infection prevalence within stickleback age groups for the 2019 cohort, we calculated a Tukey-corrected post-hoc pairwise comparison. Similarly, to assess the differences in infection prevalence between stickleback age groups within cohort and lake, we ran binomial logistic regressions with lake and age as independent variables and infection prevalence as the dependent variable. We calculated a Tukey-corrected post-hoc pairwise comparison. We analysed differences in mean parasite weight and mean parasite number per fish (Table S1) in the same way as described above.
Results
Development of infection over the winter
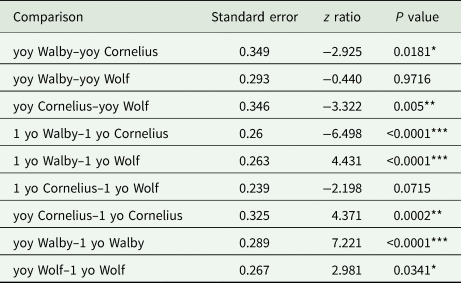
In the 2018 cohort, the infection prevalence between young-of-year (caught in August 2018) and 1-year-old (caught in June 2019) stickleback decreased significantly in the high-infection Walby Lake (yoy: 66.98%, 1 yo: 48.67%), but we found no significant change in the low-infection Cornelius Lake (yoy: 21.78%, 1 yo: 19.3%) (Table 3, Fig. 1). In the 2019 cohort, we observed a significant increase in infection prevalence in Walby Lake (yoy: 31.13%, 1 yo: 78.41%) and Cornelius Lake (yoy: 14.02%, 1 yo: 39.66%) over the winter. Despite a slight increase in infection prevalence in Wolf Lake (yoy: 33.96%, 1 yo: 41.79%), this change was not statistically significant (Table 4, Fig. 1).

Fig. 1. Probability of being infected with Schistocephalus solidus (% infected fish) for young-of-year and 1-year-old stickleback. (a) Cohort 2018; (b) cohort 2019. The error bars represent 95% confidence intervals and were calculated using a logit regression. Capital letters above error bars indicate statistically significant differences between age groups within lake and cohort. Lower case letters indicate statistically significant differences between lakes within age group and cohort. Sample size (cohort 2018) yoy Walby, 106; yoy Cornelius, 101; 1 yo Walby, 123; 1 yo Cornelius, 71. Sample size (cohort 2019) yoy Walby, 106; yoy Cornelius, 107; yoy Wolf, 106; 1 yo Walby, 149; 1 yo Cornelius, 149; 1 yo Wolf, 137.
Table 3. Statistical results for comparisons of cohort 2018 fish using a binomial logit regression

yoy, young-of-year; 1 yo, 1-year-old.
*P < 0.05, ***P < 0.001
Table 4. Statistical results for comparisons for cohort 2019 fish using a binomial logit regression and a Tukey-corrected post-hoc comparison
yoy, young-of-year; 1 yo, 1-year-old.
*P < 0.05, **P < 0.01, ***P < 0.001
Differences in infections between lakes
Comparison of the young-of-year stickleback from the 2018 cohort revealed a significant difference in infection rate between the 2 lakes: young-of-year stickleback from Walby Lake were more likely to be infected with S. solidus than stickleback from Cornelius Lake (Walby: 66.98%, Cornelius: 21.78%). One-year-old fish from the 2018 cohort showed the same pattern (Walby: 48.67%, Cornelius: 19.3%) (Table 3, Fig. 1). Comparison of the young-of-year fish from the 2019 cohort (Walby, Cornelius and Wolf lakes) showed a significant association between infection rate and lake (Table 4, Fig. 1). Young-of-year fish from Cornelius Lake had a lower probability of being infected compared to fish from the other 2 sample lakes (Walby: 31.13%, Cornelius: 14.02%, Wolf: 33.96%). In the 1-year-old fish, the infection prevalence of fish from Cornelius Lake and Wolf Lake resembled each other, while fish from Walby Lake had a higher chance of being infected with S. solidus (Walby: 78.41%, Cornelius: 39.66%, Wolf: 41.79%) (Table 4, Fig. 1). The mean parasite number and mean parasite weight per fish did not differ for the 1-year-old stickleback between lakes (Table S1).
Discussion
In the present study, we examined the infection prevalence of young-of-year stickleback with the cestode S. solidus and how this changed over winter for the same cohort. Stickleback from 3 Alaskan populations had S. solidus infections only few months after hatching, showing strong variation in infection prevalence between sampling years and age groups.
Infection of young-of-year threespine stickleback and changes over the winter
Within a few months of hatching, young-of-year stickleback already harbour S. solidus plerocercoids (Fig. 1). This is not surprising considering small stickleback predominantly eat copepods, the first intermediate host of S. solidus (Pennycuick, Reference Pennycuick1971; Christen and Milinski, Reference Christen and Milinski2003; Heins et al., Reference Heins, Eidam and Baker2016). However, this observation raises questions regarding the fitness of these parasites, as they now find themselves in hosts that are too small for the parasite to grow to sexual maturity (>50 mg) (Tierney and Crompton, Reference Tierney and Crompton1992). The parasite has reached a reproductive dead end unless it can allow its host to grow to an appropriate size (Christen and Milinski, Reference Christen and Milinski2003). Even if parasites smaller than 50 mg are capable of maturing in the final host (Heins et al., Reference Heins, Baker and Martin2002), the small size of young-of-year fish in the sampled lakes may prevent the parasite from reaching a size required for sexual maturity. Similarly, previous research has shown that high infection intensities within a single stickleback host can cause large numbers of S. solidus larvae to fail to reach a size that is large enough to mature in the final avian host due to both energy and space constraints (Heins and Baker, Reference Heins and Baker2011). Christen and Milinski (Reference Christen and Milinski2003) found that infected stickleback still allocate resources towards growth even though S. solidus parasites convert energy more efficiently than stickleback (Walkey and Meakins, Reference Walkey and Meakins1970). This could indicate an adaptive life-history strategy of restrained growth in S. solidus – a parasite that grows too quickly or that is too virulent might overexploit its intermediate host and risk damaging or killing it before being transmitted to the next host (Christen and Milinski, Reference Christen and Milinski2003).
We observed a significant decrease in infection prevalence in young-of-year Walby fish over the winter in the 2018 cohort, but not in Cornelius fish. However, in the 2019 cohort, the infection prevalence increased significantly over the winter in both Walby and Cornelius fish, with no change in Wolf fish (Fig. 1). The different trends in the same lakes for 2 consecutive years suggest the development of infection prevalence over the winter is not as easily predictable as we hypothesized. It would be useful to examine the parasite load per fish (parasite weight or parasite number), since fish with fewer or smaller parasites should survive the winter better. For our study, no difference in the mean parasite number nor mean parasite weight per fish was found in the 1-year-old stickleback (Table S1). Unfortunately, we did not collect data on the parasite weight and number in young-of-year stickleback. Schistocephalus solidus infection intensity and host:parasite weight ratios have been found to vary between years (Heins et al., Reference Heins, Birden and Baker2010), and we are therefore careful about interpreting this finding.
We observed an increase in infection prevalence over the winter in Walby and Cornelius fish in the 2019 cohort. However, there is no solid evidence of increased survivorship of infected fish over the winter (reviewed in Barber and Scharsack, Reference Barber and Scharsack2010). In fact, on restricted diets infected stickleback seem to die earlier than non-parasitized fish (reviewed in Barber et al., Reference Barber, Wright, Arnott and Wootton2008). The increase in infections likely results from young-of-year stickleback feeding on (infected) copepods after our August sampling, leading us to underestimate the actual number of infections that occurred before lakes freeze over, typically between October and December (Woods, Reference Woods1985). Heins et al. (Reference Heins, Eidam and Baker2016) observed that infection rates continued to climb throughout autumn, with around 30% of young-of-year Cheney Lake (AK) fish infected with S. solidus in mid-September, and nearly 50% of young-of-year infected by mid-October. In the same study, the infection prevalence nearly doubled between mid-October and the following June. Copepods are unlikely to acquire new infections under ice since the development of fully formed S. solidus embryos is highly temperature-dependent, and the hatching of coracidia may not occur at temperatures below 5°C (Dubinina, Reference Dubinina1957; Mason, Reference Mason1966). Once hatched, the free-living coracidium needs to be ingested by the first host within days (Thomas, Reference Thomas1947; Dubinina, Reference Dubinina1957; Smyth and Clegg, Reference Smyth and Clegg1959). The only possibility for stickleback to become infected under the ice cover is from a reservoir of infected copepods. Cyclopoid copepods lower their metabolism at low temperatures (Maier, Reference Maier1990), and unfortunately the interaction between S. solidus and its first intermediate host is extremely understudied, so it is unclear how long the copepod host can stay infected and successfully transmit S. solidus. We are aware that early after infection, S. solidus larvae are still relatively small (~100 μm), and detection is difficult but can be accurate if the parasites are still alive (Wohlleben et al., Reference Wohlleben, Franke, Hamley, Kurtz and Scharsack2018). For this reason, the infection rate was assessed right after euthanizing young-of-year stickleback. During the dissection, only parasites in the body cavity but not the stomach were counted.
Differences in infections between lakes
Due to the independent colonization of freshwater habitats by marine stickleback, resistance to S. solidus infections varies among lakes and host populations (e.g. Weber et al., Reference Weber, Steinel, Shim and Bolnick2017a, Reference Weber, Kalbe, Shim, Erin, Steinel, Ma and Bolnick2017b). Consistent with previous observations in adult Walby and Cornelius fish, young-of-year stickleback from Walby Lake (high infection population) already showed a higher infection prevalence than fish from Cornelius Lake (low infection population) (Fig. 1). As there were no previous reports on infection prevalence or intensity on Wolf fish, we had no prior expectations. Currently, there is little information about the systemic responses in stickleback originating from the 3 sampling lakes, but an increasing number of studies in different Canadian and European stickleback populations suggests population-specific responses in the innate and adaptive immune system following exposure to S. solidus (Lohman et al., Reference Lohman, Steinel, Weber and Bolnick2017; Fuess et al., Reference Fuess, Weber, den Haan, Steinel, Shim and Bolnick2021), and recent work examines the role of fibrosis-induced suppression of parasite growth in some stickleback populations (Weber et al., Reference Weber, Steinel, Shim and Bolnick2017a). Having established that young-of-year stickleback are able to be infected, it is important to focus future research on population-level differences in the immune response of infected and uninfected stickleback during different time points post infection, starting as soon after hatching and parasite exposure as possible.
According to previous research in laboratory-bred stickleback, only fish smaller than 38 mm will ingest copepods (Christen and Milinski, Reference Christen and Milinski2003) and consequently lakes with generally smaller stickleback might be more likely to become infected. We however did not find this pattern in the current study, as 1-year-old fish in Walby Lake (cohort 2019) had the second largest average size, after those in Wolf Lake, but had the highest infection prevalence (Fig. 1). All 3 of the sampling lakes are ecologically very similar apart from their depths: The average depth of Walby Lake and Wolf Lake is 1.7 and 2.1 m, respectively, with both reaching a maximal depth of not more than 5.5 m. In contrast, the low-infection Cornelius Lake reaches an average depth of 7 m, with a maximal depth of 16.5 m (Alaska Department of Fish and Game). In deep lakes such as Cornelius Lake, typically a thermocline forms, and S. solidus eggs deposited into limnetic areas may sink below the hypolimnion where they would be subject to low temperatures and light conditions. This should at least hamper if not prevent egg development and would result in a reduced infection pressure for stickleback. The infection rate in both Walby and Cornelius lakes was lower in young-of-year fish in 2019 compared to 2018. This is not surprising as there is strong evidence that parasite loads can vary substantially between years (Pennycuick, Reference Pennycuick1971; Heins et al., Reference Heins, Birden and Baker2010, Reference Heins, Baker and Green2011; Heins and Baker, Reference Heins and Baker2011; Morozińska-Gogol, Reference Morozińska-Gogol2011; Weber et al., Reference Weber, Steinel, Shim and Bolnick2017a). Although the mechanisms behind these fluctuations are not known yet, it has been shown that high infection prevalence can result in a crash in population size of the stickleback host, causing a dramatically reduced transmission of S. solidus and hence a reduction of infections in the following years (Heins and Baker, Reference Heins and Baker2011; Heins et al., Reference Heins, Birden and Baker2010). Due to time and money restrictions, data about population size were not collected, and therefore it is uncertain if the decrease in infection prevalence observed was caused by a dip in stickleback abundance.
Concluding remarks
In summary, we demonstrate here that young-of-year fish from the high infection population (Walby Lake) already had higher infection rates than fish from the low infection population (Cornelius Lake). By comparing multiple populations, we also showed that there is variability in infection prevalence between the sampled lakes as well as in the direction in which the infection prevalence changes over the winter. It is not clear if (un)infected fish survive disproportionately or if stickleback can acquire new infections over the winter, and future studies on this topic are needed. Tracking individual stickleback over the winter and assessing survival and infection status could be a first step, extending existing work by Heins and Baker (Reference Heins and Baker2011). Most importantly, we demonstrate that large numbers of stickleback in 3 Alaskan populations were infected with S. solidus only a few months after hatching, supporting previous reports from Pennycuick (Reference Pennycuick1971) and Heins et al. (Reference Heins, Eidam and Baker2016). The timing of infection is likely to vary globally with climate and the length of host and parasite life cycles. Future studies should focus on pin-pointing the timing of infection in more stickleback populations in different parts of the northern hemisphere. Further, we propose that the finding that Alaskan stickleback are infected within few months of hatching should be considered in the design of future lab infection studies. To generate data that are more applicable to natural field situations, it seems necessary to pay attention to the natural timing of infection for different wild populations.
Supplementary material
The supplementary material for this article can be found at https://doi.org/10.1017/S0031182022000567.
Data
Data available upon request.
Acknowledgements
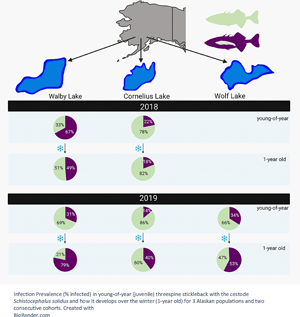
Susan Foster and John Baker were instrumental for the development and execution of this project. Sadly, they passed away before the submission of this manuscript. Susan and John were amazing mentors and friends. We mourn their untimely passing and dedicate this paper to their memory. We would like to thank Kayleigh McHugh and Katie Crowley for their assistance with data collection and fieldwork in Alaska. We would also like to extend our deepest gratitude to Dr. Jesse Weber (and his students) for collecting much needed stickleback samples in June 2020 when the pandemic made it impossible for us to travel. We are extremely grateful to Susan Gunther, Ralph Baldwin and Doona for housing us in Alaska. We would like to thank Richard Chiolero and the Mat-Su college for letting us use one of their teaching labs during our fieldwork in August 2018. We also thank Dr. Robert Drewell and Dr. Kaitlyn Mathis, who gave much valuable advice in the early stages of this work. The graphical abstract was created with BioRender.com. Finally, we would like to acknowledge the Nipmuc people (MA) and Dena'ina Elnana and Dënéndeh tribes (AK) on whose land I conducted my research.
Author contributions
A. W., S. F. and J. B. conceived and designed the study. A. W. conducted data gathering and performed statistical analyses. A. W., N. M. and N. S. wrote the article.
Financial support
This research was supported by Sigma Xi (Grants in Aid of Research), the John Templeton Foundation (grant number: 24541) and the Department of Biology at Clark University.
Conflict of interest
None.
Ethical standards
The authors assert that all fish collections were made in accordance with IACUC approved animal use protocols from Clark University (013R) and approved Aquatic Resource Permits from the Alaskan Department of Fish and Game (P-18-011, P-19-0111, P-20-004).


 Open access