


Introduction
Host−parasite associations are structured by complex and interrelated constraints, including geographic range overlap, evolutionary relatedness and life-history traits (Cooper et al., Reference Cooper, Kamilar and Nunn2012b; Dallas et al., Reference Dallas, Park and Drake2016; Olival et al., Reference Olival, Hosseini, Zambrana-Torrelio, Ross, Bogich and Daszak2017; Albery et al., Reference Albery, Eskew, Ross and Olival2020). Parasite species do not interact with a random subset of available host species but instead are involved in complex tradeoffs related to the number of host species they can potentially infect relative to the efficacy with which they can exploit host resources for survival, growth and reproduction (Krasnov et al., Reference Krasnov, Poulin, Shenbrot, Mouillot and Khokhlova2004; Leggett et al., Reference Leggett, Buckling, Long and Boots2013). Estimating the factors that shape host−parasite associations is of fundamental importance to parasitologists and ecologists, as understanding the drivers and distribution of species diversity is a central aim of ecology. From an applied perspective, predicting host−parasite associations is an increasing priority, given the global homogenization of biota and changing land use (Dornelas et al., Reference Dornelas, Gotelli, McGill, Shimadzu, Moyes, Sievers and Magurran2014, Reference Dornelas, Gotelli, Shimadzu, Moyes, Magurran and McGill2019; Borremans et al., Reference Borremans, Faust, Manlove, Sokolow and Lloyd-Smith2019) that brings novel host species – including humans – into close contact.
Host species that are more similar to one another tend to have more similar parasite communities (Dallas and Poisot, Reference Dallas and Poisot2018), and more phylogenetically similar parasite species tend to infect a phylogenetically similar set of host species (Dallas et al., Reference Dallas, Park and Drake2016). These simple phylogenetic rules suggest that data on other host and parasite species can inform predictive models of host−parasite associations. However, host−parasite associations may be formed dependent on parasite type, meaning that host traits important to one parasite group could have null or opposing effects on another parasite group. For example, if a gastrointestinal parasite and an ectoparasite have similar host species, we can use this to predict potential hosts for either parasite; however, we presume these two parasites are responding in a similar manner to some qualities of those host species. Although the host community of the two parasites may be quite similar, the underlying responsible host life-history characteristics are likely quite different. Aspects of skin thickness may be important in determining infection success for ectoparasites (Moorhouse and Tatchell, Reference Moorhouse and Tatchell1966) but may be irrelevant for a gastrointestinal parasite reliant on food-borne transmission. Such an example is more broadly illustrative of the encounter and compatibility filters that different parasites experience when infecting distinct host species (Combes, Reference Combes2001).
The complexities of parasite life history and parasite specificity create an odd tradeoff for the development of predictive models. On one hand, the inclusion of more records of host−parasite association may allow better estimating the importance of host or parasite traits that result in a given interaction between host and parasite species. For example, a fast life history strategy is one of the key traits shaping the richness of all zoonotic pathogens in rodents (Han et al., Reference Han, Schmidt, Bowden and Drake2015). Similarly, even in trait-free approaches, more associations could help to more precisely estimate the similarity between host species or parasite species in their interaction with one another. This suggests that including more data would improve model performance. On the other hand, the inclusion of parasite taxa that are distributed independently – or differently than other parasite taxa – across host species could reduce model performance by adding noise to any host trait or phylogenetic signal present in each parasite taxon. Because traits of hosts or parasites have evolved along lineages, life history may be confounded with taxonomy in models using all possible host−parasite associations (Washburne et al., Reference Washburne, Crowley, Becker, Olival, Taylor, Munster and Plowright2018; Albery and Becker, Reference Albery and Becker2020), and this challenge may not simply be overcome by including taxonomy as a predictor. Lastly, a model that includes all data could perform well at predicting higher-order associations between host and parasite species but perform worse relative to a more taxon-specific model. Although ecology and evolution more broadly have increasingly considered how ‘phylogenetic scale’ shapes general patterns of species distributions (Cruz et al., Reference Cruz, Fitzgerald, Espinoza and Ii2005; Cavender-Bares et al., Reference Cavender-Bares, Keen and Miles2006), consideration of how host−parasite associations vary across or within taxonomic ranks remains unexplored. However, such consideration of the phylogenetic scale of host and/or parasite species could have important implications for predictive models of infectious disease.
Here, we explore how predictive models of host−parasite associations differ in terms of performance and the importance of both host and parasite traits when we compare models leveraging the full range of parasites to taxon-specific models (Fig. 1). To do this, we used the London Natural History Museum's (LNHM) database of host−helminth associations (Gibson et al., Reference Gibson, Bray and Harris2005), the most extensive database of host–parasite interaction data currently in existence. Restricting our analyses to all mammals and their helminth parasites, we developed predictive models of helminth associations, comparing the full model to helminth taxonomic subsets consisting of Acanthocephalans, Nematodes and Platyhelminthes. We find taxon-specific models consistently outperformed the full model in predicting mammal-helminth associations, despite the taxon-specific submodels generally identifying the same set of important life-history characteristics of host and parasite species.
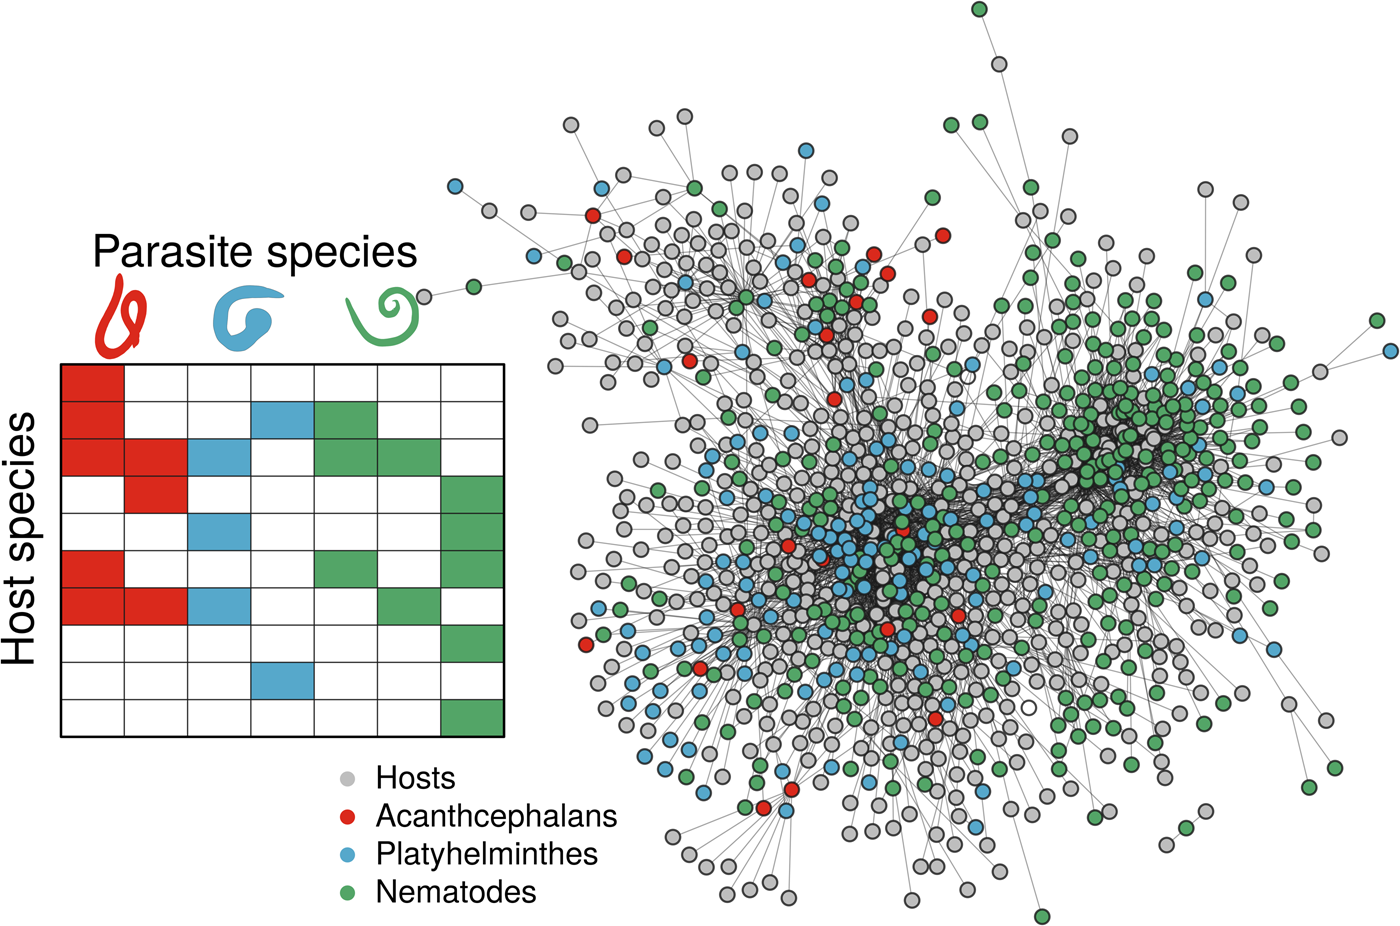
Fig. 1. Associations of different helminth parasite taxa (indicated with colour) and their mammal host species, using both a simple representation of the interaction matrix (left panel), and the real data as a network plot (right panel), where nodes represent host or parasite species (indicated by colour) and links between them represent instances of recorded host−helminth interactions. Host−helminth associations were modeled as a function of both host and helminth variables, using either all the data available or data on a specific helminth taxon (Platyhelminthes, Acanthocephalans or Nematodes). By using data on all associations, it may expand the available host and helminth covariate space, enhancing the discrimination capacity of the model. However, by subsetting to specific parasite taxa, we constrain the host and helminth covariate space to include only the most relevant information to the modeling task.
Methods
Host–helminth interaction data
Records of helminth parasite occurrences on host species were obtained from the parasite database of the LNHM (Gibson et al., Reference Gibson, Bray and Harris2005) and accessed programmatically using the helminthR package (Dallas, Reference Dallas2016). These data currently represent one of the largest sources of host–parasite interaction data (Gibson et al., Reference Gibson, Bray and Harris2005; Dallas et al., Reference Dallas, Aguirre, Budischak, Carlson, Ezenwa, Han, Huang and Stephens2018), despite being restricted to helminth parasites. Host–helminth interaction data are georeferenced only to the geopolitical location (e.g. France), large water body (e.g. Lake Michigan), or coast (e.g. coast of Argentina) for over 400 terrestrial and aquatic locations. We removed host–helminth interactions from locations that were aquatic/marine, overly vague, or locations nested within other locations (e.g. ‘Western Europe’). This resulted in data on a total of 555 host species and their associations with 151 Platyhelminthes (trematodes and cestodes), 22 Acanthocephalans and 327 Nematodes (Fig. 1). LNHM data are reported per host−helminth species and are not stratified by parasite life stage, which could obscure how different hosts maintain helminths across complex life cycles.
From these data, we considered three different geographic scales of analysis; global, USA and a state within the USA (Texas). Geographic scale influences the number of host and helminth species, limiting the available interaction and covariate space that the model is trained upon and thus possibly further affecting the performance of helminth taxonomic subgroup models relative to the full model. The amount of data lost by focusing on smaller geographic scales was pronounced, with the number of host species decreasing from 555 in the global network to 122 in the US network and a mere 18 in the state of Texas. Similar patterns were observed for parasite richness, which decreased from 500 helminth species in the global network to 234 in the USA and 62 in the state of Texas. Note that these numbers reflect those helminth species for which we had parasite trait data available and not the absolute diversity of helminth parasites in a given location.
Host and parasite species variables
Host species variables were obtained from PanTHERIA (Jones et al., Reference Jones, Bielby, Cardillo, Fritz, O'Dell, Orme, Safi, Sechrest, Boakes, Carbone, Connolly, Cutts, Foster, Grenyer, Habib, Plaster, Price, Rigby, Rist, Teacher, Bininda-Emonds, Gittleman, Mace, Purvis and Michener2009), restricting the analyses to mammal host species. These data included covariates describing host morphology, life history, geography and taxonomy (see Supplemental Material), which are generally considered as aspects of host species that affect host–parasite interactions (Sears et al., Reference Sears, Snyder and Rohr2015; Dallas et al., Reference Dallas, Park and Drake2016) and zoonotic spillover potential (Olival et al., Reference Olival, Hosseini, Zambrana-Torrelio, Ross, Bogich and Daszak2017). We only considered host variables with more than 80% data coverage, resulting in a total of 19 host covariates. Further, host or parasite species for which no covariate data were available were removed from the analysis. The fraction of missing data ranged from 9% for species adult body mass to 15% for species litter size. Host data were obtained independently from the interaction data, such that data on geography and environmental covariates are estimated from host spatial distribution data independent of the host occurrences at geopolitical scales in the LNHM data.
Parasite variables were compiled from the species description of each parasite from five helminth taxonomy references (Petrochenko and Skrjabin, Reference Petrochenko and Skrjabin1971; Yamaguti, Reference Yamaguti1971; Levine, Reference Levine1980; Crompton and Nickol, Reference Crompton and Nickol1985; Anderson, Reference Anderson2000). These data were aggregated by Dr Alyssa Gehman and have been published previously elsewhere (Dallas et al., Reference Dallas, Gehman, Aguirre, Budischak, Drake, Farrell, Ghai, Huang and Morales-Castilla2019). A total of 18 helminth parasite covariates were considered, including taxonomic information (phylum and class), infection sites (e.g. ‘intestine’), and numerous measures of helminth morphology (e.g. length and width of different life stages). A full list of host and parasite variables is provided in Supplemental Materials.
Boosted regression tree models
Boosted regression tree (BRT) models were used to estimate the suitability of an association between mammal host and helminth parasite species using the gbm R package (Ridgeway, Reference Ridgeway2006). This is a flexible regression approach that allows for non-linear responses, variable interactions and missing data (Elith et al., Reference Elith, Leathwick and Hastie2008). The response we modelled is a binary variable representing the existence of a known interaction between a host and helminth species, which is determined by the combination of aspects of both host and helminth species; absences are those host–parasite interactions not observed in the LNHM dataset. BRTs are well suited for capturing complex patterns in data and for identifying important predictor variables and they often outperform parametric models (e.g. GLMs; Pichler et al., Reference Pichler, Boreux, Klein, Schleuning and Hartig2020). However, we acknowledge that other predictive approaches (e.g. random forests) might generate different results.
We trained models separately for each parasite taxonomic phylum (Platyhelminthes, Acanthocephalans and Nematodes), and for all helminth parasites combined. Accordingly, parasite phylum was included in the full model but not in the taxonomic subset models. Further, we also trained models for the entire global host–helminth interaction data and for geographic subsets of the USA and the state of Texas. These geographic locations were selected out of convenience and data availability. It is important to note that this geographic restriction affects model performance in two different ways. First, models trained on fewer interactions will likely be less accurate. Second, models trained on fewer species will likely be unable to determine the host and parasite traits most important to the link prediction task. That is, geographic extent, in a large part, is simply a measure of data quantity.
For each parasite group and geographic scale combination, we trained 50 BRT models on 80% of the available data and estimated interaction suitability on the remaining 20% test set. Models were trained using a maximum of 50 000 trees, with a learning rate of 0.001 (Elith et al., Reference Elith, Leathwick and Hastie2008), binomial error structure and an interaction depth of 3, which allows for interactions between covariates. All models were internally cross-validated (5-fold) to determine the optimal number of regression trees.
Comparing model performance, predictions, and variable importance
Model performance was estimated using area under the curve (AUC; Bradley, Reference Bradley1997), accuracy (Sing et al., Reference Sing, Sander, Beerenwinkel and Lengauer2005), and the true skill statistic (TSS; Allouche et al., Reference Allouche, Tsoar and Kadmon2006). We measured accuracy as the maximum fraction of true positive and true negative values in the test set divided by the total number of cases, with decision threshold separating the cases set to maximize accuracy. Each measure of model performance was calculated for each model, resulting in a total of 50 estimates of model performance per parasite phyla submodel and full model. Further, predictions from the full model were subset by parasite taxa, in order to evaluate the ability of the full model to capture taxa-specific variation in host–helminth interactions. We used Welch's two-sample t-tests to compare model performance between the full model and each parasite taxa subset.
Estimated host–helminth interaction relative suitability values for each submodel were related to the relative suitability values for the same interactions generated from the full model. This was performed in order to examine the ability of each model to accurately distinguish host–helminth parasite interactions using all host−helminth association data available, or a perhaps more relevant helminth taxonomic subset of interactions.
Finally, we estimated average variable importance measures across models trained on parasite taxonomic subsets and the full model to determine if restricting parasite taxonomic resolution changes the relative importance of variables used in predictive models. Variable importance was estimated for each model by quantifying the relative improvement to model fit as a result of the inclusion of a given covariate into the model, weighted by the number of trees in which the covariate occurred (De'Ath, Reference De'Ath2007; Elith et al., Reference Elith, Leathwick and Hastie2008). These values are then scaled to sum to 100, with larger numbers corresponding to higher variable importance (Elith et al., Reference Elith, Leathwick and Hastie2008).
R code and data to reproduce the analyses is provided at https://figshare.com/s/bfcc1fd78168edebd09f.
Results
Model performance
BRT models performed well when trained on the full dataset ($\overline {\hbox{AUC}}$ = 0.90 ± 0.005; $\overline {\hbox{Accuracy}}$
 = 0.87 ± 0.005; $\overline {\hbox{TSS}}$
 = 0.64 ± 0.01), Acanthocephalans ($\overline {\hbox{AUC}}$
 = 0.89 ± 0.027; $\overline {\hbox{Accuracy}}$
 = 0.91 ± 0.021; $\overline {\hbox{TSS}}$
 = 0.69 ± 0.06), Nematodes ($\overline {\hbox{AUC}}$
 = 0.92 ± 0.006; $\overline {\hbox{Accuracy}}$
 = 0.90 ± 0.005; $\overline {\hbox{TSS}}$
 = 0.71 ± 0.02), and Platyhelminthes ($\overline {\hbox{AUC}}$
 = 0.85 ± 0.011; $\overline {\hbox{Accuracy}}$
 = 0.83 ± 0.009; $\overline {\hbox{TSS}}$
 = 0.55 ± 0.03). This would suggest that all models performed decently well at estimating out-of-sample host−helminth associations. However, when we considered the ability of the full model to estimate host−helminth associations for each helminth taxonomic subgroup, we found that helminth parasite subsets generally performed better than the full model (Table 1 and Fig. 2), except for platyhelminth parasites when model performance was estimated using AUC and TSS. This effect was sensitive to geographic scale – and subsequently the amount of data – as parasite submodels generally performed no different from full models when predicting host–helminth interactions in the USA and in the state of Texas (Fig. 2). However, with the exception of nematodes within Texas when performance was estimated using accuracy, the full model never significantly outperformed a parasite taxon-specific model at either scale (Tables S3 and S4).
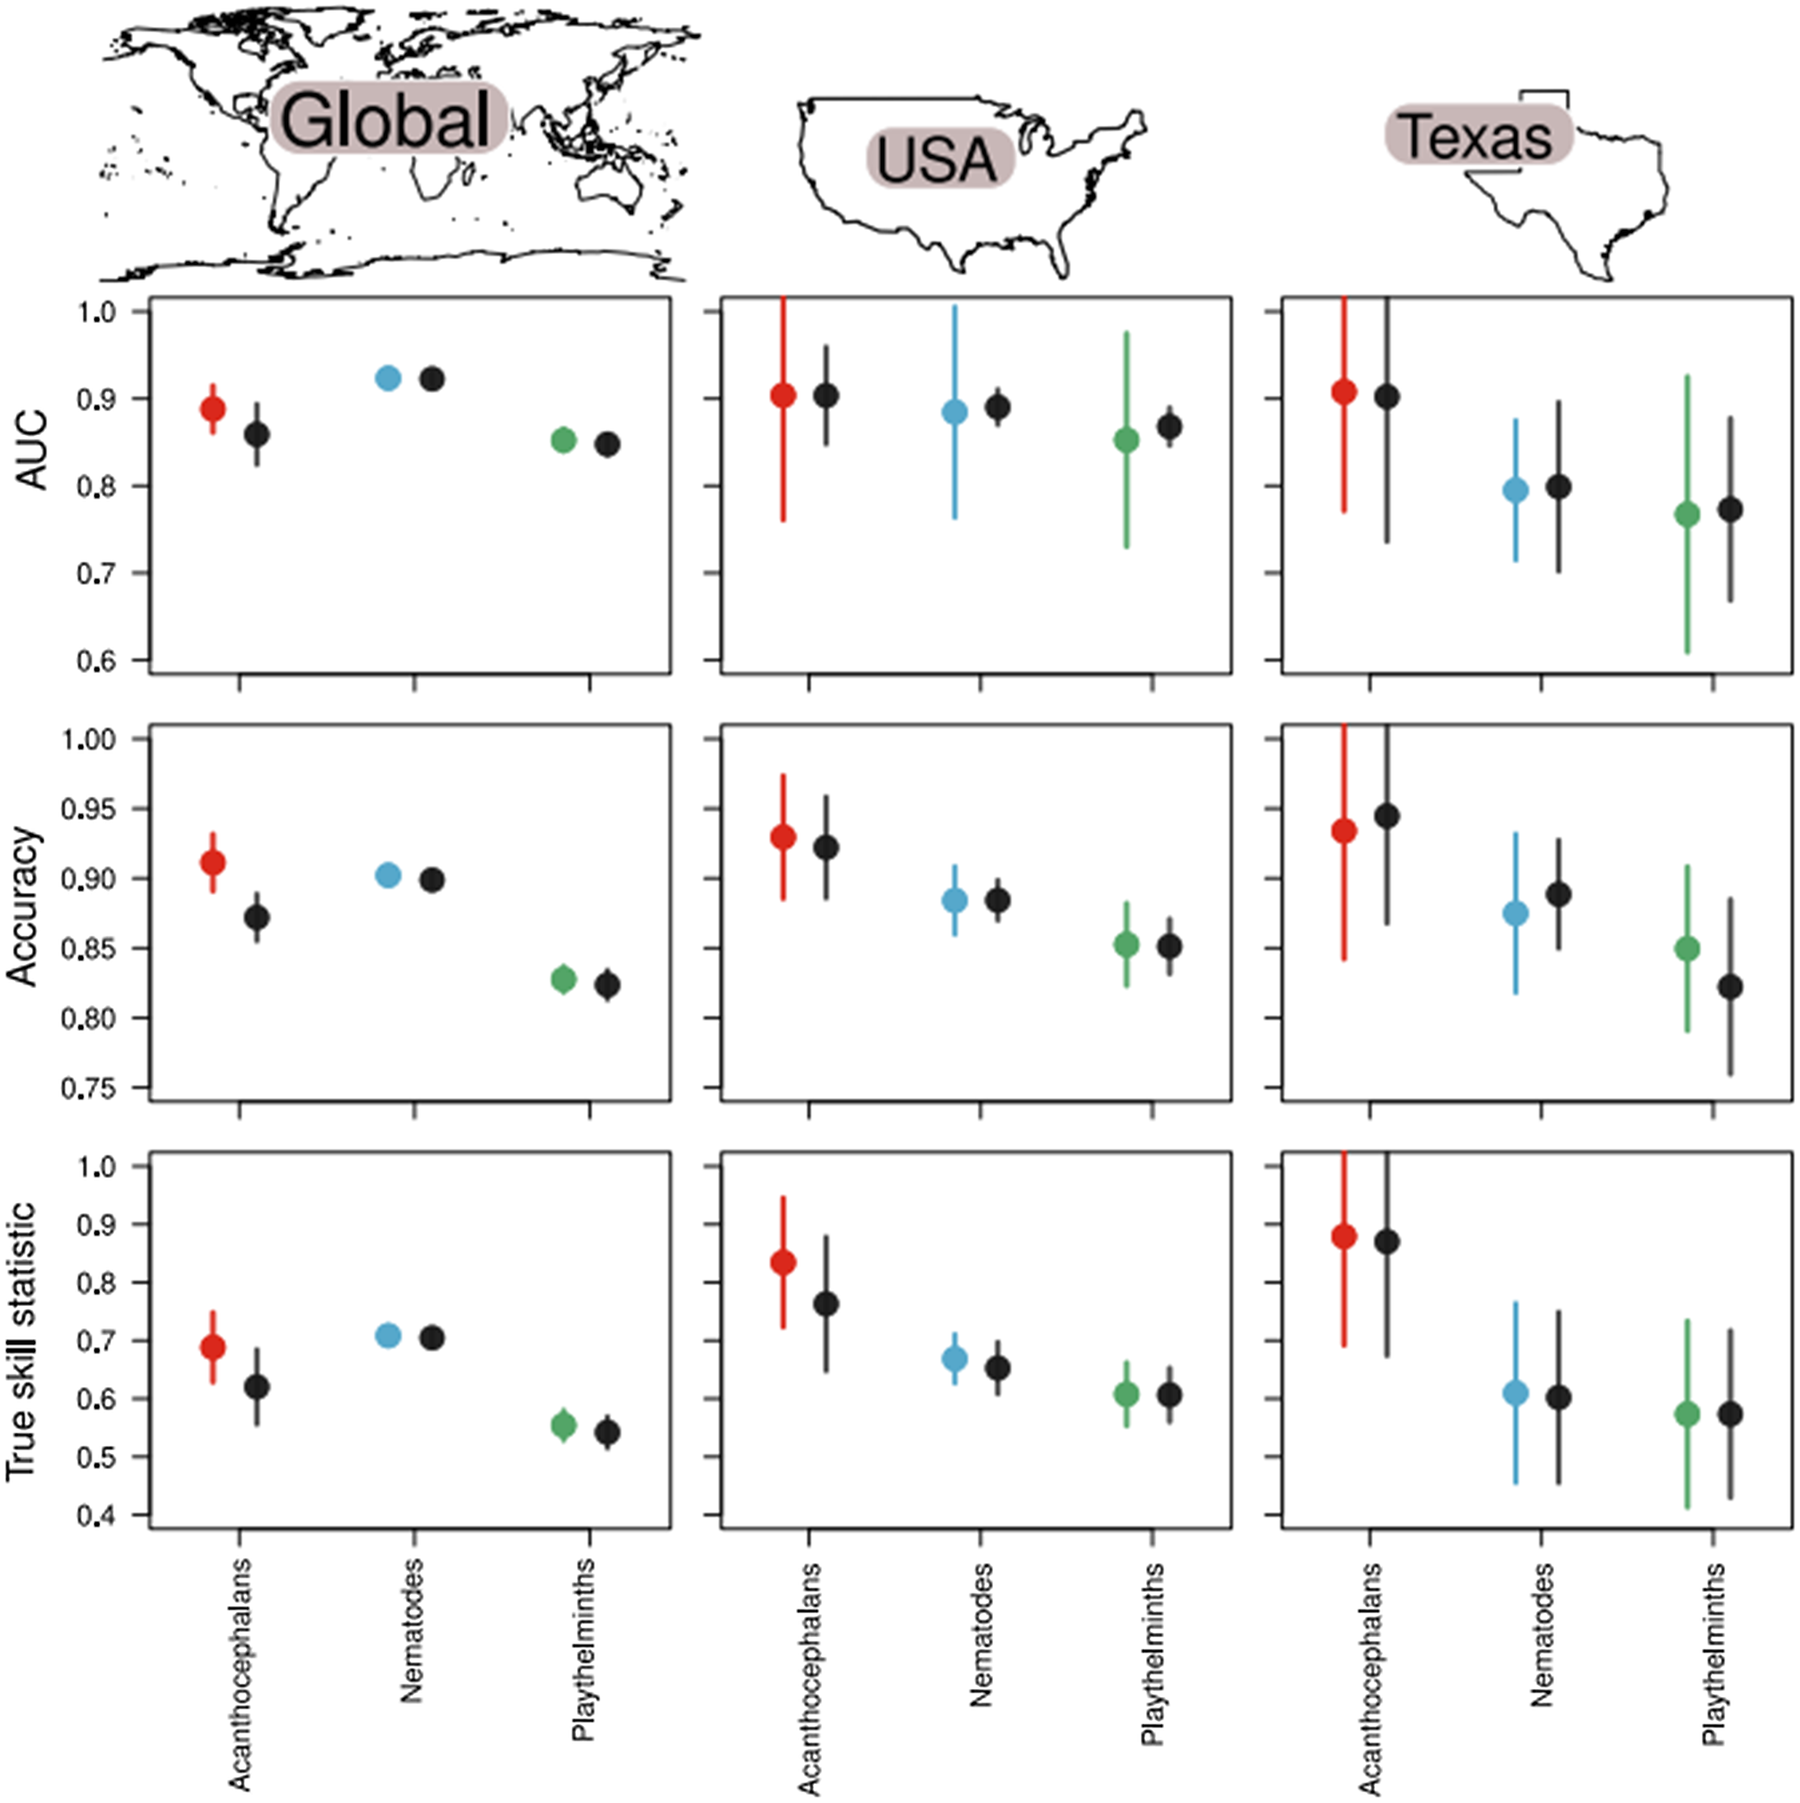
Fig. 2. The full model (black points) performed worse than each taxa-specific helminth submodel (coloured points) in terms of discrimination ability (AUC), accuracy and TSS when considering the global model (left column). Here, values closer to 1 indicate improved model performance. The relative improvement of taxa-specific models over full models declines as the geographic scale considered becomes smaller, evidenced by the models trained on host–helminth interactions from the USA (middle column) and a state within the USA (Texas; right column). This suggests that both taxonomic and geographic scale of host−parasite associations are important to consider when developing predictive models.
Table 1. Model performance – quantified using AUC, accuracy and TSS – declined when the full model was used to predict on helminth taxonomic subsets when considering the global set of interactions between hosts and helminth parasites
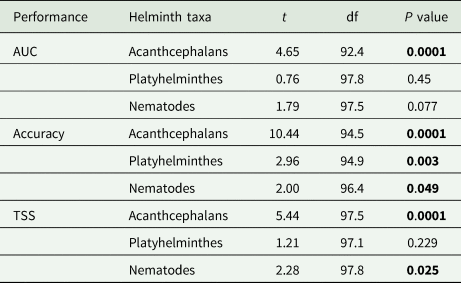
Model performance was compared to helminth group subset predictions from the full model using Welch's two-sample t-tests across the 50 trained boosted regression models. Bold P-values indicate significance assessed at α = 0.05.
Variable importance
Interestingly, the full model and taxonomic subset models tended to agree on which host and helminth parasite covariates were most important to model performance – regardless of geographic scale considered (Figs S2 and S3). We found that host family, the dominant infection site of the helminth parasite, and the maximum latitude of the host species consistently appeared in the top five predictor variables (Fig. 3a). Parasite class had relatively weaker importance across models and parasite phylum was unimportant when included in the full model ($\overline {\hbox{importance}}$ = 0.04). Ranking the host and parasite variables by their relative importance and calculating rank correlations across different models further supports the conclusion that models tended to have similar variable importance values (Fig. 3b). Further, models trained at different geographic scale found the same variables were important, based on Pearson's correlations of mean variable importance values comparing the global model to submodels of host–helminth interactions within the USA and the state of Texas (Fig. S1). Finally, the relative importance of host and helminth parasite species covariates to model performance was generally balanced across the different trained models (Fig. 3c). Similarly, although effects of predictors such as host family and dominant infection site were difficult to distinguish owing to a large number of levels, we did find that maximum latitude was a consistent indicator of host−parasite associations across models (Fig. S4).
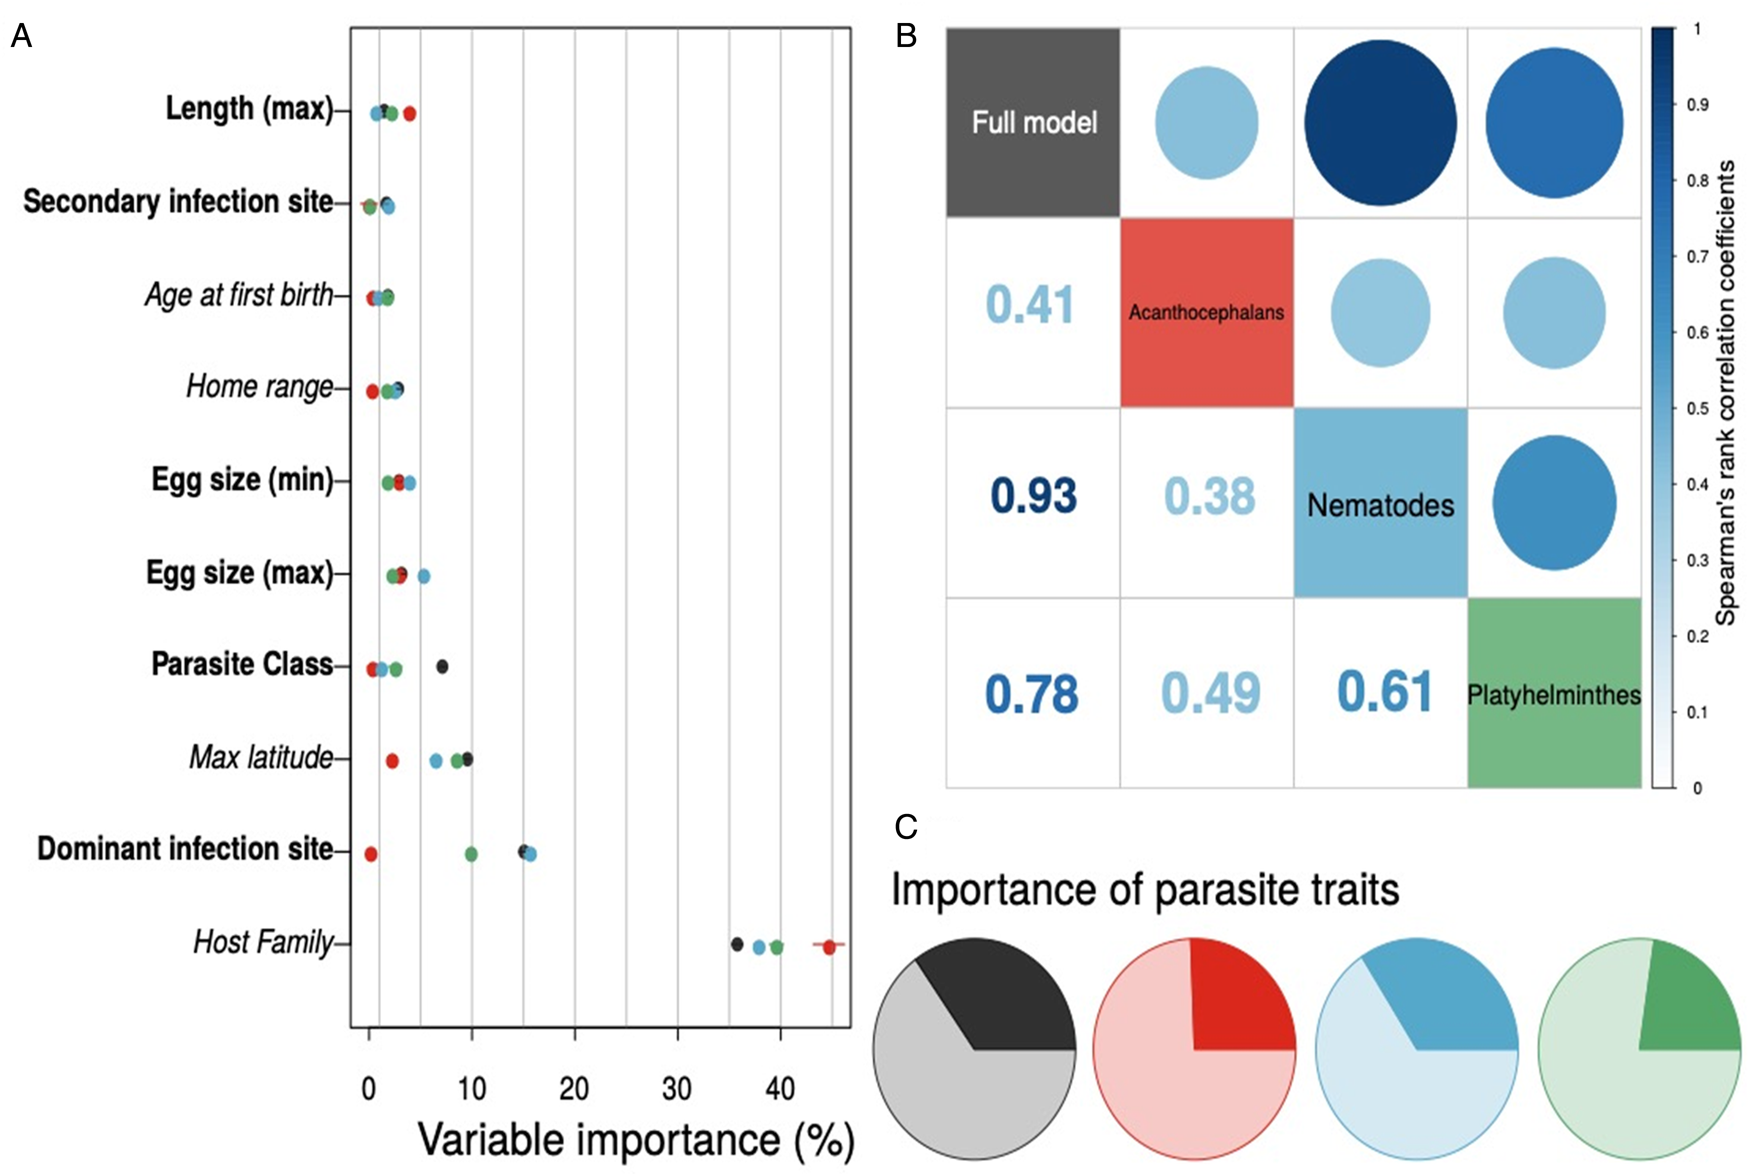
Fig. 3. Variable importance for each global host–helminth interaction model – with helminth taxonomic group denoted by point colour – tended to be conserved, with host family and the site of infection as dominant predictors across models (panel a; host variables are italicized, helminth parasite covariates are bolded; only the top 10 predictor variables are shown here). The rank order of mean variable importance tended to be positively correlated among models as well (panel b). Finally, while important variables tended to be the same across models, the relative importance of helminth parasite covariates (darker colours in the pie charts in panel c) compared to host covariates (lighter shaded regions) did show variation.
Discussion
Predictive models can help identify aspects of species that shape host−parasite associations and forecast likely interactions, yet their inference may depend upon phylogenetic scale. Here, all trained BRT models performed fairly well at estimating host−helminth associations. However, by targeting specific helminth groups, taxonomically restricted models outperformed the full model almost universally, even though this full model included parasite taxonomy (class and phylum) as predictors. This suggests that using taxonomic subsets specific to parasite groups of direct interest may lead to more accurate predictions. This is counter to the idea that including a diverse set of parasite taxa might enhance model performance by training the model on a broader range of traits and associations (Wisz et al., Reference Wisz, Hijmans, Li, Peterson, Graham, Guisan and Group2008). That is, a model might be able to detect higher-level variation in host−parasite associations, leveraging information across parasite taxa, leading to enhanced predictive performance. Interestingly, despite the sizable differences in helminth taxa in body size and life history, models trained on helminth taxonomic subsets identified many of the same important variables (Fig. 3). This suggests that the same set of host and helminth covariates were important to estimating host−parasite associations, despite the differences in the ability to rank host−helminth associations among models. Together, this suggests predictive models should attempt to encompass the phylogenetic scale desired for inference and potentially use model averaging or ensemble models to combine predictions from separately trained models.
The importance of taxonomic scale (or phylogenetic scale more generally) is increasingly acknowledged in ecology and evolution (Graham et al., Reference Graham, Storch and Machac2018; Washburne et al., Reference Washburne, Silverman, Morton, Becker, Crowley, Mukherjee, David and Plowright2019) and likely also has important implications for studies of host–parasite interactions. Our results suggest that inference about particular taxonomic groups is maximized for models trained on that particular host or parasite clade. Other related work has shown that the zoonotic potential of viruses or host species differs by the phylogenetic scale considered and, in some cases, restricting models by particular taxa can alter findings of trait-based analyses (Washburne et al., Reference Washburne, Crowley, Becker, Olival, Taylor, Munster and Plowright2018; Crowley et al., Reference Crowley, Becker, Washburne and Plowright2020). However, such analyses have not been extended to broad bipartite host−parasite associations and thus questions of host or parasite specificity. Closer attention to the phylogenetic scale could have important implications for broader models of parasite sharing. Within particular host−parasite systems, such as bacterial pathogens in rodents (Withenshaw et al., Reference Withenshaw, Devevey, Pedersen and Fenton2016) and bats (Becker et al., Reference Becker, Speer, Brown, Fenton, Washburne, Altizer, Streicker, Plowright, Chizhikov, Simmons and Volokhov2020), finer resolutions of parasite sharing (e.g. using parasite genetics) can reveal covert host specificity. Similar taxon-specific approaches to parasite sharing could assess how the centrality of host species to transmission networks varies based on particular parasite groups or more conservative parasite species resolutions.
The strong specificity and co-evolutionary relationships present in host−helminth associations may ultimately lead to taxonomic subset models outperforming a full model, which would be especially true if fine-scale parasite species life-history variation was key to determining host−parasite associations for given parasite taxa. The importance of taxonomic resolution and such life-history traits was evident through the predominance of the host family and dominant helminth infection site as key predictive covariates across helminth taxonomic subset models. Given the overall consistent finding that parasite sharing is generally restricted by phylogenetic processes (Streicker et al., Reference Streicker, Turmelle, Vonhof, Kuzmin, McCracken and Rupprecht2010; Cooper et al., Reference Cooper, Griffin, Franz, Omotayo and Nunn2012a; Albery et al., Reference Albery, Eskew, Ross and Olival2020; Shaw et al., Reference Shaw, Wang, Dylus, Meier, Pogacnik, Dessimoz and Balloux2020), taxonomic subset models may more broadly improve predictions about host–parasite interactions. In our analysis, we stratified models by helminth phyla (Acanthocephala, Nematoda and Platyhelminthes); however, other taxonomic resolutions may be desirable, especially for parasites that display finer-scale lineage or genotype variation. In general, there is no single scale at which ecological phenomena such as host–parasite interactions should be studied (Levin, Reference Levin1992), although several tools are increasingly available to identify the most important phylogenetic scales for describing such data (Washburne et al., Reference Washburne, Silverman, Morton, Becker, Crowley, Mukherjee, David and Plowright2019). Application of methods such as phylogenetic factorization can allow researchers to identify clades that best capture variation in host–parasite interactions and accordingly apply predictive models to those taxa.
While phylogenetic scale is an important consideration when enough data are available, smaller geographic scales – consisting of a subset of the global host−helminth network – may not predispose taxonomic subset models to perform better than the full model. This was evident in our analyses of host–helminth interactions at two finer geographic scales (i.e. country and state). Here, despite selecting the same host and helminth covariates in top-performing models, the difference in performance between the full model and helminth taxonomic subset models was essentially null. This still argues against the idea that more data generate a better model, which would require the full model to instead outperform the helminth group-specific models; however, full models generally did not show improved performance regardless of phylogenetic or geographic scale. Together, this finding highlights the importance of both phylogenetic and geographic scale when constructing predictive models of species interactions. Additionally, this result suggests that restricting analyses phylogenetically trades off in terms of model performance by reducing the amount of available data.
Although host family and parasite infection site were key predictors across both full and taxonomic subset models, we also identified a host's maximum latitude as a general predictive variable. The effects of this covariate were largely consistent across models (Fig. S4), with a greater likelihood of host−parasite association at higher latitudes. This pattern supports previously observed latitudinal gradients in parasite richness further from the equator (Lindenfors et al., Reference Lindenfors, Nunn, Jones, Cunningham, Sechrest and Gittleman2007) or could reflect geographic biases in sampling (Dallas et al., Reference Dallas, Aguirre, Budischak, Carlson, Ezenwa, Han, Huang and Stephens2018). Alternatively, greater likelihood of host−parasite association could represent possibly weaker resistance of hosts to infection at more extreme geographic range margins (Becker et al., Reference Becker, Nachtmann, Argibay, Botto, Escalera-Zamudio, Carrera, Tello, Winiarski, Greenwood, Méndez-Ojeda, Loza-Rubio, Lavergne, de Thoisy, Czirják, Plowright, Altizer and Streicker2019), thereby facilitating parasite establishment (Briers, Reference Briers2003).
While the LNHM's helminth data represent one of the most extensive host−parasite databases to date, especially considering the taxonomic scope of the parasites considered (Gibson et al., Reference Gibson, Bray and Harris2005; Dallas et al., Reference Dallas, Aguirre, Budischak, Carlson, Ezenwa, Han, Huang and Stephens2018), it is important to acknowledge that the recorded interactions between host and helminth parasite are not exhaustive. Host species that are more abundant, more conspicuous, or easier to sample may be over-represented in the host−helminth association data (Carlson et al., Reference Carlson, Dallas, Alexander, Phelan and Phillips2020). If this differential sampling is associated with host taxonomy, this bias could inflate the importance of host taxonomy in estimating host−helminth associations. However, it is difficult to imagine a situation where this would lead to the full model consistently performing worse than models on taxonomic subsets of parasites.
Our finding on the importance of taxonomic resolution may extend to models aimed at estimating associations between species more broadly. For instance, if the importance of phylogenetic scale translates to other systems, then the understanding and prediction of plant-pollinator, consumer-resource and site–species interactions may all be affected by taxonomic resolution. One interesting outcome of this is that training models on particular subsets of interactors in these networks may improve model performance. With the increased availability of data on species interactions, it may be tempting to include all data on species interactions in a model, under the idea that more information will improve the model's ability to discriminate (van Proosdij et al., Reference van Proosdij, Sosef, Wieringa and Raes2016). Similar ideas are developing in species distribution modeling, where joint species distribution models use community-scale data to forecast species distributions by leveraging information on species shared environmental responses. However, the appropriate scale at which to subset species or habitats to enhance model predictive performance is presently unknown but a pressing research need.
Supplementary material
The supplementary material for this article can be found at https://doi.org/10.1017/S0031182020002371
Data
R code is available on figshare at https://figshare.com/s/bfcc1fd78168edebd09f.
Author contributions
TAD performed the analysis. All authors contributed to manuscript writing.
Financial support
This work was performed under the Project HPC-EUROPA3 (INFRAIA-2016-1-730897), with support of the EC Research Innovation Action under the H2020 Programme; in particular, the authors gratefully acknowledge the support of the Barcelona Supercomputing Centre. This work was also supported by funding to the Viral Emergence Research Initiative (VERENA) consortium including NSF BII 2021909. Lastly, the Macroecology of Infectious Disease Research Coordination Network (funded by NSF/NIH/USDA DEB 131223) provided useful discussions and support for this study.
Conflict of interest
The authors have no conflicts of interest to declare.
Ethical standards
Not applicable.


