


Introduction
Cyclosporiasis is a foodborne diarrheal disease caused by the human intestinal pathogen Cyclospora cayetanensis. Although the parasite is endemic to tropical and sub-tropical regions, seasonal outbreaks of cyclosporiasis often occur in developed temperate countries such as the USA and Canada. In the past, outbreaks occurring in the USA and Canada have been associated with imported fresh produce items including berries, herbs, vegetables and salads, imported from endemic countries (Ortega and Sanchez, Reference Ortega and Sanchez2010; Abanyie et al., Reference Abanyie, Harvey, Harris, Wiegand, Gaul, Desvignes-Kendrick, Irvin, Williams, Hall, Herwaldt, Gray, Qvarnstrom, Wise, Cantu, Cantey, Bosch, AJ, Fields, Bishop, Wellman, Beal, Wilson, Fiore, Tauxe, Lance, Slutsker and Parise2015; Sim et al., Reference Sim, Won, Kim, Kim, Park and Yu2017; Whitfield et al., Reference Whitfield, Johnson, Hanson and Huneault2017). Difficulties are often encountered in identifying vehicles of C. cayetanensis infection in the USA, as many cases are geographically dispersed and seemingly sporadic. Cases that result from a single imported food source may lack a common source of exposure (e.g. a single restaurant or event), and thus not be readily epidemiologically linked. Additionally, detecting the parasite on or in implicated food items has rarely been successful. Due to these challenges, the development of molecular typing tools for C. cayetanensis is a major priority for US public health agencies (Hall et al., Reference Hall, Jones and Herwaldt2011; Abanyie et al., Reference Abanyie, Harvey, Harris, Wiegand, Gaul, Desvignes-Kendrick, Irvin, Williams, Hall, Herwaldt, Gray, Qvarnstrom, Wise, Cantu, Cantey, Bosch, AJ, Fields, Bishop, Wellman, Beal, Wilson, Fiore, Tauxe, Lance, Slutsker and Parise2015).
Whole genome sequencing (WGS) is a routine practice for supporting epidemiological investigations of outbreaks caused by bacterial pathogens in some public health settings (Kwong et al., Reference Kwong, Mercoulia, Tomita, Easton, Li, Bulach, Stinear, Seemann and Howden2016; Quainoo et al., Reference Quainoo, Coolen, van Hijum, Huynen, Melchers, van Schaik and Wertheim2017; Brown et al., Reference Brown, Chen, Watkins, Campbell, Folster, Tate, Wasilenko, Van Tubbergen and Friedman2018) [e.g. PulseNet (CDC, 2017c)]. These investigations involve examination of whole genome SNP profiles that distinguish related and unrelated isolates, facilitating linkage to a common source or exposure event (Kanagarajah et al., Reference Kanagarajah, Waldram, Dolan, Jenkins, Ashton, Carrion Martin, Davies, Frost, Dallman, De Pinna, Hawker, Grant and Elson2018). This procedure is made feasible for routine applications by the comparatively small genome size of many bacterial pathogens, i.e. from ~3–6 megabases (MB), and the ability to culture them directly from clinical specimens enabling enrichment of their genetic material. By comparison, the C. cayetanensis genome is approximately 10-fold larger [~44 MB (Qvarnstrom et al., Reference Qvarnstrom, Wei-Pridgeon, Li, Nascimento, Bishop, Herwaldt, Moss, Nayak, Srinivasamoorthy, Sheth and Arrowood2015)], and methods for its cultivation have not been described. Fewer than 105 parasites are typically present in diagnostic human fecal specimens yielding only picogram amounts of C. cayetanensis DNA (Nascimento et al., Reference Nascimento, Wei-Pridgeon, Arrowood, Moss, da Silva, Talundzic and Qvarnstrom2016). Therefore, parasite enrichment is required prior to DNA extraction and genome sequencing. Humans are the only known host of C. cayetanensis and previous attempts to develop animal models of cyclosporiasis have failed (Eberhard et al., Reference Eberhard, Ortega, Hanes, Nace, Do, Robl, Won, Gavidia, Sass, Mansfield, Gozalo, Griffiths, Gilman, Sterling and Arrowood2000). As a result, animal bioassay is not a viable approach for C. cayetanensis enrichment even if the high costs and time associated with such an undertaking were of no consequence in a routine setting. Due to these obstacles, multi-locus sequence typing (MLST) is currently the most feasible option for C. cayetanensis genotyping. However, given the genetic heterogeneity of C. cayetanensis infections, analysis of an MLST dataset generated for this pathogen requires the use of specialized analysis methods or indices that can accommodate this complexity.
While there is an increasing need for robust C. cayetanensis typing tools, the genetic complexity of C. cayetanensis infections has been a challenge for their development. Stool specimens from cyclosporiasis patients may contain one, two or more sequence types for a given locus depending on the locus sequenced. These datasets become increasingly complex as additional loci are examined and the number of permutations increases. This confounds phylogenetic inference as a means of assisting epidemiological case-linkage. The field of molecular epidemiology establishes that pathogens linked to a common source are usually genetically related. While this appears to be the case for C. cayetanensis, due to sexual re-assortment of this pathogens' genome within the gastrointestinal tract of its human host, no two infections are completely alike. This same phenomenon is not encountered in asexually reproducing prokaryotes and viruses that typically present as clonal populations in outbreak scenarios (Tibayrenc and Ayala, Reference Tibayrenc and Ayala2012), a feature exquisitely suited to trace-back and case-linkage investigations aided by phylogenetic approaches (Romero-Severson et al., Reference Romero-Severson, Bulla and Leitner2016).
In the field of population genetics, fixation indices (F statistics) such as F ST are commonly used to define the genetic structure of sexually reproducing populations (Nagylaki, Reference Nagylaki1998). This index is based largely on haplotype frequencies and is considered a useful indicator of population differentiation. F ST has been applied to population studies of various apicomplexan parasites (Feng et al., Reference Feng, Torres, Li, Wang, Bowman and Xiao2013; Lumkul et al., Reference Lumkul, Sawaswong, Simpalipan, Kaewthamasorn, Harnyuttanakorn and Pattaradilokrat2018; Muwanika et al., Reference Muwanika, Kabi and Masembe2016) and is used as a measure of distance, enabling comparison of populations in a pairwise fashion where the larger the F ST value, the more genetically isolated the two populations are. In the context of epidemiological case linkage, the F ST statistic is not always applicable as it requires that the populations undergoing comparison are already defined by a tangible characteristic such as their geographical distribution. While it is not inconceivable that an index based on haplotype frequency might possess utility for assisting epidemiological case-linkage, information on how the test populations are to be defined are often absent or unclear in the context of US cyclosporiasis outbreaks. As such, indices like F ST cannot be used directly. Another drawback of using fixation indices in this context is that their accuracy relies on the allele frequencies in a population. F ST assesses whether two populations possess an expected amount of heterozygosity or if there is a reduction in heterozygosity based on the Hardy–Weinberg expectation (Crow, Reference Crow1988). Because a single C. cayetanensis infection represents a sexually reproducing population of its own, and given that these infections may involve one, two, three or more sequence types at various loci, the true frequency of alleles (or sequence types) cannot be determined from a standard MLST dataset, yet these frequencies are required for calculation of true Hardy–Weinberg proportions.
Bioinformatic approaches that support the analysis of complex C. cayetanensis MLST datasets must account for these limitations, yet provide a robust estimation of the most plausible genetic relationships. Additionally, given the unique challenges discussed above, the development of novel methods for the analysis of this data is warranted. We describe an ensemble of two similarity-based algorithms including a Bayesian and heuristic component, for inferring genetic relationships between C. cayetanensis infections. As input, the ensemble requires a set of haplotypes from each specimen enriched by PCR and then Sanger sequenced. The algorithms' design includes aspects of Mendelian genetics, information theory, frequentist probabilities, and Bayesian probabilities, and it generates a set of pairwise distances that reflect the most plausible relationships between the specimens in the study cohort. These distances are then clustered for downstream interpretation.
To assess the performance of our approach we selected three C. cayetanensis genotyping markers, including two nuclear loci and one mitochondrial locus and Sanger sequenced them from 88 human fecal specimens containing C. cayetanensis. This dataset included 30 specimens from people whose infections had been epidemiologically linked to US outbreaks of cyclosporiasis. Specimens from geographically and temporally diverse cases of cyclosporiasis were also analysed, including one specimen from China that served as an outlier for delineating clusters. Manual examination of the haplotype composition of specimens that were linked using the ensemble confirmed that the distances generated result in the assignment of plausible genetic linkages. On comparing the links assigned using epidemiological methods to those assigned using our method, the concordance between the two approaches was statistically significant, suggesting the utility of this approach for assisting epidemiological trace-back and case-linkage investigations of cyclosporiasis.
Materials and methods
Epidemiologic investigations and classification
Fecal specimens were categorized as either associated with outbreaks or as seemingly sporadic cases of cyclosporiasis identified in the USA or in other countries. The categorization of specimens as associated with a US outbreak was based on linkages established using current epidemiological approaches including, but not limited to, investigation of temporospatial links, shared exposures to stores or restaurants, distribution supply chains, and food production facilities (CDC, 2017a, 2017b). Outbreaks were defined as at least two epidemiologically linked cases (e.g. a cluster of cyclosporiasis cases linked to a restaurant, supplier, store and/or event). A temporospatial cluster was defined as cases occurring in the same geographical area (e.g. in the same community or town) where illness onset dates fell within approximately 15 days of each other. Epidemiologic evidence for linking cases in persons with common exposures (e.g. restaurant, grocery store, and/or social events) is typically stronger than for temporospatial clusters. An international travel-associated case was defined as a case in a person who spent at least 1 day during their pertinent incubation period (i.e. 14 days before illness onset) outside of the USA.
DNA extraction from feces and genome sequencing
Fecal specimens were washed free of preservative where necessary, first by centrifugation in a Sorvall Legend Micro 17R centrifuge at maximum speed (13 300 RPM) and then decanting the supernatant. Approximately 500 µL of PBS was added to each fecal specimen with agitation, until a thick slurry was formed. The Universal Nucleic Acid Extraction (UNEX) method described by Shields et al. (Shields et al., Reference Shields, Joo, Kim and Murphy2013) was followed with the adjustments described by Qvarnstrom et al. (Reference Qvarnstrom, Benedict, Marcet, Wiegand, Herwaldt and da Silva2017). As an internal control for this workflow, repeat fecal specimens (N = 3) from each of two cyclosporiasis patients (patients A and B), were extracted alongside batches of other specimens for downstream typing. Extractions were performed on 88 human fecal specimens. To identify genotyping markers, 11 of these 88 human fecal specimens were selected for genome sequencing using methods previously described (Qvarnstrom et al., Reference Qvarnstrom, Wei-Pridgeon, Van Roey, Park, Srinivasamoorthy, Nascimento, Moss, Talundzic and Arrowood2018). These 11 specimens came from patients representing temporally and geographically diverse cases of cyclosporiasis (Table 1), and were selected for WGS due to the presence of relatively high numbers of oocysts (estimated by microscopy), which is a prerequisite for successful WGS. Extraction of DNA from purified C. cayetanensis oocysts and preparation for WGS using the Ovation Ultralow Library System (NuGEN Technologies Inc., CA, USA) was performed as previously described (Nascimento et al., Reference Nascimento, Wei-Pridgeon, Arrowood, Moss, da Silva, Talundzic and Qvarnstrom2016; Qvarnstrom et al., Reference Qvarnstrom, Wei-Pridgeon, Van Roey, Park, Srinivasamoorthy, Nascimento, Moss, Talundzic and Arrowood2018). The resulting libraries were sequenced using the MiSeq Reagent Kit v2 (500 cycles) on the Illumina MiSeq system.
Table 1. Primers designed for PCR enrichment of the selected typing markers

a The number of variable sites present after trimming of sequences to equal lengths.
b After trimming sequences to equal lengths.
Marker selection and polymerase chain reaction
A detailed description of the workflow designed for selecting suitable MLST markers is shown in Fig. 1. Once candidate markers were identified, the possibility that multiple copies of these loci (i.e. multiple paralogues) exist within the haploid C. cayetanensis genome was excluded by examination of the draft genomes generated here using BLAST and discontiguous BLAST searches, with the candidate MLST loci used as query sequences. Ruling out multiple paralogues in the haploid genome would ensure that if mixed Sanger chromatograms were encountered, they would indicate the presence of multiple haploid genomes in the specimen that possess different haplotypes (i.e. true heterozygosity) as opposed to the presence of multiple paralogues that differ slightly in sequence occurring in the same haploid genome. PCR primers were designed to amplify three SNP-dense loci identified using this workflow, which included two nuclear (Nu) loci and one mitochondrial (Mt) locus (Table 1). The Mt locus was amplified using reagents provided in the HotStarTaq Master Mix Kit (Qiagen, Hilden, Germany). Amplification was performed with an initial melt at 95 °C for 15 min, followed by 35 cycles of 94 °C for 30 s, annealing at 55 °C for 30 s; and extension at 72 °C for 45 s, concluding with a final extension step of 72 °C for 10 min and holding at 4 °C. Each nuclear locus was amplified using reagents accompanying the Q5 High-Fidelity DNA Polymerase (New England BioLabs, Ipswich, MA, USA). For the 360i2 locus, amplification was performed with an initial melt of 98 °C for 2 min, followed by 35 cycles of 98 °C for 15 s; 67 °C for 30 s and 72 °C for 45 s. This was followed by a final extension step of 72 °C for 5 min and holding at 4 °C. For the 378 locus, amplification was performed with an initial melt of 98 °C for 2 min, followed by 35 cycles of 98 °C for 15 s; 71 °C for 30 s and 65 °C for 45 s. This was followed by a final extension step of 65 °C for 5 min and holding at 4 °C. All reactions contained 10 picomoles of forward and reverse primer and 1 µL of template DNA, in a total reaction volume of 25 µL. Amplicons were subjected to agarose gel electrophoresis on 1.5% gels, followed by staining with ethidium bromide for visualization under UV light.
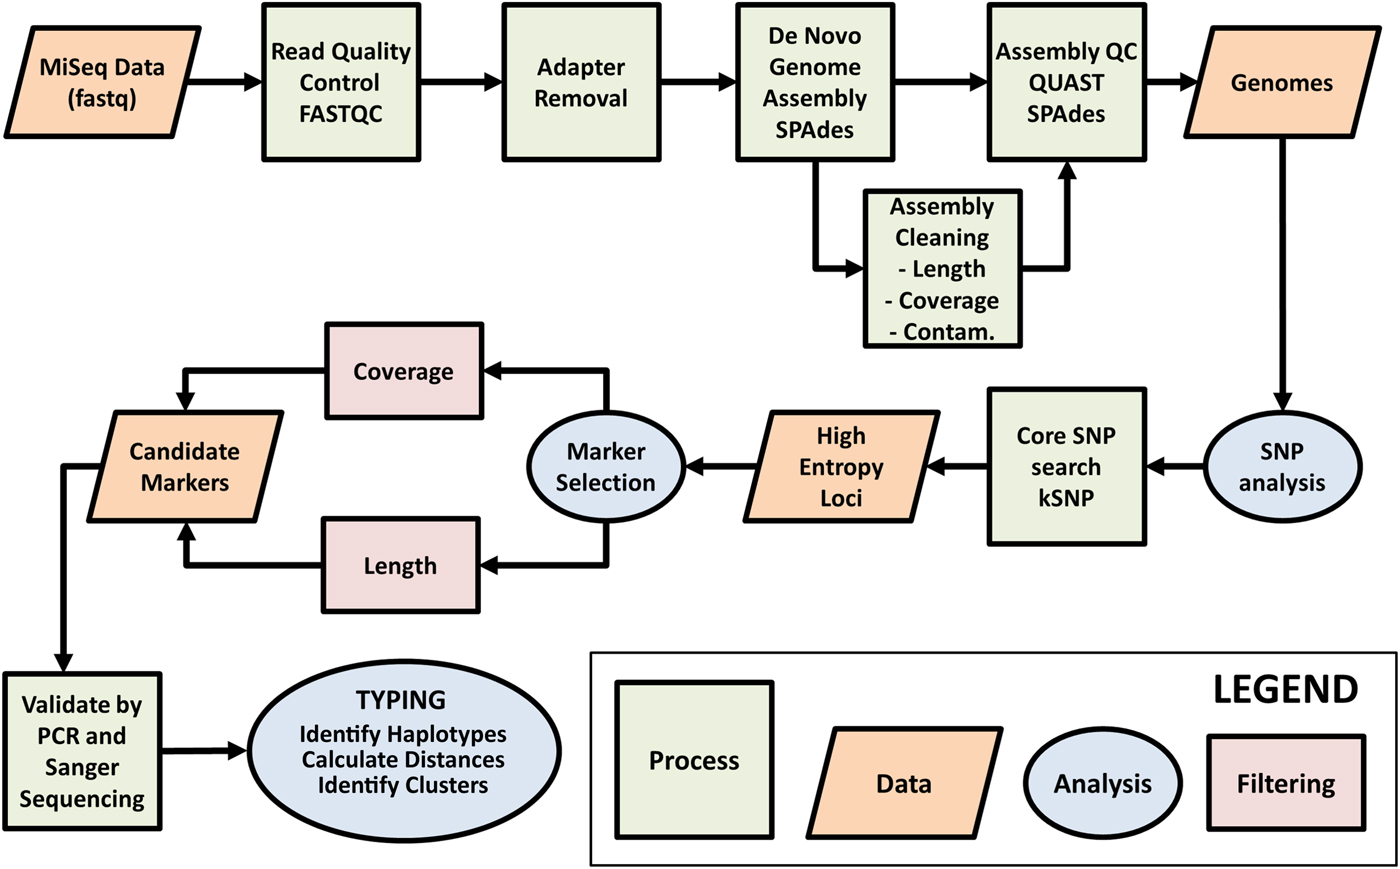
Fig. 1. Workflow for selection of Cyclospora cayetanensis typing markers. Raw genome sequence data generated on the Illumina MiSeq platform were assessed for quality using FASTQC. AdaptorRemoval v2.1.7 (Schubert et al., Reference Schubert, Lindgreen and Orlando2016) was used to remove adaptor sequences from reads and to merge overlapping paired reads into consensus sequences. SPAades v3.9.0 (Bankevich et al., Reference Bankevich, Nurk, Antipov, Gurevich, Dvorkin, Kulikov, Lesin, Nikolenko, Pham, Prjibelski, Pyshkin, Sirotkin, Vyahhi, Tesler, Alekseyev and Pevzner2012) was used to de novo assemble the reads. During the assembly cleaning process, contigs derived from contaminating (Contam.) prokaryotic human gut flora were removed using BBMap (http://sourceforge.net/projects/bbmap/). The assemblies were assessed for quality using QUAST v4.3 (Gurevich et al., Reference Gurevich, Saveliev, Vyahhi and Tesler2013) before and after the cleaning phase. Contigs with 60 times coverage, greater than or equal to 3000 base pairs (bp) long and with coding regions identified using GeneMark-ES v4.33 (Borodovsky and Lomsadze, Reference Borodovsky and Lomsadze2011), were retained as part of the core genome. Single nucleotide polymorphisms (SNPs) were detected across the core genome assemblies using kSNP v3.021 (Gardner et al., Reference Gardner, Slezak and Hall2015) and this information was used to identify high-entropy genomic loci. Genomic regions containing high confidence SNPs (i.e. those SNPs within genomic regions of the highest coverage) occurring within SNP-dense regions (i.e. where several informative SNPs exist within a genomic region of less than 1 kilobase pair in size), were identified as candidate typing markers for validation by PCR amplification and Sanger sequencing. The markers with the highest amplification and sequencing success rate were considered ideal candidates for C. cayetanensis typing, and were PCR amplified and sequenced from stool specimens provided by a diverse range of patients. The resulting sequences were then subjected to typing.
Sanger sequencing
The PCR products were purified using a Monarch® PCR & DNA Cleanup Kit (New England BioLabs, Ipswich, MA, USA) and sequenced using the BigDye Terminator V3.1 Cycle Sequencing Kit (Applied Biosystems, Foster City, CA, USA). The DyeEx 2.0 Spin Kit (Qiagen, Hilden, Germany) was used to remove the unincorporated dyes (Qiagen, Hilden, Germany). All PCR products were sequenced in both directions on an ABI PRISM® 3100 Genetic Analyzer (Applied Biosystems, Foster City, CA, USA). The ABI files were imported into Geneious v10 (Kearse et al., Reference Kearse, Moir, Wilson, Stones-Havas, Cheung, Sturrock, Buxton, Cooper, Markowitz, Duran, Thierer, Ashton, Meintjes and Drummond2012) for quality trimming, generation of consensus sequences, and sequence alignments. Heterozygous sequences were identified with the aid of the Geneious Heterozygote Plugin (Version: 1.5.1), using a peak similarity threshold of 25% followed by confirmation by manual inspection. Finished sequences were aligned and exported in .fasta format for downstream analysis. Heterozygous sequences were unphased using the PHASE algorithm in DnaSP v6.10.01, with default parameters (Rozas et al., Reference Rozas, Ferrer-Mata, Sanchez-DelBarrio, Guirao-Rico, Librado, Ramos-Onsins and Sanchez-Gracia2017). Sequences containing more than two haplotypes were identified when automatic unphasing indicated that certain specimens shared no genetic relationship with any other specimen in the dataset. Because this was considered highly unlikely, their chromatograms and consensus sequences were re-inspected and unphased manually where necessary, to identify the underlying haplotypes.
Algorithms and clustering
Detailed descriptions of the Bayesian and heuristic similarity-based classification algorithms underpinning the ensemble are provided in Supplemental File S1. The heuristic algorithm is of novel design while the Bayesian algorithm was modified from a previously described algorithm for comparison of multi-clonal Plasmodium falciparum infections (Plucinski et al., Reference Plucinski, Morton, Bushman, Dimbu and Udhayakumar2015). Pairwise distances were calculated using both algorithms, the values were normalized, and the mean of these two datasets was taken. The distances were clustered using agglomerative nesting (AGNES), executed in the R package ‘cluster’, version 2.0.6 (Maechler, Reference Maechler2011). AGNES was performed using Manhattan distances and the Ward clustering method (Strauss and von Maltitz, Reference Strauss and von Maltitz2017) with all other parameters set to default. The ‘as.hclust’ function was used to convert the ‘agnes’ object into a ‘hclust’ object, and the ‘as.phylo’ function (part of the ‘ape’ R package) was used to convert this into a ‘phylo’ object. This ‘phylo’ object was visualized as a circular cluster dendrogram using the R package ‘ggtree’ (Yu et al., Reference Yu, Tsan-Yuk Lam, Zhu and Guan2018). A specimen from China was used as an outlier for delineating clusters as it possessed a mitochondrial haplotype not detected in any other specimen as well as a rare nuclear haplotype observed only in one other specimen (Supplemental File S2). To assess the concordance between the epidemiologically assigned links and those assigned using the ensemble, the probability that any identified associations arose by random chance was determined. Briefly, the probability (P) value was calculated using a binomial distribution, the null probability that any two random specimens in the dataset will be linked using our method and, the total number of specimens with epidemiologically defined links (Supplemental File S1).
Results
Polymerase chain reaction and sequence analysis
Three SNP-rich loci were selected; one Mt locus designated as MSR and two Nu loci designated as 360i2 and 378, with amplicon sizes less than 1 kilobase pair (kb) and capturing between four and twenty SNPs (Table 1). The amplification and sequencing success rate for each of the three loci was greater than 90%. The success rate of sequencing all three loci for a given specimen was 74/88 (84%). The Mt MSR locus was the least diverse with five haplotypes detected. The Nu 378 locus was the most diverse and possessed the most intra-specimen heterozygosity, with ten haplotypes identified. Seven haplotypes were detected for the Nu 360i2 locus. The existence of several homozygous specimens for the Nu 360i2 and Nu 378 loci facilitated accurate unphasing of heterozygous specimens into two distinct haplotypes in most cases. Five specimens possessed a mixture of three confirmed Nu 378 haplotypes, one specimen contained a mixture of four Nu 378 haplotypes, and one specimen contained two Mt MSR haplotypes (Supplementary File S2). The sequencing results supported that the nuclear loci examined exist as one copy in the haploid C. cayetanensis genome as BLAST searches against these genomes had originally suggested. For example, at the 360i2 locus, specimens were identified that were homozygous for haplotypes 1, 2, 3, 4, 6 and 7, while nearly all other specimens had different combinations of these. Approximately 20% (17 out of 87) of specimens sequenced at the 360i2 locus were homozygous, supporting that the heterozygosity observed in some chromatograms was due to the presence of different haploid genome copies in the specimen possessing different haplotypes. For the 378 locus, homozygous specimens were found for haplotypes 2, 3, 4 and 7 representing approximately 8% of the specimens (six out of 80) that were sequenced at this locus. This data supports our original BLAST analysis of the C. cayetanensis genomes generated here, indicating that the 360i2 and 378 loci exist as one copy in each haploid genome.
Assignment of specimens to clusters using the ensemble
The 88 specimens genotyped in this study were divided into 16 genetic clusters using the ensemble (Fig. 2), with a cut-off assigned at the node where the Chinese specimen split from its nearest neighbour (two specimens from Texas). To assess the performance of the ensemble in terms of the plausibility of its cluster assignments the 88 genotypes were represented as a barcode (Fig. 3). Manual examination of the barcodes within each cluster indicated that the ensemble assigned rational distances based on the haplotype composition of each specimen (Fig. 3). Some of the 88 specimens had an incomplete genotype due to amplification and or sequencing failures (Table 1, Fig. 2). However, the algorithms underlying the ensemble were designed to accommodate incomplete datasets allowing all specimens to be assigned to a cluster. For instance, multiple attempts at PCR amplification of the Nu 378 locus failed for one of three repeat specimens from patient B yet this incompletely typed specimen was still linked to the other specimens from this patient using our method. The parasites within repeat fecal specimens from patients A and B were consistently assigned to the same respective clusters (Fig. 2), suggesting that cross-contamination between specimens was absent.
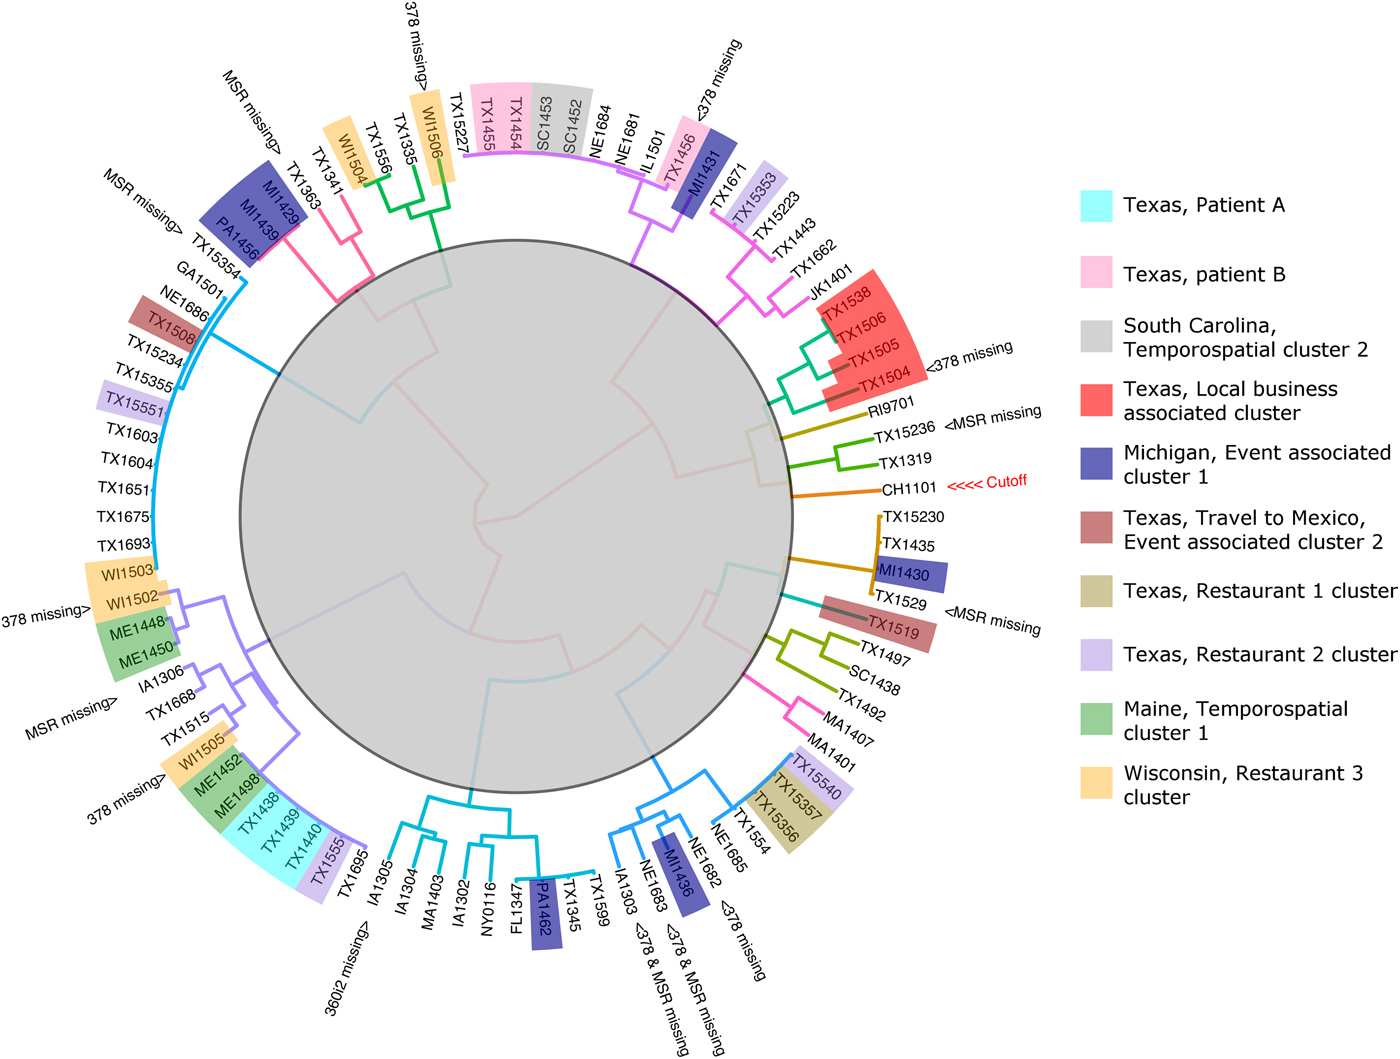
Fig. 2. Cluster dendrogram generated from the Ensemble Distance Matrix. Our ensemble of two similarity-based classification algorithms resolved the C. cayetanensis infections from 88 fecal specimens into sixteen clusters (different branch colours). Clusters were delineated by cutting the tree at the node indicating the separation of the Chinese sample (CHN_HEN01) from its nearest neighbour. The specimen names are shaded in colours according to their epidemiological linkage. Unshaded specimen names represent sporadic or unlinked cases of cyclosporiasis. Specimen identity codes begin with a two letter state abbreviation (except for Jakarta, Indonesia; JK), followed by two numbers indicating the year, and ending a unique identifier assigned to that specimen (2–3 digits). The specimen from China (CHN_HEN01) follows a different naming convention as sequence data from this specimen had been submitted to GenBank previously by different investigators (GenBank accession: NW_019211453).

Fig. 3. The haplotype composition of each specimen genotyped in this study represented as a barcode. The 88 specimens in the study cohort were assigned to 16 distinct clusters by the ensemble, with cluster assignments shown on the right hand side of each panel. These cluster assignments were made based on the haplotype composition of each sample, with the loci and their respective haplotype numbers shown along the two top rows. Boxes are shaded black if the corresponding haplotype was detected in a specimen. Specimen names are listed in the far left column of each panel. Rows are shaded grey if sequencing was unsuccessful for a given marker. This figure was generated to graphically represent the groupings assigned by the ensemble when presented with a set of complex genotyping data.
Concordance of genetic clustering and epidemiological data
Nineteen instances occurred where any two specimens linked using the ensemble were also linked using epidemiological methods. The probability that these 19 concordant links arose by random chance was extremely low (P < 0.0001). Additionally, given that repeat specimens from patients A and B shared a common source (i.e. they caused the same infections), the ensemble assigned 25 concordant linkages and the probability that these associations arose randomly was also low (raw P = 3.9 × 10⁻¹³). When the links assigned using the Bayesian and heuristic algorithms underpinning the ensemble were examined individually (repeat specimens from patients A and B considered), their concordance with the epidemiology was also unlikely to have arisen randomly (heuristic P = 2.3 × 10⁻¹⁰, Bayesian P = 2.7 × 10⁻⁸). However, the P value obtained using the ensemble was the lowest.
For four of the eight epidemiologically defined outbreak clusters, the ensemble-assigned links were fully corroborated by the epidemiological data. This included four cyclosporiasis cases linked to a local business in Texas (Fig. 2, red). Sequencing failed at the 378 locus for one of these specimens yet the ensemble still linked this specimen to the other three. Four cyclosporiasis cases were linked to the Maine temporospatial cluster (Fig. 2, green) and the ensemble-assigned links were also fully concordant. The cyclosporiasis patients associated with this epidemiological cluster came from neighbouring counties of residence and their onset of illness fell within 13 days. These patients had each purchased the same produce item at one of two grocery store chains. The two cyclosporiasis patients linked to Texas restaurant-associated cluster 1 (Fig. 2, gold) were also linked by the ensemble. The two patients fell ill 1 day apart and both had dined at the same restaurant. The ensemble also linked two cyclosporiasis cases from South Carolina associated with a temporospatial outbreak cluster (Fig. 2, grey). These patients shared the same county of residence and their illness onset dates fell within 7 days of each other. In all of these cases, manual examination of the specimens respective barcodes (Fig. 3) supported that the links assigned were rationally based on the haplotype composition of the specimens.
For two of the eight epidemiologically-defined outbreaks of cyclosporiasis, the ensemble assigned links that were partially concordant. Only three of seven cases associated with the Michigan event cluster were linked by the ensemble (Fig. 2, blue). The foods consumed at this event were prepared in the same kitchen, though came from diverse sources. Patients were exposed via hotel restaurant dining, catered events and/or room service. Consequently, a single food vehicle could not be identified. Despite the lack of concordance with the epidemiology, the haplotype composition of these specimens indicates that the ensemble assigned rational links for all seven cases (Fig. 3). For five cases linked to the Wisconsin restaurant-associated cluster (Fig. 2, orange), the ensemble assigned links that were partially concordant with the epidemiology. These patients had dined at the same restaurant chain and their onsets of illness fell within 9 days of each other. However, three of the five samples associated with this epidemiologically defined cluster had partial genotypes assigned to them due to sequencing failures.
For the specimens in two of the eight epidemiologically defined clusters, the ensemble detected no links. This includes the four specimens associated with the Texas Restaurant 2 cluster (Fig. 2, purple), where the infections were assigned to four different groups by the ensemble. The patients associated with this outbreak had dined at the same restaurant chain though in different cities, and their illness onset dates were up to 23 days apart. For the two cyclosporiasis patients that had their infections linked to the Mexican Event associated cluster (Fig. 2, brown), the ensemble assigned their infections to different groups. These cyclosporiasis patients had spent one overlapping day at the same event. Despite the lack of concordance with the epidemiological data in some cases, the haplotype composition of the specimens allocated to each cluster suggests that the ensemble had nonetheless assigned plausible linkages (Fig. 3).
Discussion
Previous attempts to develop molecular typing tools for C. cayetanensis have proved difficult due to challenges in ascertaining cases, collecting specimens, and difficulties associated with PCR amplification and sequencing of target loci (Guo et al., Reference Guo, Roellig, Li, Tang, Frace, Ortega, Arrowood, Feng, Qvarnstrom, Wang, Moss, Zhang and Xiao2016; Li et al., Reference Li, Chang, Shi, Wang, Fu, Li, Xu, Jia, Guo and Zhang2017). Like all apicomplexan parasites, C. cayetanensis possesses three discrete genomes: one nuclear, one mitochondrial, and a third contained within a vestigial plastid homologous to the chloroplast called the apicoplast (Cinar et al., Reference Cinar, Qvarnstrom, Wei-Pridgeon, Li, Nascimento, Arrowood, Murphy, Jang, Kim, Kim, da Silva and Gopinath2016; McFadden and Yeh, Reference McFadden and Yeh2017). Adding to this complexity, the genome sequence of C. cayetanensis is relatively large (44 MB), so WGS is not feasible for routine genotyping. Therefore, MLST represents the most viable solution for typing C. cayetanensis. However, as a consequence of the difficulties discussed above, no independently (i.e. epidemiologically) validated genotyping approaches have been developed for aiding cyclosporiasis outbreak investigations.
The use of phylogenetic inference to aid linkage of cyclosporiasis cases is confounded by the heterogeneous nature of infections which is likely attributable to the parasites sexual reproductive cycle. During this cycle, fusion of a macrogamete (1N) and a microgamete (1N) in the host gut produces a zygote that develops into an oocyst. Oocysts are shed in the hosts' feces and only become infectious after sporulation; a process that takes approximately 2 weeks (Smith et al., Reference Smith, Paton, Mitambo and Girdwood1997). Fully sporulated oocysts possess two sporocysts, each containing two infective sporozoites that are haploid (1N). Sporozoites in an individual sporocyst are thought to be genetically identical based on studies of Eimeria (Shirley and Harvey, Reference Shirley and Harvey1996), while the sporocysts in a single apicomplexan oocyst can be genetically distinct (Mzilahowa et al., Reference Mzilahowa, McCall and Hastings2007). Consequently, one apicomplexan oocyst can be heterozygous, possessing up to two alleles for any given locus so the number of sequence types detected between C. cayetanensis infections often varies depending on the locus examined (Supplementary File S2). In this study, approximately 20% of specimens were homozygous at the 360i2 locus, while approximately 8% were homozygous at the 378 locus. Not surprisingly, specimens homozygous at one nuclear locus were often heterozygous at the other and some specimens possessed three or four 378 haplotypes indicating infections of mixed genotypes, which required manual unphasing. For the mitochondrial locus, most specimens possessed a single haplotype with only one specimen possessing two haplotypes.
Examination of the haplotype composition of specimens within each ensemble-assigned cluster indicated that the groupings were plausible (Fig. 3). Additionally, the epidemiological data corroborated a significant number of ensemble-assigned links and the concordance between these methods was unlikely to have arisen by chance. We therefore suggest that the approach shows great promise as an aid for epidemiologic investigation of cyclosporiasis outbreaks.
However, the underlying algorithms have some limitations and are based on several assumptions that should be considered. For instance, the quality of the links assigned relies on the size of the dataset. Preliminary analyses have shown that because the underlying algorithms rely on frequencies, the approach performs better on larger datasets. It is also important to highlight that the cluster dendrograms generated using this approach are not akin to a genetic distance, but more closely represent the probability of relatedness based on a set of frequencies. A single C. cayetanensis infection represents a complex mixture of haplotypes and the precise frequency of these cannot be known from this type of data. Consequently, the probabilities calculated as part of the ensemble are based on the frequency of samples possessing each haplotype rather than the frequency of each haplotype in the population. Therefore, both algorithms substitute the frequency of samples possessing each haplotype in place of a true haplotype frequency, which is less accurate though cannot be avoided using the data generated here. Furthermore, the ensemble may be prone to sampling bias, as the links assigned may be skewed in circumstances where genotypes that are very common in the true population are rare in the study cohort. Such an occurrence could lead to specimens being strongly linked by the ensemble even though their genotype is actually common. In circumstances like this, the closeness of a relationship may be over-estimated.
Possibly the most important limitation of this strategy (also a limitation of the laboratory methods) is that only a minor portion of the parasites' genome is sampled, meaning the algorithms attempt to extrapolate genetic relationships from limited data. Our three markers resolved the 88 specimens analysed into 16 clusters (Fig. 2), though improved granularity may be achieved with the inclusion of additional typing markers to our panel. We also propose that the use of deep sequencing technologies in place of Sanger would almost certainly improve accuracy by increasing the number of haplotypes detected within each specimen. Additionally, the similarity-based classification algorithms underpinning the ensemble could be modified to accommodate deep sequencing data, such that the normalized read counts might be used in place of a haplotype frequency.
The similarity-based classification algorithms underlying the ensemble were designed to accommodate partial typing datasets (Supplementary file S1), because amplification and sequencing are not always successful for every specimen. Nonetheless, the amplification and sequencing success rate for this scheme (84%) is superior to previously described approaches (~50%) (Guo et al., Reference Guo, Roellig, Li, Tang, Frace, Ortega, Arrowood, Feng, Qvarnstrom, Wang, Moss, Zhang and Xiao2016; Li et al., Reference Li, Chang, Shi, Wang, Fu, Li, Xu, Jia, Guo and Zhang2017) despite most specimens used here being several years old. In any case, the results suggest that the ensemble assigns plausible links in the event of missing data. For example, sequencing of the 378 locus failed for a repeat specimen from Patient B, yet the specimen was still linked closely by the ensemble to the other repeat specimens from this same patient. Similarly, one of four specimens linked to the local business cluster from Texas had missing data for locus 378 (Fig. 2, red), yet was still linked to the other specimens from this epidemiological cluster. While retention of samples with missing data is not ideal, this feature of the ensemble reduces data wastage and means that specimens with a partial genotype remain useful.
This approach linked specimens associated with four epidemiologically-defined clusters with full concordance. This included specimens associated with the South Carolina temporospatial cluster, the Maine temporospatial cluster, the Texas local business-associated cluster and the cluster associated with Restaurant 1. The approach linked only three of seven cases from the Michigan event associated cluster (Fig. 3, cluster 9), though despite this lack of concordance, the four unlinked specimens (PA1462, MI1436, MI1431, MI1430), are genetically distinct from each other at the loci sequenced (Fig. 3). Similarly, for the Restaurant 2 cluster and the cluster associated with the Mexican event, there was no concordance between the epidemiological data and the ensemble-assigned links. However, the haplotype composition of each of these specimens also suggested that they were not closely related (Fig. 3). In fact, one specimen from the Mexican retreat associated cluster possessed a 360i2 haplotype not observed in any other specimen in the cohort and was assigned to its own unique cluster by the ensemble (Fig. 3, cluster 16). Based on this data, we conclude that the lack of concordance between the epidemiology and the ensemble-assigned links is not related to the performance of the algorithm. We note however, that in the absence of a reference C. cayetanensis genotyping method, epidemiological linkages remain the only method to assess the performance of this approach.
Despite its limitations, the ensemble assigned specimens to plausible clusters of genetically related infections based on their complex haplotype composition. These relationships were corroborated by a significant number of epidemiological linkages suggesting the ensemble's utility for aiding epidemiological trace-back and case-linkage investigations.
Supplementary material
The supplementary material for this article can be found at https://doi.org/10.1017/S0031182019000581.
Author ORCIDs
Joel L. N. Barratt, 0000-0001-8711-2408; Yvonne Qvarnstrom, 0000-0002-9466-6414.
Accession numbers
The Genbank BioSpecimen numbers for all published C. cayetanensis genomes are listed in the supplementary material. The sequence of each haplotype from the 378, 360i2 and MSR loci are available in GenBank under Accession Numbers MH185772 to MH185793.
Disclaimer
The findings and conclusions in this report are those of the author(s) and do not necessarily represent the official position of the Centers for Disease Control and Prevention/the Agency for Toxic Substances and Disease Registry.
Author contributions
JB developed the heuristic algorithm, drafted the manuscript, performed in data analysis and contributed to the study design. SP prepared early drafts, performed data analysis, designed the SNP detection workflow, defined typing markers, designed primers and assembled the genomes. FN performed oocysts purification, WGS prep and with JH, performed the molecular work, including DNA extractions, PCR, gel electrophoresis and Sanger sequencing. MP modified the Bayesian algorithm for application to the C. cayetanensis dataset, wrote R scripts and performed statistical analyses. SC carried out the epidemiological investigations. MA, YV and ET contributed to the study design and execution. RB, MA and YV obtained funding and reviewed manuscript drafts.
Financial support
This research was supported by the CDC Advanced Molecular Detection (AMD) initiative.
Conflict of interest
None.
Ethical standards
Human fecal specimens (N = 92) subjected to typing (N = 88) and/or genome sequencing (N = 11) were used in accordance with the protocol entitled ‘Use of coded specimens for Cyclospora genomics research’ and approved by the Human Research Protection Office at the CDC Center for Global Health (Protocol Number: 2014-107a). The specimens were submitted to the CDC Parasitic Diseases Branch for confirmatory diagnosis of cyclosporiasis, as part of outbreak investigations, or for research purposes. Written informed consent was obtained from persons providing specimens for research purposes. Consent was not obtained for the use of specimens submitted for routine diagnosis or as part of outbreak investigations as these were coded and de-identified ‘in such a manner that subjects cannot be identified, directly or through identifiers linked to the subjects’. This is in accordance with the Office for Human Research Protections Code of Federal Regulations, Title 45, Part 46, Section §46.101(b)(4).


 Open access