


Introduction
Nano-computed tomography (nanoCT) is a nondestructive method for 3D structural imaging of materials. However, a direct determination of chemical composition of the materials, especially the distribution of light elements, e.g., hydrogen (H) or lithium (Li) is not possible (Wang et al., Reference Wang, Zhu, Engelhard, Devaraj and Baer2016). On the other hand, Secondary ion mass spectrometry (SIMS) is a powerful technique for nanoscale chemical imaging of materials, and it is excellently suited for the analysis of all elements of the periodic table including isotopes and even for trace level concentrations (Wirtz et al., Reference Wirtz, de Castro, Biesemeier, Hoang and Audinot2020, Eswara et al., Reference Eswara, Pshenova, Lentzen, Nogay, Lehmann, Ingenito, Jeangros, Haug, Valle, Philipp, Hessler-Wyser and Wirtz2019a). Among the main advantages of SIMS in comparison to the typically available chemical analysis techniques in a scanning electron microscope (SEM) are the surface sensitivity (Benninghoven et al., Reference Benninghoven, Rüdenauer, Werner, Benninghoven, Rüdenauer and Werner1986), better lateral resolution, the possibility to image dopant distributions (e.g., in semiconductors) (Eswara et al., Reference Eswara, Pshenova, Lentzen, Nogay, Lehmann, Ingenito, Jeangros, Haug, Valle, Philipp, Hessler-Wyser and Wirtz2019a), and the possibility to analyze low-Z element, such as H or Li, distribution in materials (Sui et al., Reference Sui, Song, Dluhos, Lu and Korsunsky2015), with the latter being of crucial importance in the development of Li batteries (Gelb et al., Reference Gelb, Finegan, Brett and Shearing2017). However, SIMS is by its nature a destructive technique, consuming sample material during the analysis. The complementarities between nanoCT and SIMS make a correlative analysis very interesting. Investigating materials using both techniques can provide insights, which cannot be obtained when using only a single technique (Eswara et al., Reference Eswara, Pshenova, Yedra, Hoang, Lovric, Philipp and Wirtz2019b). For instance, if a feature of interest is buried (e.g., internal inclusions or chemical segregation at microcracks) and is dispersed inside a volume to be analyzed, SIMS imaging of the surface alone is insufficient to draw conclusions. To maximize the throughput of analysis, nanoCT may be used first to identify the locations of buried features and then a targeted milling followed by SIMS imaging can provide complementary insights about the chemical composition of those specific buried features. While SIMS is available as a standalone instrument or as a modular accessory attached to a focused ion beam (FIB) instrument, nanoCT is often a standalone instrument. Recently, a compact nanoCT module inside an SEM instrument has been demonstrated (Lutter et al., Reference Lutter, Stahlhut, Dremel, Zabler, Fell, Herrmann and Hanke2021). Integration of both nanoCT and SIMS modules in a single conventional lab-scale FIB-SEM will thus significantly enhance its capabilities regarding sample preparation and materials characterization. However, as the requirements for sample size and shape (Priebe et al., Reference Priebe, Audoit and Barnes2017), as well as the analysis protocols, greatly differ, a demonstration of the feasibility and compatibility for correlative nanoCT-SIMS of the same sample volume in a single FIB-SEM is still to be proven. The objective of the present study is to take an important step toward that goal by demonstrating the feasibility by ex situ correlation of nanoCT and SIMS from the same sample volume. We use a cathode material of a commercial lithium battery as sample for this demonstration of feasibility. NanoCT is used to nondestructively inspect large sample volumes, to image the material morphology and to identify regions of interest (ROI), like, for example, damaged active material (AM - i.e. electrochemically active components of electrodes) or the presence of particle-internal pores (Hausbrand et al., Reference Hausbrand, Cherkashinin, Ehrenberg, Gröting, Albe, Hess and Jaegermann2015; Bessette et al., Reference Bessette, Paolella, Kim, Zhu, Hovington, Gauvin and Zaghib2018). Subsequently, SIMS is employed to perform targeted local chemical analysis of the selected ROIs.
Materials and Methods
The cathode material which is investigated in this study is extracted from a commercial lithium-ion battery (LIB) cell produced by Kokam (product ID: SLPB 353452) (KOKAM ENGINEERING CO., LTD, 2002). The battery is assembled as a pouch cell, it weighs about 12 g and provides a capacity around 580 mAh. The blended cathode incorporates two AMs namely LiCoO2 (LCO) and LiNiCoAlO2 (NCA) and a carbon black binder phase. The binder consists of poly vinylidene fluoride (PVDF P5130), which is commonly used in the production of composite electrodes due to its good chemical stability, and carbon (C) black as a conductive additive (Ordoñez et al., Reference Ordoñez, Gago and Girard2016).
Sample Preparation
To combine nanoCT and SIMS, sample preparation is a challenging task due to their contrary requirements of sample shape. Typically for nanoCT a rod-like sample holder carrying the sample on its tip is required, this ensures a large distance between the X-ray source and the sample stage reducing the risk of collision. The sample should be placed in a horizontal plane between the X-ray source and detector (Fig. 1a), and the X-ray source-sample distance in SEM-based CT is only a few 100 μm (Fig. 1b). In contrast, the ideal sample for SIMS is a planar surface, ensuring a homogeneous electric field for the secondary ion extraction. Due to these constraints, we decided to not use a typical nanoCT sample holder rod but instead to place the sample on a planar substrate. Carbon was chosen as a substrate material as it emits only low energy X-rays upon interaction with stray electrons, and thus, the contrast in the CT image is improved.

Fig. 1. (a) Schematic illustration of XRM-II nanoCT setup. (b) Top view SEM image showing the X-ray target and the sample pillar. (c) Top view SEM image of the sample pillar and the steel pedestal. (d) Side view nanoCT slice of the substrate-pedestal-sample arrangement.
A compromise between both contrary requirements was found by placing a μm-scaled pillar of the sample material on a planar carbon substrate. The pillar height should be as small as possible for SIMS and at the same time high enough to position the X-ray target right in front of the sample pillar without touching the carbon surface, see Figures 1a and 1b. Therefore, a pillar height of about 150 to 200 μm was the goal. For stability reasons, a pedestal of steel was placed on the substrate on the top of which the sample pillar was then fixed using FIB-based platinum deposition (Fig. 1c shows a top-view SEM image of the sample pillar-pedestal and Fig. 1d depicts a side view nanoCT slice of the sample pillar-pedestal arrangement).
A detailed documentation of the sample preparation workflow can be found in Supplementary Figure S1.
NanoCT Analysis
The Procon XRM-II nanoCT is based on a JEOL JSM-7900F SEM equipped with an X-ray target manipulator and a photon-counting X-ray detector (ADVACAM WidePIX). In addition to electron imaging, an EDS detector from EDAX (Element with APEX software) allows chemical analysis of the sample. For nanoCT mode, a focused electron beam is positioned on the tip of an X-ray target, emitting an X-ray spectrum, which is then used to acquire a radiographic image as illustrated in Figures 1a and 1b. The target material determines the energy spectrum of the generated X-rays, and the X-ray absorption within the sample depends mainly on the atomic numbers of the constituent elements. Hence, for optimal image quality, the target material is chosen depending upon the major elements in the sample. As the cathode material used in this study consists of elements which have high X-ray attenuation coefficients like cobalt (Co) and nickel (Ni), tungsten was chosen as a target material. Tungsten, with a characteristic Lα X-ray energy of 8.4 keV, generates an X-ray spectrum with relatively high mean energy compared with other target materials like chromium or copper and is therefore suitable to image high-absorbing materials. As the SEM images showed morphological features of a few microns, a bulk target was chosen. The geometry of a bulk target is defined as a tilted surface with a volume larger than the interaction volume of the electron beam and target material, ensuring that no electrons are transmitted. With 30 keV electrons and a beam current of 400 nA, the bulk target generates a high photon flux and offers an adequate spatial resolution of about 250 nm to image the morphology of the cathode sample. Furthermore, the bulk target reduces scatter radiation in contrast to other target shapes because no electrons are transmitted through the target to hit the stage surface. For CT measurement, the X-ray target or more precisely the X-ray focal spot must be in a horizontal plane with the sample and the center of the X-ray detector. Therefore, the target was placed right above the carbon disk at a height of about 100 μm, allowing sample rotation without touching the target. The sample pillar was positioned at a distance of 400 μm from the focused electron beam spot on the target. The emitted X-rays used for imaging pass through the sample, are attenuated and hit the X-ray detector. The sample, in the form of a microscale pillar, was rotated stepwise (angular steps = 0.3°) around its main axis and a radiograph was taken for each angle (Engstler et al., Reference Engstler, Fell, Lutter, Maisl, Herrmann and Mücklich2020; Lutter et al., Reference Lutter, Stahlhut, Dremel, Zabler, Fell, Herrmann and Hanke2021). A total number of 1,200 projections with 90 s exposure time and a voxel sampling of 50 nm were acquired. Afterwards, the projections were used to reconstruct a 3D volume of the object by regularized simultaneous algebraic reconstruction technique with specific geometry correction for XRM-II nanoCT setup revealing the microstructure of the battery material (Dremel et al., Reference Dremel, Althoff and Zabler2016).
SIMS Analysis
SIMS imaging was performed using a Thermo Fisher Scios DualBeam FIB-SEM equipped with an in-house developed double-focusing magnetic sector SIMS system which allows the detection of multiple masses in parallel (Wirtz et al., Reference Wirtz, de Castro, Hoang, Cressa, Eswara, Biesemeier and Audinot2021). The FIB consists of a gallium liquid metal ion source producing 69Ga+ primary ions. The secondary ions that were collected and imaged are: 7Li+, 27Al+, 58Ni+, and 59Co+. The SIMS measurements were carried out with the primary ions of 30 keV, a current of 50 pA, and dwell times between 0.55 and 1.20 ms. The images were recorded with a resolution of 512 × 512 pixels and fields of view between 11.8 and 20.7 μm. To extract positive secondary ions, the sample stage was biased to +500 V which resulted in a primary ion impact energy of 29.5 keV. Data analysis was performed using the free software FijiImageJ (Schindelin et al., Reference Schindelin, Arganda-Carreras, Frise, Kaynig, Longair, Pietzsch, Preibisch, Rueden, Saalfeld, Schmid, Tinevez, White, Hartenstein, Eliceiri, Tomancak and Cardona2012) and AVIZO (Version 2021.1., Thermo Fisher).
Multiple options can be considered to accelerate sample preparation as well as the analysis workflow. First, using a plasma or laser FIB instead of a common FIB, would considerably decrease the process of sample preparation. Second, there are various ways to speed up the analysis workflow, however most of them come with a compromise regarding resolution. The nanoCT measurements could for example be accelerated by reducing the number of projections, increasing the rotation angle between the measurements and/or by reducing the exposure time. SIMS analysis, on the other hand, could be expedited by increasing the primary ion current, reducing the dwell time, and/or reducing the number of pixels. However, as already mentioned, all these analysis parameters influence the resolution and a compromise needs to be found to achieve a resolution which is sufficient for the purpose of the analysis but still within a reasonable time frame.
Results and Discussion
For the following evaluation, a selection of reconstructed slices from nanoCT measurements are shown (Fig. 2) and, moreover, a video of the whole reconstructed volume is provided in Supplementary Figure S2. At this point, we want to highlight that for ex situ workflows, finding the exact same ROI after transferring samples between instruments is often very challenging and, in some cases, not feasible. The afore-mentioned sample preparation protocol allows to perform correlative nanoCT and SIMS on the exact same unmodified (neither structurally nor chemically) ROI. The possibility of reconstructing the whole volume, to inspect the inner structure of the sample and to identify buried features (e.g., damaged particles or particle-internal pores) for subsequent local chemical probing using SIMS, ensures examination of the exact same sample volume.

Fig. 2. Example of reconstructed slices from nanoCT measurement of the cathode sample. The left and right columns depict two horizontal (H1, H2) and two vertical (V1, V2) slices of the reconstructed volume from nanoCT. The column in the middle shows an SE-SEM image with the approximate positions of H1, H2 planes, and the same image is reproduced below it to indicate the V1 and V2 planes. Possible degradation products are visually inspected and are highlighted in H2, V1 and V2: red arrows = micropores; white arrows = cracks.
NanoCT allows a good two- and three-dimensional overview of the sample volume with a moderate resolution. The spatial resolution is determined in the reconstructed slices by calculating the full-width at half-maximum of the line spread function resulting from the differentiation of the edge-response function between sample volume and background (vacuum) resulting in 224 nm ± 23 nm (ASTM Standard E 1441, 2019). The evaluated area is an object edge of the sample pillar, which is prepared by FIB, showing a surface roughness smaller than the expected spatial resolution. The reconstructed volume is highlighted in Figure 2, showing two horizontal (H1, H2) and two vertical (V1, V2) reconstructed slices. In H2 and V2, we are drawing attention to how we identify potential ROIs, in this case, especially anomalous microstructural features. Those features or possible degradation products are visually inspected and areas for subsequent SIMS imaging are selected. Particle internal micro-pores are highlighted by red arrows and cracks by the white arrow in H2 and V2. For a morphological analysis however, a better lateral resolution is needed. Thus, regular SE imaging in an SEM has been used to reveal not only nm-scaled features but also to image the carbon-based binder material, which cannot be detected by nanoCT.
A definitive distinction between LCO and NCA cannot be made based on common nanoCT or SE images (see Figs. 2, 3a). For that reason, EDS elemental maps of Ni (yellow) and Co (blue) have been performed in addition to XRM-II nanoCT to elucidate the identity of the particles. Figure 3a shows a top-view SE-SEM image of the sample, in Figure 3b, we can see an overlap to the SE image and the elemental EDS maps (Ni = yellow, Co = blue, C = green). Figures 3c–3e depict the individual elemental maps. However, the major limitations are that EDS is not surface sensitive, and that the analysis of Li is still not feasible for common EDS systems. Supplementary Figure S3 shows SEM, EDS, and SIMS images of the same ROI.

Fig. 3. (a) Top view SE image of the pillar sample and (b) an overlay of SE image and the EDS maps of Ni (yellow), Co (blue), and C (green). (c–e) The single elemental EDS maps of Ni, Co, and C, respectively. Although the LCO and NCA particles are indistinguishable in the SE image, they are easily identified in the SEM-EDS overlay image wherein the LCO particles are identified in blue and the NCA particles are identified in yellow. Analysis of Li by EDS is challenging, and hence, Li maps are not part of this dataset.
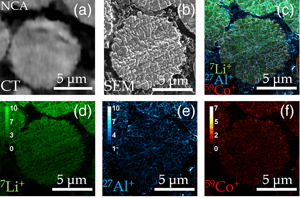
Figures 4a–4f show the correlative nanoCT, SE-SEM and SIMS images of an intact NCA particle. The nanoCT image (Fig. 4a) shows no detailed features, which makes it difficult to distinguish it from LCO. The SE image (Fig. 4b) reveals its elaborated morphology, which consists of many nm-scaled primary grains that form bulky secondary particles in μm-range. Additionally, SEM also indicates the presence and distribution of the binder material, invisible in nanoCT. The SIMS image (Fig. 4c) shows an overlap of the individual chemical maps (Figs. 4d–4f) of 7Li+ (green),27Al+ (blue), and 59Co+ (red). We can clearly see that 7Li+ is detected all over the NCA particles contrary to the carbon-binder, where no Li is detected. On the other hand, we can see that Al is not only present in the grain boundaries of the primary grains but seems to be diffused into the binder phase.

Fig. 4. Correlative CT, SEM, and SIMS images of an intact NCA particle (a–f). The first row shows in (a) a reconstructed slice from nanoCT, (b) an SE image, and (c) the overlay of three SIMS channels, whereas the second row depicts the chemical images of the single SIMS channels (d–f). The correlative analysis of adjacent damaged NCA and LCO is shown in g–l. The AM particles presenting cracks have been exposed to the surface by local FIB-milling. Both, the intact NCA particle and the adjacent damaged NCA and LCO, have been analyzed at an approximate depth of 1.5 μm from the top of the sample pillar. The SIMS elemental mappings represent 7Li+ (green), 27Al+ (blue), and 59Co+ (red). The intensity bars in the individual SIMS images represent the detected secondary ions per pixel for a certain current and dwell time (see Materials and Methods → SIMS analysis) (scale bar = 5 μm).
The example in Figures 4g–4l underlines the previous statement that a definitive differentiation of the AM is not possible based on nanoCT data (Fig. 4g). The SE image (Fig. 4f) reveals the morphological differences between NCA and LCO. The SIMS data shows that Li is only detected in the AM (Figs. 4i, 4j) and the concentration of Li in the binder material is below the detection limit of SIMS. Regarding the Al distribution (Fig. 4k), this example highlights the previous observation, that Al tends to accumulate in internal grain-boundaries of NCA and diffuses into the binder phase. No aluminum at all was detected on the LCO particle which is perfectly aligned with our expectations as the particle's chemical composition is Al-free. Supplementary Figure S4 shows additional single channel images of: 7Li+, 27Al+, 58Ni+, and 59Co+ of the raw cathode material for a different ROI.
Conclusion and Outlook
A plethora of new battery materials are emerging and the need to correlate morphological appearance and chemical composition to study degradation mechanisms in LIBs has never been more important. In this study, we took a step forward toward an unprecedented correlative analysis approach based on FIB-SEM instruments. To sum up, first, nanoCT mode in XRM-II nanoCT module in a FIB-SEM was used to get a complete two- and three-dimensional representation of the sample to reveal its morphology and to image defects of the microstructure. As nanoCT is nondestructive, this has the advantage that the sample can be scanned to identify ROIs for further investigations without being altered. A more detailed morphological and limited chemical analysis of the sample was performed in SEM mode by XRM-II nanoCT, using SE imaging and EDS, which can be done immediately if the ROI is exposed at the surface. SE imaging and chemical mapping via SIMS of bulk-internal ROIs can be accessed by exposing the surface beforehand by FIB-milling.
The implementation of SIMS in this correlative workflow demonstrates its analytical potential for battery materials. On the one hand, SIMS makes the detection and analysis of lithium no longer challenging and it additionally opens the doors for isotopic measurements, e.g., by mapping 7Li and 6Li. On the other hand, the excellent lateral resolution and high surface sensitivity allows a precise observation of the chemical distribution. This can be a powerful asset for degradation studies where pre- and post-mortem battery samples are compared with each other (Manthiram, Reference Manthiram2020).
The complementarities between nanoCT and SIMS make a correlative approach extremely attractive. This study demonstrated the feasibility and compatibility for a correlative nanoCT-SIMS analysis in FIB-SEM instruments. The successful demonstration of this ex situ approach illustrates that it would not only be feasible, but also very advantageous to integrate both techniques on a single FIB-SEM instrument.
For instance, our novel correlative analysis method presents an unprecedented possibility of analyzing Li-rich dendritic structures in battery materials. Such structures can grow during cycling processes and are extremely unfavorable for safety reasons (short-circuit) and the electrochemical performance (inactivating Li). Correlating morphology (by nanoCT/SEM) and chemical composition by SIMS imaging could unravel for instance, the mechanisms of dendrites formation and their propagation (Goodenough & Kim, Reference Goodenough and Kim2010).
A different case would be the analysis of transition metal diffusion in battery materials (Park et al., Reference Park, Yu, Jung, Li, Zhou, Gao, Son and Goodenough2016). As stated in literature, some transition metals are subject to diffusion during cycling. This alteration of the chemical distribution can trigger parasitic reactions, which are mostly related to an impedance increase. In the case of solid-state electrolytes, the increase of grain boundary impedance leads to a decrease of the electrochemical performance. Our correlative method allows to precisely locate anomalous microstructures and the subsequent SIMS analysis could reveal whether local transition metal diffusion occurs and if it is directly involved in the degradation process.
To maximize the throughput of analysis and accelerate the workflow, this correlative approach could in the future be coupled to machine learning algorithms. Latter could, for instance, be adapted in a way, that part of the nanoCT and SIMS analysis, the search for specific ROI as well as local milling to expose those ROI to the surface could be automated. As a considerable amount of time would be saved, ideally the user would not need to compromise between analysis time and resolution. However, such a machine learning approach would need several large data sets to train the algorithm to detect potential ROI with sufficient accuracy. As more researchers adopt such correlative approaches and as the methodology matures, machine learning assistance will become more valuable in correlative microscopy workflows.
The methodologies demonstrated in our work can be applied to other fields of research beyond batteries such as steels, semiconductors, and various other types of materials. In summary, we have demonstrated that advanced correlative analysis combining nanoCT-SIMS can be performed even on commonly available FIB-SEM instruments without the need for dedicated standalone instruments. This widens the possibilities to tackle long-standing research questions that require a correlative structural and chemical analysis from μm- to nm-scale. By improving the way new materials are analyzed, our understanding of those materials and their properties increases and gives researchers valuable insights to accelerate the development of high-tech materials.
Supplementary material
To view supplementary material for this article, please visit https://doi.org/10.1017/S1431927622012405.
Acknowledgments
We thank Jochen Joos (KIT) for preparing the lithium battery.
Financial support
This work was funded by the Luxembourg National Research Fund (FNR) through the grants INTER/MERA/20/13992061 (INTERBATT), C18/MS/12661114 (MEMPHIS), and the project “Beyond 3D - Tomographische Methodenentwicklung, Datenanalyse und Anwendungen in der Materialwissenschaft als integrierter Ansatz für dynamische und Hochdurchsatz-Mikroskopie” (DFG Grant HE 7079/4-1). Funding for the PFIB/SEM instrument by German Research Foundation is greatly acknowledged (INST 256/510-1 FUGG).
Conflict of interest
The authors declare no competing interests.


 Open access