


1. Introduction
1.1 General
On an average day, 28,000 flights are conducted in the European airspace and the average delay for departure is 33 min (SESAR, 2015; EUROCONTROL, 2020). Delays have direct negative implications on, for example, operating costs for fuel, staff, maintenance and route planning (EUROCONTROL, 2020). Delays are absorbed at the airport departure gate, when queuing on taxiways or waiting in holding bays. The overall goal of the airport ground operations is to achieve a conflict-free and effective route for aircraft to/from the airport terminal (gates/stands) and to the runway (Ravizza et al., Reference Ravizza, Chen, Atkin, Burke and Stewart2013). Airport surface congestion is responsible for increased taxi times, and increased fuel consumption and emissions (Simaiakis et al., Reference Simaiakis, Balakrishnan, Khadilkar, Reynolds, Hansman, Reilly and Urlass2014). There is a potential to resolve these issues by optimising surface operations (Lee et al., Reference Lee, Simaiakis and Balakrishnan2010).
Departures are primarily managed by issuing a calculated take-off time (CTOT), which holds the aircraft at the gate until departure time is due. CTOT is a part of the ATC (air traffic control) clearance (EUROCONTROL, 2017). Estimated off-block time, the estimated time at which an aircraft commences movement associated with departure, governs planning for the actual time of ground movement (ICAO, 2007). The reason for constraining aircraft departure is to avoid further congestion in the air en route and/or at the destination airport. An issued CTOT is communicated to the pilots by radio, data link, billboards at the parking position and/or via handling agents. During taxi, pilots use engine thrust and brakes (unlike jet aircraft, propeller aircraft may also select propellers into reverse to slow down the aircraft) to vary ground speed to reach the assigned CTOT. Basic time-speed-distance calculations, or speed instructions from the ATC, guide the aircraft's ground speed towards the take-off runway. These calculations may be based on experience and rules-of-thumb, for pilots as well as for the ATC, for the airport infrastructure in question. Gotteland et al. (Reference Gotteland, Durand and Alliot2003) suggest one of three generic aims for the ATC: (1) as early as possible an arrival to the runway, (2) reaching the runway as close to the CTOT as possible or (3) to reach the runway within a specific time window, usually minus 5 min to plus 10 min of the CTOT. Future traffic flows and four-dimensional (4D) flight trajectory planning (integration of time into the three-dimensional flight trajectory) may require precision as high as a plus/minus one-minute time window (SESAR, 2015).
The reduction of taxi time has been analysed as a target for effective airport operations (Atkin et al., Reference Atkin, Burke and Ravizza2011), often supported by means of penalties when not conforming to a CTOT (Balakrishnan and Jung, Reference Balakrishnan and Jung2007). Automated systems such as the surface management systems (SMS) for ATC use (Atkins and Brinton, Reference Atkins and Brinton2002) and the Taxiway Navigation and Situation Awareness (T-NASA) system for cockpit use, were developed to increase situational awareness (Foyle et al., Reference Foyle, Andre, McCann, Wenzel, Begault and Battiste1996; Cheng et al., Reference Cheng, Andre and Foyle2009). Airport collaborative decision making (A-CDM), where airport and aircraft operators, ground handlers and ATC collaborate to exchange accurate and timely information (ICAO, 2007; EUROCONTROL, 2017), are examples of systems introduced to improve airport efficiency and capacity planning. Complex SMSs such as the Advanced Surface Movement Guidance and Control System (A-SMGCS) perform automated surveillance, routing, guidance and control functions (Hecker et al., Reference Hecker, Doehler, Korn and Ludwig2001). The essential function of A-SMGCS is the automated routing function which improves time efficiency by identifying an optimised ground route.
By optimising the 4D flight trajectory from start-up at the departure gate, via taxi, take-off, cruise, approach, landing, taxi and engine shut down at the arrival gate, fuel consumption can be reduced (Grote et al., Reference Grote, Williams and Preston2014). Research on 4D flight trajectories has resulted in improved predictability of the flight segment. However, the ground segment is typically computed with an assumed ground speed, risking unrealistic planning (Marín, Reference Marín2006; Couluris et al., Reference Couluris, Fong, Downs, Mittler, Signor, Stassart and Hsiao2008).
Furthermore, a reduction in fuel consumption, and thereby emissions, can be achieved by managing taxi speeds, primarily by reducing the number of accelerations and retardations (Green, Reference Green2011; Simaiakis et al., Reference Simaiakis, Balakrishnan, Khadilkar, Reynolds, Hansman, Reilly and Urlass2014). Nikoleris et al. (Reference Nikoleris, Gupta and Kistler2011) suggest that the taxi segment can be divided into various stages with an estimated engine thrust setting varying between 4–9% of full engine thrust. Stettler et al. (Reference Stettler, Eastham and Barrett2011) used a value of 4–7% for constant speed taxi and 7–17% for acceleration on taxiways. Nagaoka et al. (Reference Nagaoka, Muto and Yoshioka1978) showed that average taxi speed increased when the taxi distance increased. Trade-off estimations, in terms of fuel consumption, thrust settings, taxi distance and time constraints, must at the present time be performed manually.
1.2 Presenting information in cockpit
Presenting information such as speed, altitude, course, pitch, roll, position, terrain and traffic avoidance and systems status such as engine parameters, to the pilots is critical for their interpretation, and interaction with their environment (Shappell et al., Reference Shappell, Detwiler, Holcomb, Hackworth, Boquet and Wiegmann2007; Soo et al., Reference Soo, Mavin and Roth2016). Information can be presented by different interfaces: auditive by the use of speakers, visually by the use of displays, gauges and lights as well as haptically by the use of vibrations in pedals, control wheels and side sticks (Green et al., Reference Green, Muir, James, Gradwell and Green2001; van Veen and van Erp, Reference van Veen, van Erp, Brewster and Murray-Smith2001).
Mechanical and analogue instruments have evolved over time into digital electronic systems including sensors, computers and electronic mediums of presentation such as the cathode ray tube, liquid crystal display or the head-up display (HUD) (Craig, Reference Craig2012). The user interface must provide the pilot with timely and easily understood information. Nonetheless, research shows that serious incidents and accidents continue to occur due to decision and perceptual errors based on inadequate information presentation (Shappell et al., Reference Shappell, Detwiler, Holcomb, Hackworth, Boquet and Wiegmann2007). The evolution of cockpit information presentation intends to reduce pilot workload and increase situational awareness by reducing the need for the continuous use of mental models (Wiener, Reference Wiener, Wiener and Nagel1988, Reference Wiener1989; Sarter and Woods, Reference Sarter and Woods1992). A mental model is a cognitive representation of system performance enabling the user to reason about system behaviour (Moray, Reference Moray1996). When this model does not correspond to the actual system performance, a mismatch occurs which must be addressed (Palmer, Reference Palmer, Biocca and Levy1995). Endsley (Reference Endsley2015) points out that the requirement for creating mental models still exists since the available information afforded to the pilots has increased over time. To avoid the risk of creating overwhelming, ambiguous or confusing user information, measures have to be taken to minimise, standardise and prioritise which information to display on the cockpit instruments (Hawkins, Reference Hawkins1987; Foyle et al., Reference Foyle, McCann and Shelden1995; de Winter and Dodou, Reference de Winter and Dodou2014).
Another critical factor when designing a cockpit is the crew itself. Most commercial aircraft are operated by a multi-crew (the crew of an aircraft that is equipped and required by the regulations to be operated by a crew of at least two pilots) where the pilots might have different backgrounds in terms of experience, culture and training as well as depending on (daily) cognitive prerequisites. Cockpit interfaces therefore need to match different cognitive strategies applied by both novices and experienced pilots (Stokes and Kite, Reference Stokes and Kite1997; Sexton et al., Reference Sexton, Thomas and Helmreich2000).
1.3 HUD in aviation
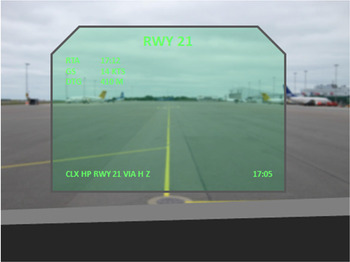
Presentation of visual information can be achieved by head-down display (HDD), where pilots maintain their vison inside the cockpit by looking down on instrument panels, and/or by HUD (Figure 1), where pilots during specific flight phases maintain their visual attention out through the cockpit windows (Brickner and Foyle, Reference Brickner and Foyle1990). HUD technology has a long history in the aerospace industry (Weintraub and Ensing, Reference Weintraub and Ensing1992) and is based on reflective gunsight technology from aircraft in the Second World War (Newman, Reference Newman1995). HUD has also been developed and used to varying degrees in the automotive industry as well as extensively in military applications (Gish and Staplin, Reference Gish and Staplin1995; Holder and Pecota, Reference Holder and Pecota2011).
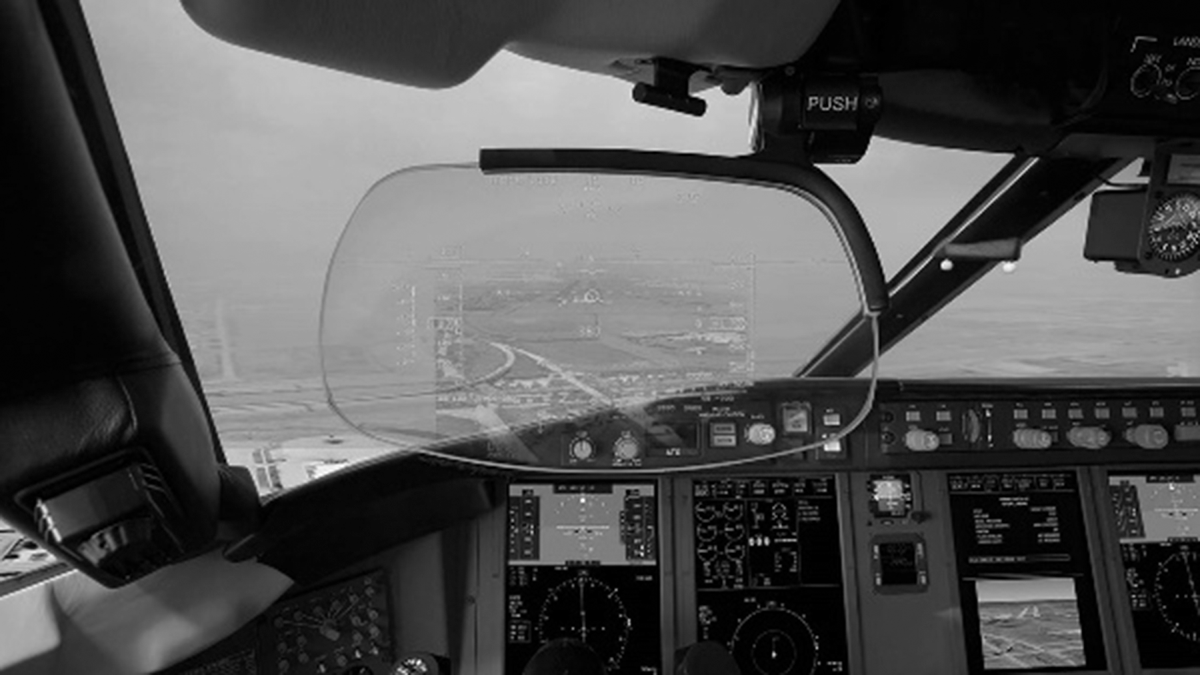
Figure 1. Example of HUD installation (Collins Aerospace HGS 6000). Note: Approved for publication by Collins Aerospace
The working principle of HUD is that a projector is used to project information on a semi-transparent surface (combiner) in front of the pilot (Newman, Reference Newman1987). To fuse the outside world, as seen through the HUD, information displayed must be collimated to mitigate constant changes of eye-focus. The far end for focus is infinity and the close end is the combiner itself (Newman, Reference Newman1987). The pilot's view through the HUD is thus a combination of the inside world and the outside real world. HUD decreases scanning requirements (Martin-Emerson and Wickens, Reference Martin-Emerson and Wickens1997) by presenting information at one location and in the outside world line-of-sight ensuring that information inside and outside the cockpit can be processed simultaneously. Reduced scanning requirements in turn increases situational awareness (Foyle et al., Reference Foyle, McCann and Shelden1995; Proctor, Reference Proctor1999, Reference Proctor2000). This is accomplished by reduced dwelling times between the outside and inside world as well as reduced amounts of information to be stored in the short-term memory. Furthermore, the requirements of creating a mental model of the flight trajectory, by synthesising information from different sources (and continuously updating that model), can be mitigated by gathering basic information at one location (Endsley, Reference Endsley2015).
During critical phases of the flight trajectory, such as take-off, climb, approach, flare, landing and roll-out, HUD is effective since task-specific information such as speed, pitch and vertical and lateral information can be projected in the pilot's line-of-sight (Stuart et al., Reference Stuart, McAnally and Meehan2003). HUD can, however, degrade or slow down the detection of unforeseen events (Fadden et al., Reference Fadden, Ververs and Wickens1998; Wickens and Alexander, Reference Wickens and Alexander2009) due to pilots tending to cognitively tunnel their attention into the HUD. This occurs at the expense of outside world events by inefficient joint processing of the inside world superimposed on the HUD and the outside world as seen through it (Foyle et al., Reference Foyle, Sanford, McCann and Jensen1991).
1.4 Purpose
The airborne segment of the 4D flight trajectory has been studied to improve precision and predictability in terms of navigation and time-keeping. Studies of the ground segment (taxi) of the 4D flight trajectory indicate that improvements in time-keeping could be further studied. Based on a systematic literature review for this study, and in combination with the first author's applied experience as a commercial pilot, the purpose of the study is (1) to design a HUD presentation that could improve time-keeping during taxi and (2) to evaluate which information on such a HUD is rated the most useful for novice as well as expert pilots.
2. Methods
2.1 Design process
A design process is generally associated with product development where a product is conceived, designed and commercialised (Lawson, Reference Lawson2006). However, the present study was limited to product development and evaluation, excluding market research, manufacturing, certification and commercialisation. A process can be defined as a series of activities, changes or functions which combined leads to a result (Karlsson et al., Reference Karlsson, Osvalder, Rose, Eklund, Odenrick, Bohgard, Karlsson, Lovén, Mikaelsson, Mårtensson, Osvalder, Rose and Ulvengren2009). Markus (Reference Markus1969) and Maver (Reference Maver and Moore1970) suggest a four-step linear design process of analysis, synthesis, appraisal and decision. Osvalder et al. (Reference Osvalder, Rose, Karlsson, Bohgard, Karlsson, Lovén, Mikaelsson, Mårtensson, Osvalder, Rose and Ulvengren2009) describes a generic process including data collection, data analysis, development of products, systems and environments and presentation of results. Linear and sequential processes have been criticised by Lawson (Reference Lawson2006), who suggests focusing to a greater extent on the tools and the components used compared with identifying specific steps. Furthermore, two basic prerequisites in a human-machine interface design are that the design process is driven by iteration and must involve the users that will handle the end product (Karlsson et al., Reference Karlsson, Osvalder, Rose, Eklund, Odenrick, Bohgard, Karlsson, Lovén, Mikaelsson, Mårtensson, Osvalder, Rose and Ulvengren2009).
To match the objective of the study, a generic four-step design process adapted from Kragt (Reference Kragt1992) was applied (Figure 2). The design process included: (1) definition, (2) research, (3), design, and (4) evaluation. Furthermore, the process was not developed or evaluated as such.
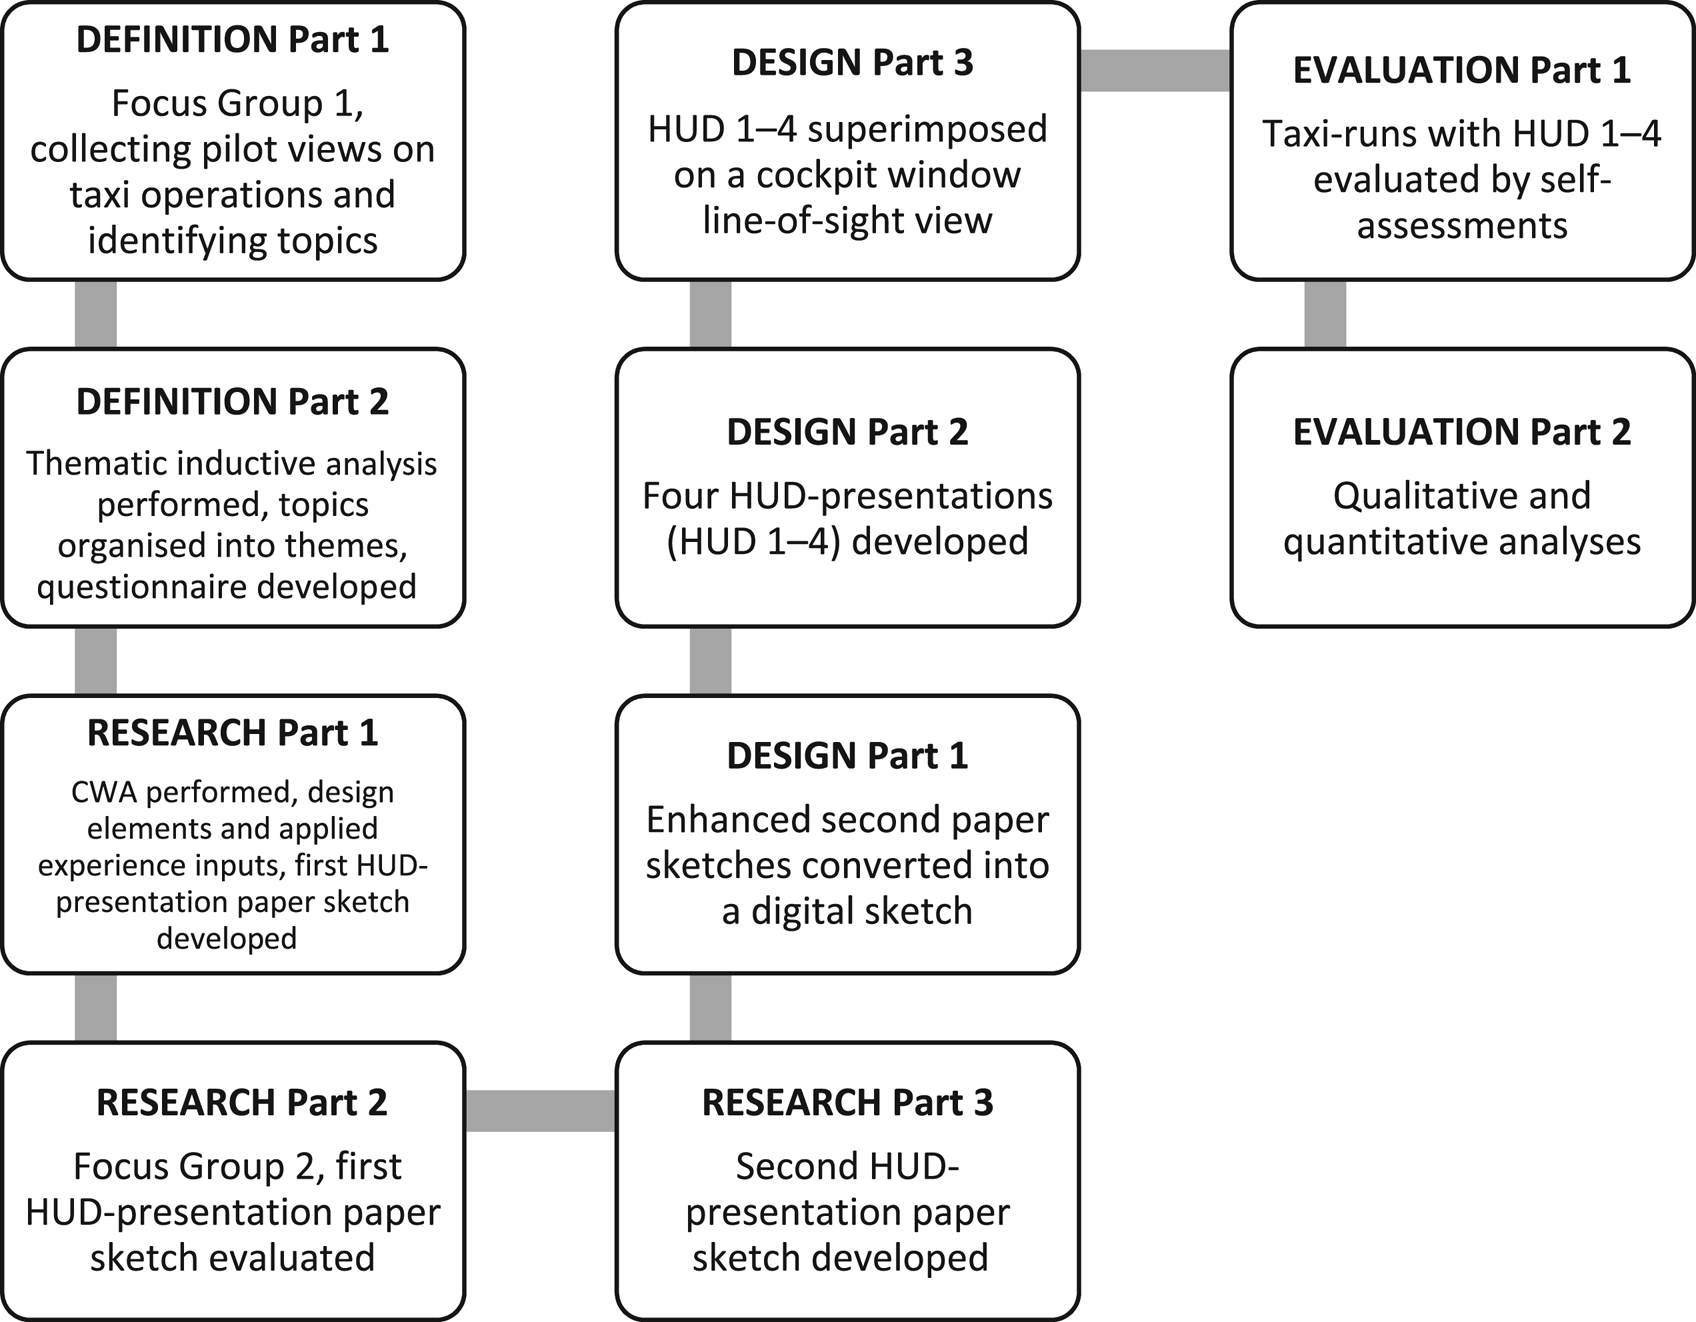
Figure 2. Overview of the design process used in this study. Adapted from Kragt (Reference Kragt1992)
2.2 Definition part 1
A first focus group two-hour session was completed and organised as a group interview with open-ended questions to increase the understanding of pilots’ needs and requirements during taxi when CTOTs were in force. Organised discussions in groups can be effective to increase the understanding of individuals and their ideas, feelings and attitudes (Krueger and Casey, Reference Krueger and Casey2000). Furthermore, Virzi (Reference Virzi1992) suggests that 80% of potential usability problems can be detected using focus groups. The ideal number of participants is approximately five participants (Rubenstein et al., Reference Rubenstein, Hersh and Ledgard1984; Virzi, Reference Virzi1992).
Focus Group 1 consisted of five male pilots, all holding an Airline Transport Pilot Licence (ATPL) with a mean age of 48 years and a mean flight time of 10,228 flight hours. All five pilots were full-time employees at major airlines, with four working as captains and one as a co-pilot. The focus group session was recorded on a voice-recording device and transcribed on level III (Linell, Reference Linell1994). Additionally, notes were also taken as a complement to the recording.
2.3 Definition part 2
A thematic inductive analysis (Braun and Clarke, Reference Braun and Clarke2006) was used with emerging topics transcribed on level III (Linell, Reference Linell1994), examined, categorised and clustered into six themes: information, workload, situational awareness, stress, support and usability. These six themes were subsequently calibrated on information as described by Rasmussen (Reference Rasmussen1986) and Bisantz et al. (Reference Bisantz, Stone, Pfautz, Fouse, Farry, Roth, Nagy and Thomas2009); on workload as described by Megaw (Reference Megaw, Wilson and Corlett2005) and Sexton and Helmreich (Reference Sexton, Helmreich and Dietrich2003); on situational awareness as described by Endsley (Reference Endsley, Parasuraman and Mouloua1996) and Smith and Hancock (Reference Smith and Hancock1995); on stress as described by Lazarus and Folkman (Reference Lazarus and Folkman1984) and Merritt and Helmreich (Reference Merritt and Helmreich1996); on support as described by Morrison et al. (Reference Morrison, Kelly, Moore, Hutchins, Cannon-Bowers and Salas1998); and on usability as described by Shackel (Reference Shackel1981) and Williams and Ball (Reference Williams and Ball2003).
Based on these descriptions, the following definitions were created to be used during design and evaluation. Information: the amount, presentation position, colour, layout, and practicality of presented alpha-numerical and graphical information on the four displays to be used to reduce uncertainty. Workload: the amount of cognitive effort in terms of work and/or time that was experienced when using the displays to make calculations and estimations and as a base for decision making. Situational awareness: the perception, understanding and assessment of environmental elements and/or events in terms of time or space, and the projection of future events to come. Stress: the physiological or psychological reaction on pressure to handle internal as well as external demands. Support: the overall support gained from the displays in terms of surveillance and decision making. Usability: the capability of a tool, that can be used by specified users, to achieve a specified goal with effectiveness within a specified context.
Furthermore, the six themes were also operationalised into a psychometric six-point Likert scale questionnaire as variables to be used during the evaluation part.
2.4 Research part 1
2.4.1 Cognitive work analysis
Work in complex socio-technical systems can be assessed by different methods. A common method is the cognitive work analysis (CWA) framework originally developed by Rasmussen et al. (Reference Rasmussen, Pejtersen and Goodstein1994). A variety of domains such as health care (Effken et al., Reference Effken, Brewer, Logue, Gephart and Verran2011; Ashoori et al., Reference Ashoori, Burns, d'Entremont and Momtahan2014), military (Jenkins et al., Reference Jenkins, Stanton, Salmon, Walker and Young2008; Brady et al., Reference Brady, Naikar, Treadwell, Ahamed, Piantadosi, Agrawal and Boland2013) and aerospace have utilised CWA. CWA identifies constraints enabling the creation of a model to understand how work is performed. CWA focuses on system design where human, social, technological and organisational prerequisites are reflected and converted into a design (Rasmussen et al., Reference Rasmussen, Pejtersen and Goodstein1994). Furthermore, CWA is formative, focusing on what is required to perform the task regardless of the agent, the event or system environment (Roth and Bisantz, Reference Roth, Bisantz, Kirlik and Lee2013). CWA can however elicit massive amounts of data, which makes it less useful in smaller research groups. CWA, in its original form, also analyses a system already in place followed by recommendations on (re)design (SESAR, 2021). The formative nature of CWA contrasts with the normative methods found in hierarchical transaction analysis (HTA) (Annett and Duncan, Reference Annett and Duncan1967), which focuses on understanding the task based on goals and sub-goals and the potential for error (Stanton, Reference Stanton2006; Salmon et al., Reference Salmon, Jenkins, Stanton and Walker2010), or GOMS (goals, operators, methods, and selection rules), which produces a set of instructions on how work is to be completed (Benyon et al., Reference Benyon, Turner and Turner2005). HTA and GOMS have limited value in dynamic and unanticipated situations. Descriptive methods, focusing on observing what is done, also have a limited value in the design of new products but offer less limitation compared with normative analysis (Vicente, Reference Vicente1999).
In its basic form, CWA consists of five phases: (1) work domain analysis, where the ecology of the work is studied (Vicente, Reference Vicente1999) and where the product is a model of the work domain, (2) control task analysis, where work functions and specific tasks are studied (Vicente, Reference Vicente1999) and where the product is which information is required to execute specific tasks, actions and decisions, (3) strategies analysis on how the work can be implemented (Vicente, Reference Vicente1999) and where the product is a repository of different strategies for accomplishing work tasks, (4) social organisation and cooperation analysis of how work is distributed, communicated and coordinated among different agents in the system and where the product is a repository on who is generating information and who is receiving and acting on it, and (5) worker competence analysis, where the skill levels to perform a task are analysed and where a product is the identification of which competencies a worker needs to accomplish a specific task (Vicente, Reference Vicente1999).
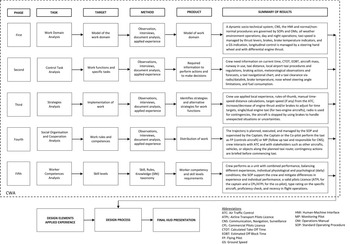
Based on CWA (Rasmussen et al., Reference Rasmussen, Pejtersen and Goodstein1994), in this study an adapted CWA was applied in order to identify, analyse and describe the tasks, constraints, information and actions within the cockpit work-environment during taxi (Appendix Figure A1).
2.4.2 Design elements
The development of the HUD presentation was based on the following design elements (Appendix Table A1): consistency and relative location (U.S. Department of Transportation, 2014), control movement stereotypes (van Cott and Kinkade, Reference van Cott and Kinkade1972; U.S. Department of Defense, 2012), control response compatibility (Helander, Reference Helander2006; Proctor and Vu, Reference Proctor and Vu2016), HUD screen layout (Reference WertheimerWertheimer, 1923/1938; Palmer, Reference Palmer1992), emergent features (Dashevsky, Reference Dashevsky1964), contrast (Wood and Howells, Reference Wood, Howells and Spitzer2001; U.S. Department of Defense, 2012; ESSE, 2021), characters, numbers and symbols attributes (Wood and Howells, Reference Wood, Howells and Spitzer2001; Hirsch, Reference Hirsch2004; U.S. Department of Defence, 2012; Academo, 2021; Eclipse, 2021), HUD screen dimensions (Collins Aerospace, 2021), display–eye distance, design eye position, head motion box and field of view (Wood and Howells, Reference Wood, Howells and Spitzer2001; U.S. Department of Defense, 2012).
Based on definition parts 1–2, the CWA, design elements, and the first author's applied experience as a commercial pilot, a first HUD presentation paper sketch prototype was developed.
2.5 Research part 2
A second focus group session was created and organised as a group interview, including four male and one female pilot with a mean age of 51 years and a mean flight time of 10,898 flight hours, all five holding an ATPL. Four of the pilots were full-time employees at major airlines and one was a full-time pilot at a regional airline. All five were working as aircraft captains. These pilots assessed the first HUD presentation paper sketch in terms of usability. The focus group session was recorded on a voice-recording device and transcribed on level III (Linell, Reference Linell1994). Additionally, notes were also taken as a complement to the recording.
2.6 Research part 3
Based on the inputs from Focus Group 2, the first HUD presentation paper sketch was improved accordingly. The resulting second HUD presentation paper sketch was subsequently used during the first part of the design process.
2.7 Design part 1
The second HUD presentation paper sketch was converted into a digital format by the use of vector graphics editing software (Adobe Illustrator 12⋅01).
2.8 Design part 2
Four different HUD presentations (hereafter HUD 1–4) based on the second HUD presentation digital paper sketch and reflecting different levels of information were developed (Figures 3–6).
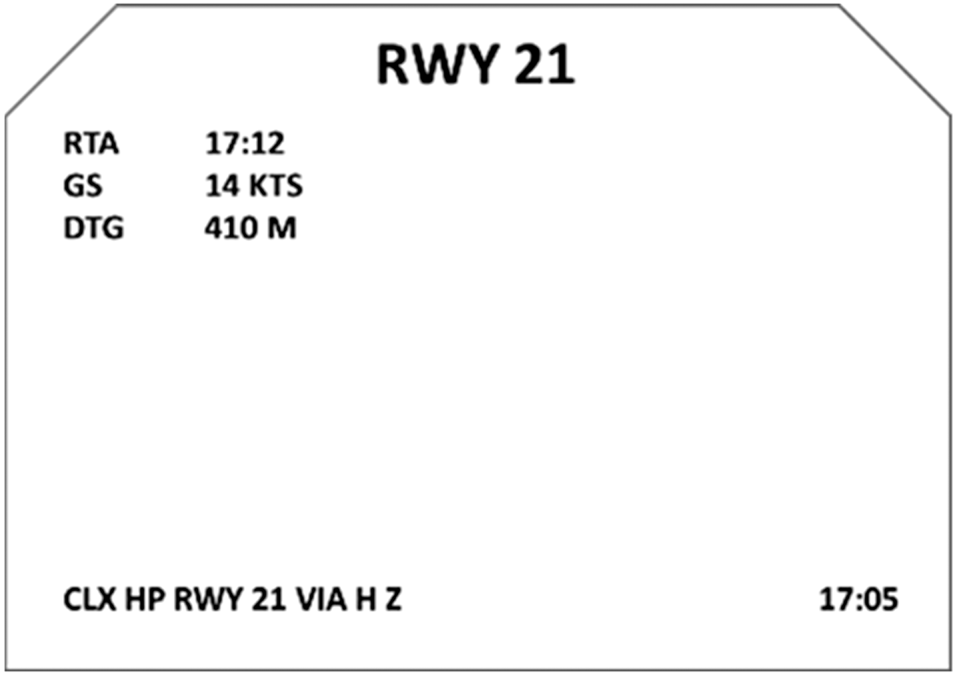
Figure 3. HUD 1
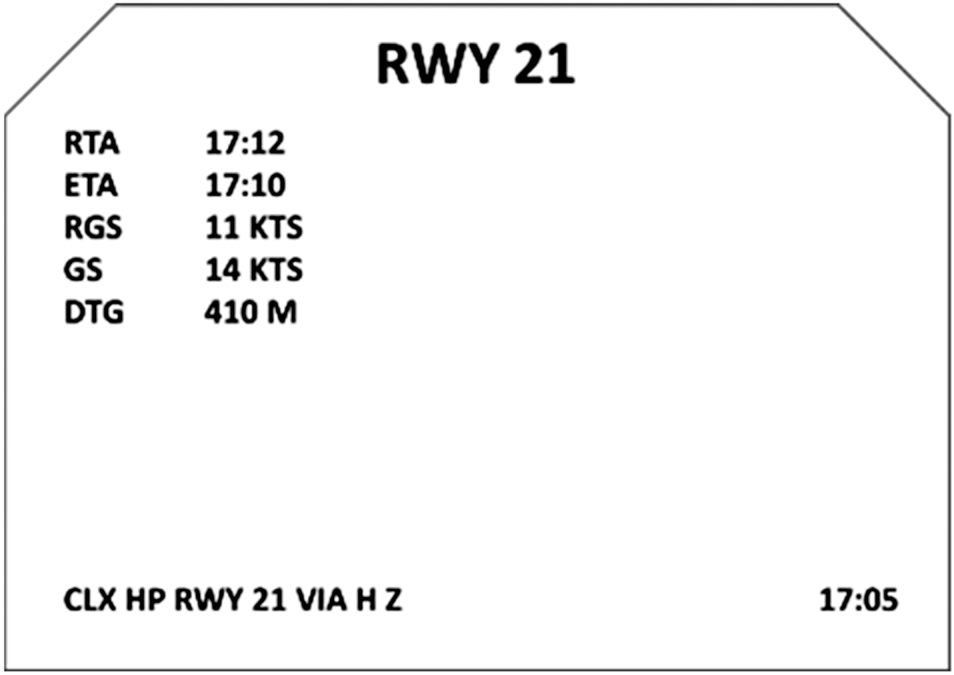
Figure 4. HUD 2
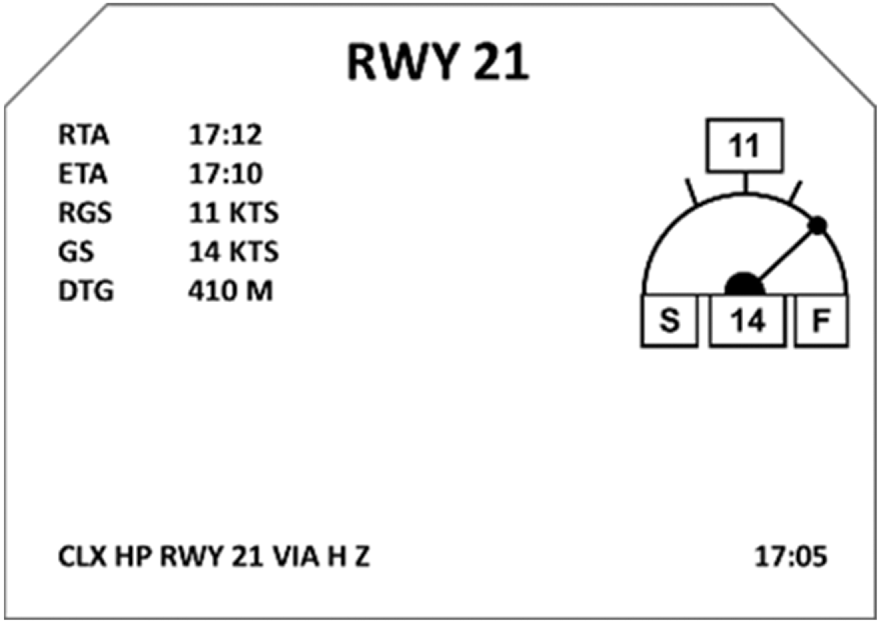
Figure 5. HUD 3
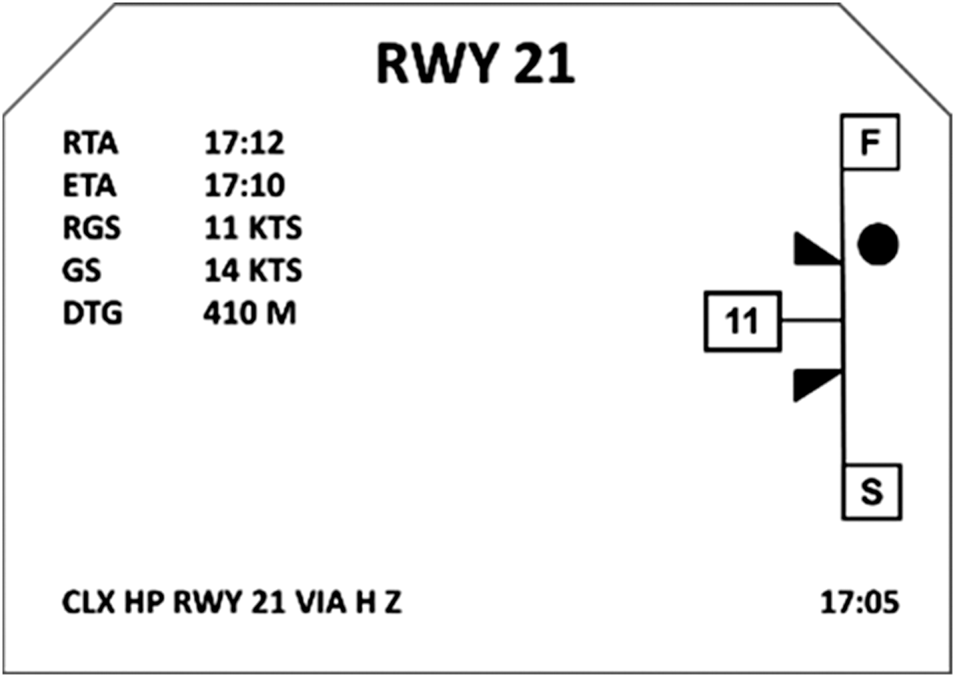
Figure 6. HUD 4
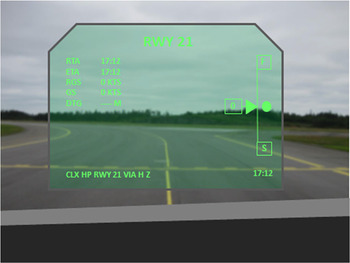
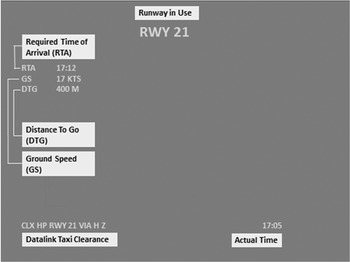
HUD 1 (Figure 3) reflected basic support, displaying descriptive alpha-numerical information. Alpha-numerics were used to display required time of arrival (RTA) in hour/minute format, ground speed (GS) in knots, and distance to go (DTG) in metres. In addition, actual time in hour/minute format, runway in use and a taxi clearance were also displayed.
HUD 2 (Figure 4) displayed descriptive alpha-numerical information as in HUD 1. However, it was also augmented by predictive information on estimated time of arrival (ETA) in hour/minute format and required ground speed (RGS) in knots to support CTOT compliance. The combination of descriptive and predictive information can reduce cognitive workload (Meister, Reference Meister1985), provide redundancy and increase vigilance (Lewis et al., Reference Lewis, Kelland and Kupke1990), as well as increase the level of situational awareness (Foyle et al., Reference Foyle, McCann and Shelden1995; Proctor, Reference Proctor1999, Reference Proctor2000).
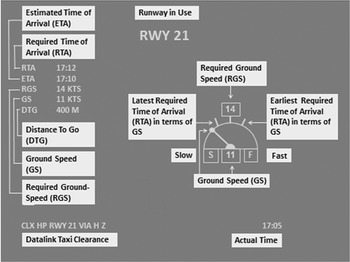
HUD 3 (Figure 5) provided redundancy where alpha-numerical and graphical information was displayed simultaneously. Presenting redundant information can improve situational awareness and lower workload result (Howarth and Bullimore, Reference Howarth, Bullimore, Wilson and Corlett2005). However, HUD 3 displayed not only descriptive/predictive information but also graphical information using a semi-circular, fixed index, moving pointer dial GS presentation. The utilisation of scales, dials and tapes with fixed and/or moving pointers can improve flight crew interpretation of numeric data (U.S. Department of Transportation, 2014). A circular dial is one of two basic ways to convey quantitative information, the other is by using a tape, where changes are easily detected (Harris, Reference Harris2011). HUD 3 was also based on emergent features (Dashevsky, Reference Dashevsky1964) where alignment of the GS moving point dial with the RGS index vertically allows for quick detection of divergences.
HUD 4 (Figure 6) displayed the same redundant information as HUD 3. However, HUD 4 had a different graphical layout with a fixed index graphical scale, a moving GS ball indication, and a vertical tape presentation. Presenting information using a tape in combination with alpha-numerical characters is effective to determine variables such as speed and altitude (Zhang et al., Reference Zhang, Johnson, Malin and Smith2002). The main disadvantage with the vertical tape presentation is that it is more difficult to detect trends (Zhang et al., Reference Zhang, Johnson, Malin and Smith2002). As with HUD 3, HUD 4 was also based on emergent features. Aligning the GS moving ball with the RGS index horizontally allows for quick detection of divergences.
2.9 Design part 3
All four HUDs were individually superimposed on an actual airport infrastructure digital photograph to mimic a view out of the cockpit window.
2.10 Evaluation part 1
2.10.1 Participants
A sample of 32 pilots of fixed wing aircraft (n = 32) participated in the usability tests. The sample consisted of 24 males and eight females with a mean age of 37 years (SD = 11). The number of flight hours varied between 241 and 17,278 with a mean of 6,610 flight hours (SD = 5,485). Of the participating pilots, 21 had flying as their main occupation while 11 were unemployed or had non-flying employments outside the aviation industry. The 21 employed pilots operated in multi-crew environment flying jet transport aircrafts (Airbus 320 or Boeing 737). Amongst them, 12 pilots were captains holding an ATPL, while the other nine pilots were co-pilots holding a Commercial Pilot Licence. Among the 11 unemployed pilots, seven had successfully completed a type rating for either Airbus 320 or Boeing 737. Furthermore, two of these seven pilots had prior employment experience. The remaining four pilots had no flying experience other than their flight training plus time-building flight hours. All pilots had ratings for instrument flying as well as for multi-engine operations. The nine co-pilots had also written ATPL exams. Of the 21 pilots with an employment, seven were also employed as flight instructors. All pilots held a valid Class 1 Medical Certificate as well as a valid Proficiency Check (PC).
Based on the amount of flight hours, the participants were divided into three groups. Pilot Group 1 (novice pilots) consisted of 10 pilots (six male and four female). They were less experienced pilots with a mean age of 24 years (SD = 3) and with mean of 541 flight hours (SD = 554). In this group, two pilots were employed and eight were unemployed, two pilots were co-pilots and the remainder held no pilot rank since they had not been employed. Pilot Group 2 (semi-experienced pilots) consisted of 10 pilots (eight male and two female). They were experienced pilots with a mean age of 35 years (SD = 3) and with a mean of 5,835 flight hours (SD = 2,393). In this group, eight pilots were employed and two were unemployed, six pilots were captains and two were co-pilots. The two unemployed pilots had previously been employed as co-pilots. Pilot Group 3 (expert pilots) consisted of 12 pilots (10 male and two female) with a mean age of 48 years (SD = 5⋅0) and with a mean of 12,315 flight hours (SD = 3,384). In this group, 11 pilots were employed and one was unemployed; nine were captains and one was co-pilot. The unemployed pilot had previously been employed as a co-pilot.
The flight hour limits, which defines the three pilot groups, were based on aerospace industry common practice and on interviewing flight instructors, pilot recruiting officers and members of approved training organisations. Flight hours prerequisites were subsequently defined. For Pilot Group 1: flight hours for first employment, typically ranging between 250 and 1,500 flight hours. For Pilot Group 2: flight hours for the upgrade from co-pilot to captain, typically around 5,000 flight hours. For Pilot Group 3: extensive flight hour experience as captain, typically above 10,000 flight hours.
2.10.2 Apparatus
At the test session each participant was assigned identical test equipment: a portable personal computer (HP Pavilion Entertainment PC TX 1320 [Windows Vista] with Microsoft PowerPoint 2010, Microsoft Word 2010 and Adobe Acrobat X Pro 2010). They received a pencil, paper and written test instructions. HUD user descriptions, a compilation of acronyms and explanations, and an airport navigation chart were also distributed. The tests were conducted in an office type environment including a desk, a computer, an office chair and a side table.
2.10.3 Experiment design and procedure
At each test session, 60 min were assigned to an introduction. The participants were first asked to read the test instructions for 15 min followed by the test leader reading them aloud for 5 min. The participants were then asked to fill in a form regarding basic data such as age, sex and flying background for 10 min. User descriptions (Appendix Figures A2–A5) and acronyms/explanations (Appendix Table A2) for the HUDs were then studied for 30 min followed by a 5 min break.
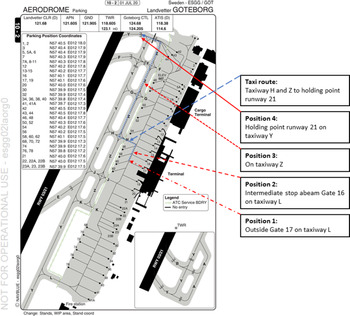
The evaluation task was to assess simulated aircraft taxi supported by HUD 1–4, one at a time. A four-picture slide show (Figures 7–10) termed Taxi-run 1–4 showed four fixed positions (Position 1–4) of the apron and taxiways on Gothenburg Landvetter airport (ESGG/GOT), Sweden, for each HUD (Appendix Figure A6). Simulated outside conditions were daytime with good visibility. Each of the four HUDs was superimposed on a synthetic cockpit forward view of the airport infrastructure. The forward view was a combination of the respective HUD, including alpha-numeric characters/symbols (depicted in green monochromatic colour), and actual colour photographs from the airport infrastructure. A 12⋅1 in. (307 mm) PC colour screen placed on a desk with a display–eye distance of 500 mm and with a participant posture compliant with design eye position (DEP), head motion box and field of view (FOV) were used during the test sessions. In order to achieve visual clarity, the HUD's elements were not collimated with the background; instead, the background was blurred at a 25% level.
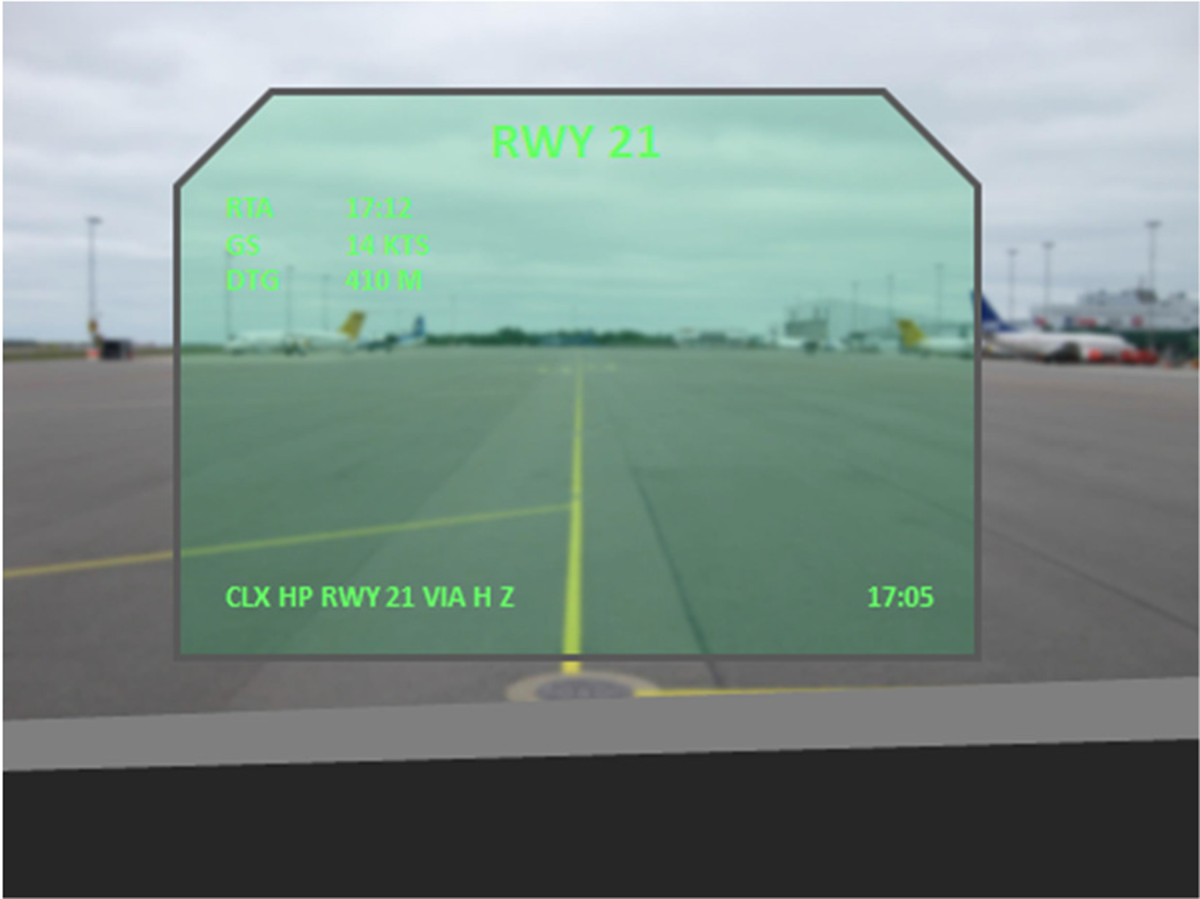
Figure 7. Example: HUD 1, Position 1
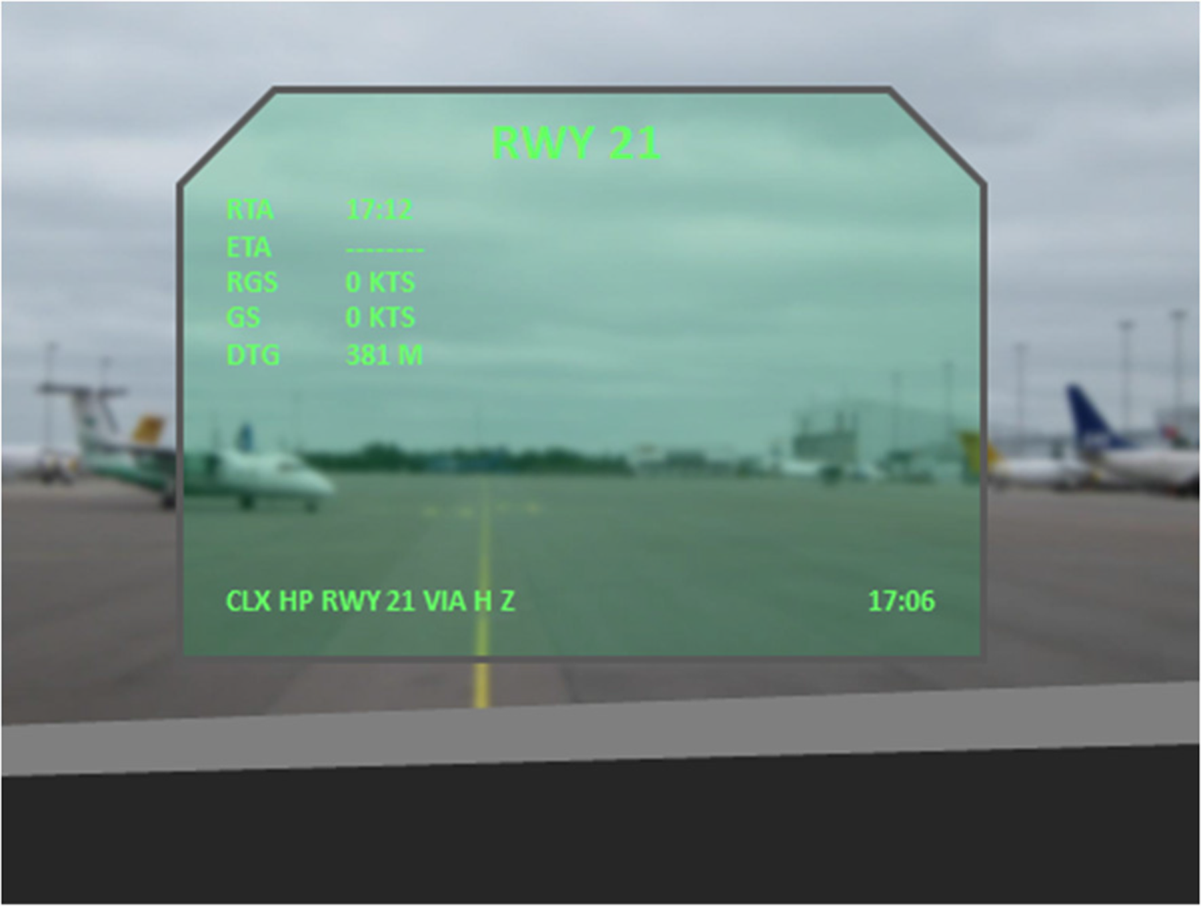
Figure 8. Example: HUD 2, Position 2
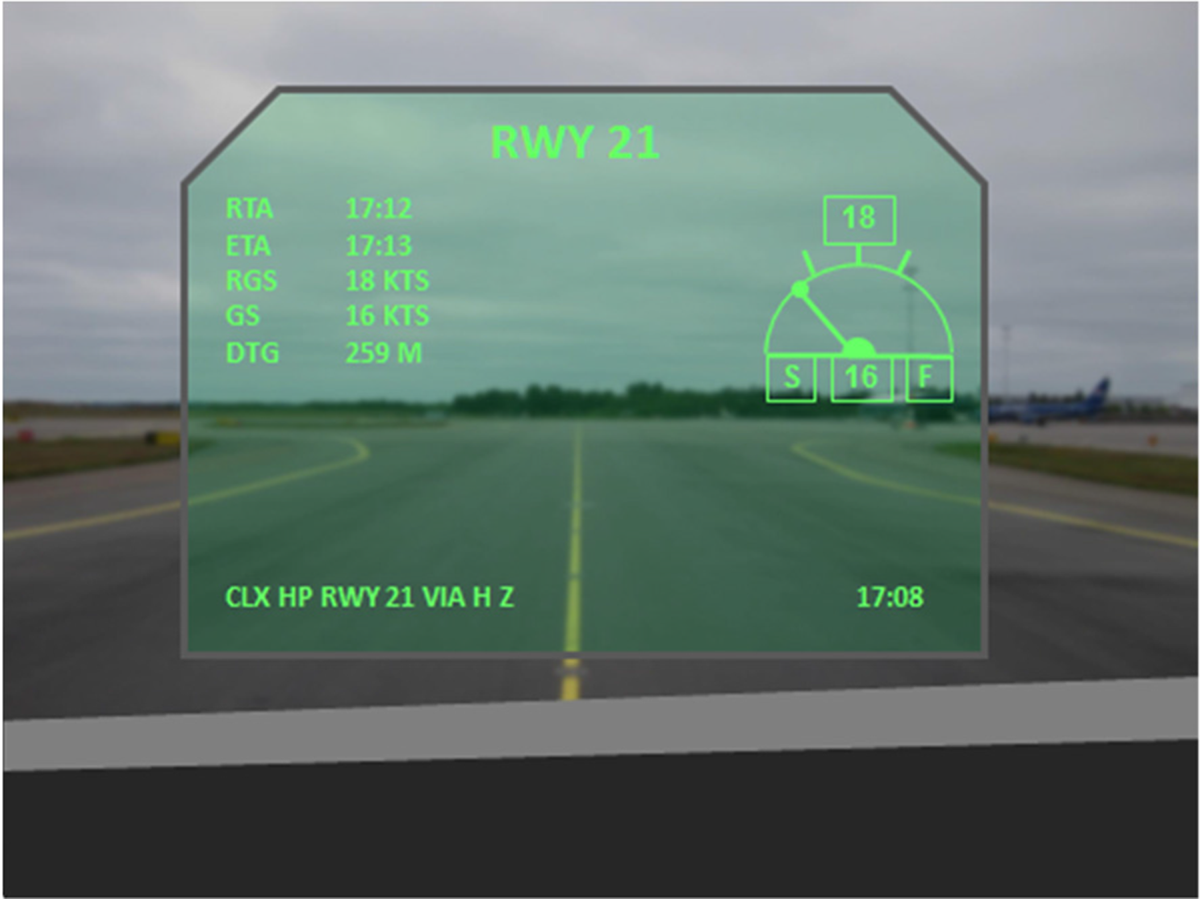
Figure 9. Example: HUD 3, Position 3
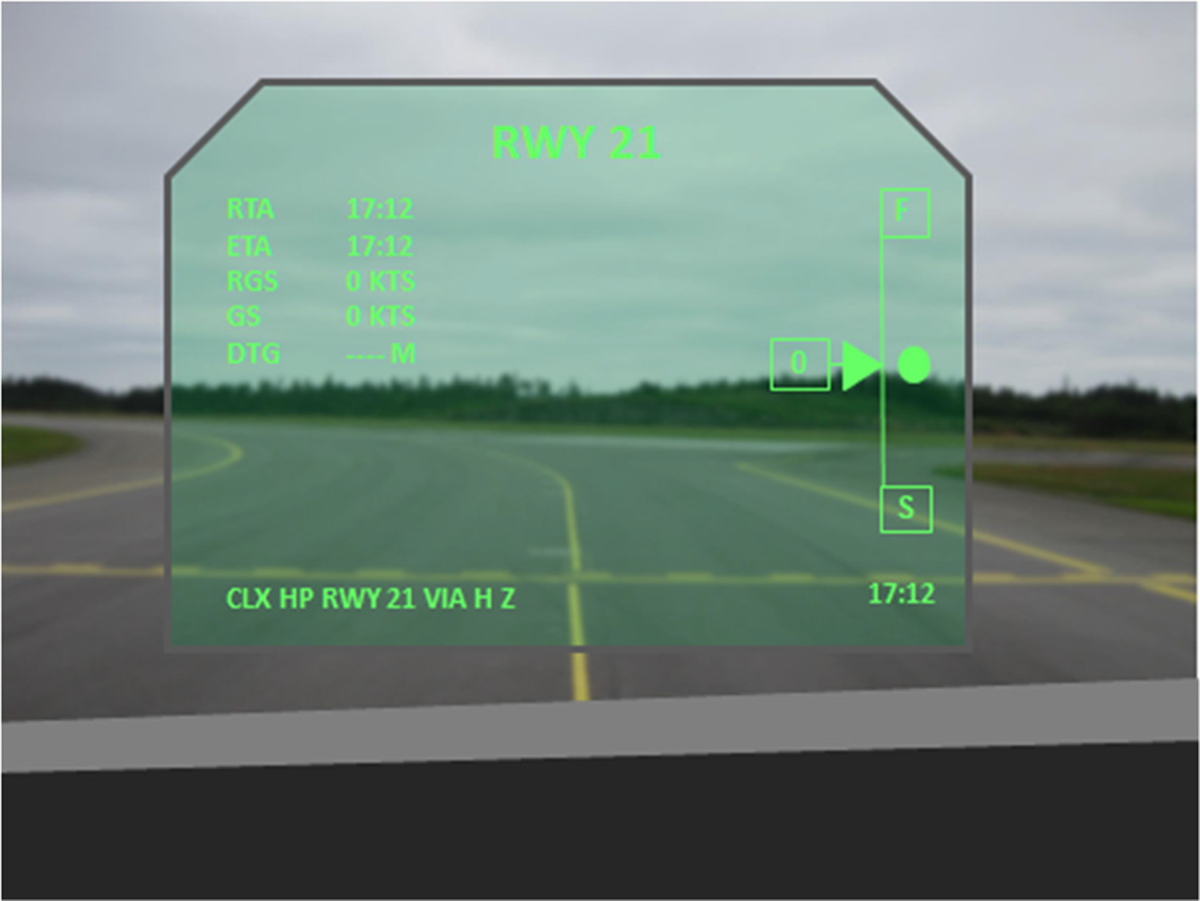
Figure 10. Example: HUD 4, Position 4
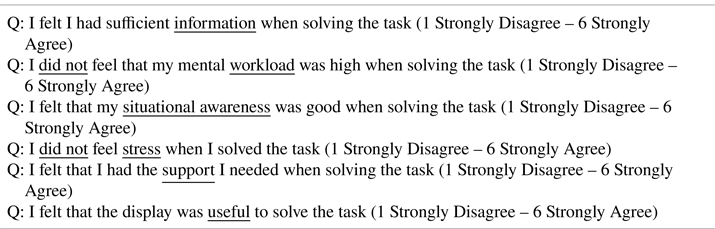
The test was initiated by positioning the participant outside airport Gate 17 on the apron followed by the initiation of one of four taxi-runs. Each taxi-run had an identical route performed with HUD 1–4 randomly swapped to minimise the risk of learning effects. Each taxi-run had a duration of 4 min with the respective HUD displayed. Between each position, the PC screen was dark for 1 min as well as before and after the trial. The slideshow was automatically set to keep these time limits. Helton et al. (Reference Helton, Hollander, Warm, Tripp, Parsons, Matthews, Dember, Parasuraman and Hancock2007) and Teichner (Reference Teichner1974) suggest that reduced vigilance may occur between the first 5 and 15 min in test situation. To reduce the risk of vigilance challenges during the taxi-runs, a 5 min break was included between each taxi-run. After each taxi-run a two-page questionnaire was completed. The questionnaire was designed to gather self-assessments on the six themes (information, workload, situational awareness, stress, support and usability) derived from the definition part of the study. A six-point ordinal Likert scale with self-assessments (strongly disagree, disagree, slightly disagree, slightly agree, agree and strongly agree) on each theme, was used (Table 1).
Table 1. Summary of the self-assessment questions in the post-taxi-run questionnaire
2.11 Evaluation part 2
2.11.1 Data analysis
A two-tailed Wilcoxon paired-sample test (Matlab R2015b, MathWorks BV) was therefore used to enable pair-wise comparisons on 6(Variables), 4(HUDs), and 3(Pilot Groups) for each of the four HUDs. Since several pair-wise comparisons were performed simultaneously (108 in total) on the single data set, a Bonferroni correction test was performed to reduce the risk of results incorrectly appearing as statistically significant. The test showed that a significance level of 5% required a critical probability value of p < 0⋅00046. Due to the explorative design of the evaluation, this conservative p-value was omitted. The results are reported as differences and not as evidences. For this critical p-value a sample size of n = 32, with the power set to 0⋅8, was considered adequate (Sandelowski, Reference Sandelowski1995). Stress and workload were reversed, to keep the questionnaire consistent, since a high self-assessment median equals an unfavourable outcome and a low self-assessment median equals a favourable outcome.
3. Results
The results are presented as differences in median values (M) between all HUDs for all pilots, as significant p-values, and as critical W-values (Table 2) as well as differences in median values between all pilots for each HUD (Figure 11). Section 3.1–3.6 below expands on the results.
Table 2. Summary of W-values, probabilities, and medians for a two-tailed Wilcoxon paired-sample test on self-assessment variables for HUD 1–4 and Pilot Group 1–3
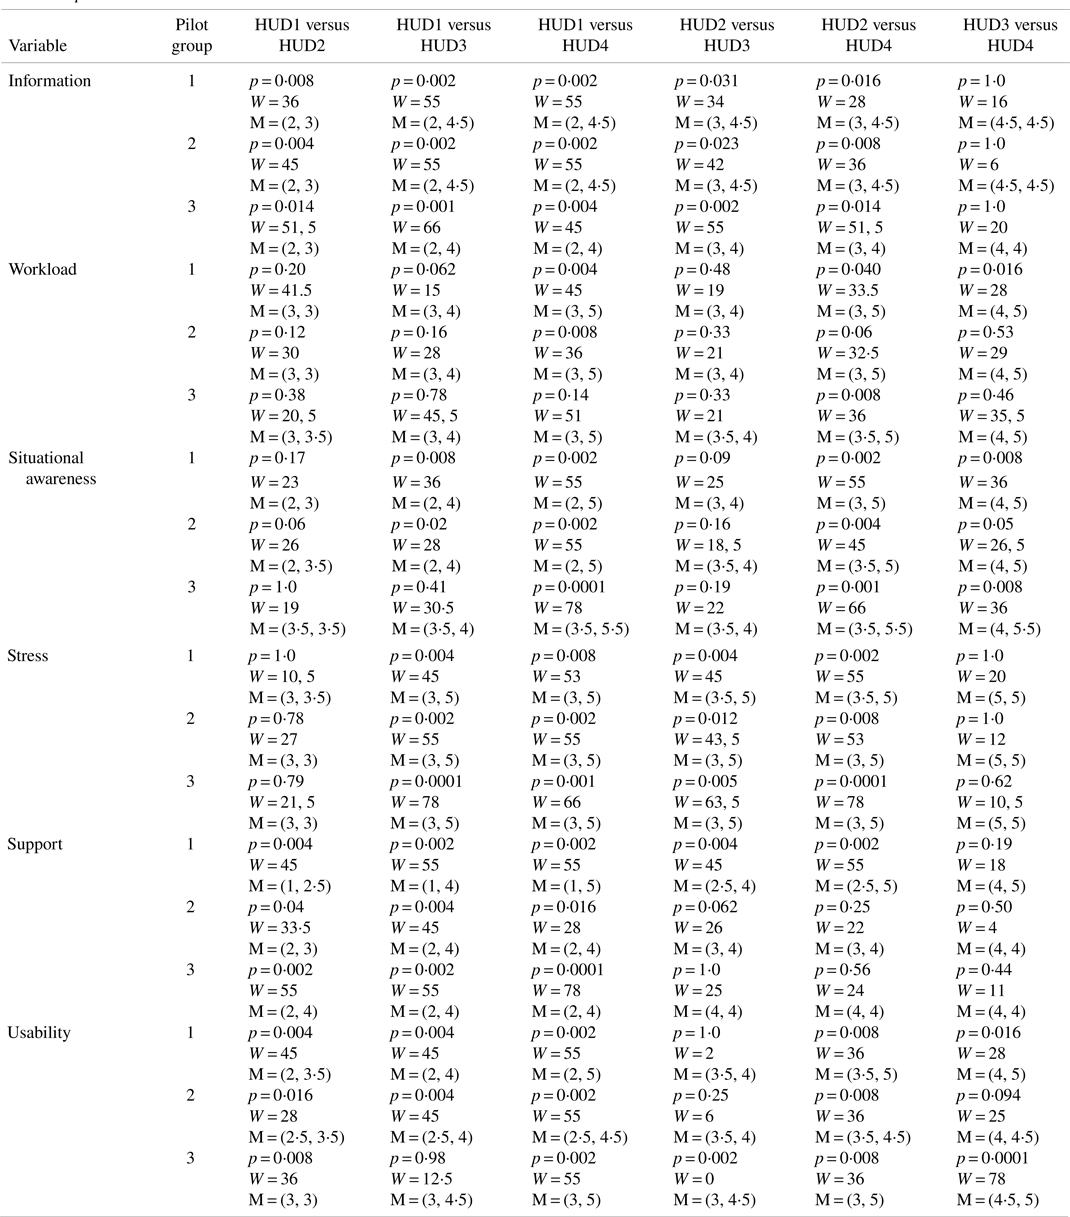
Note. p-values in Table 2 were not adjusted for multiple pair-wise comparisons. A critical probability value of p < 0⋅00046 was calculated using a Bonferroni correction test. Due to the explorative design of the evaluation this moderate p-value was omitted. A conservative 5% level of significance (p < 0⋅05) was consequently selected for the interpretation of the results. However, as can be seen in the table above, several W-values on the 1% level of significance (p < 0⋅01) are present. HUD 1 = Descriptive alpha-numerical; HUD 2 = Descriptive, predictive, alpha-numerical; HUD 3 = Descriptive, predictive, alpha-numerical, graphical, semi-circular; HUD 4 = Descriptive, predictive, alpha-numerical, graphical, vertical tape.
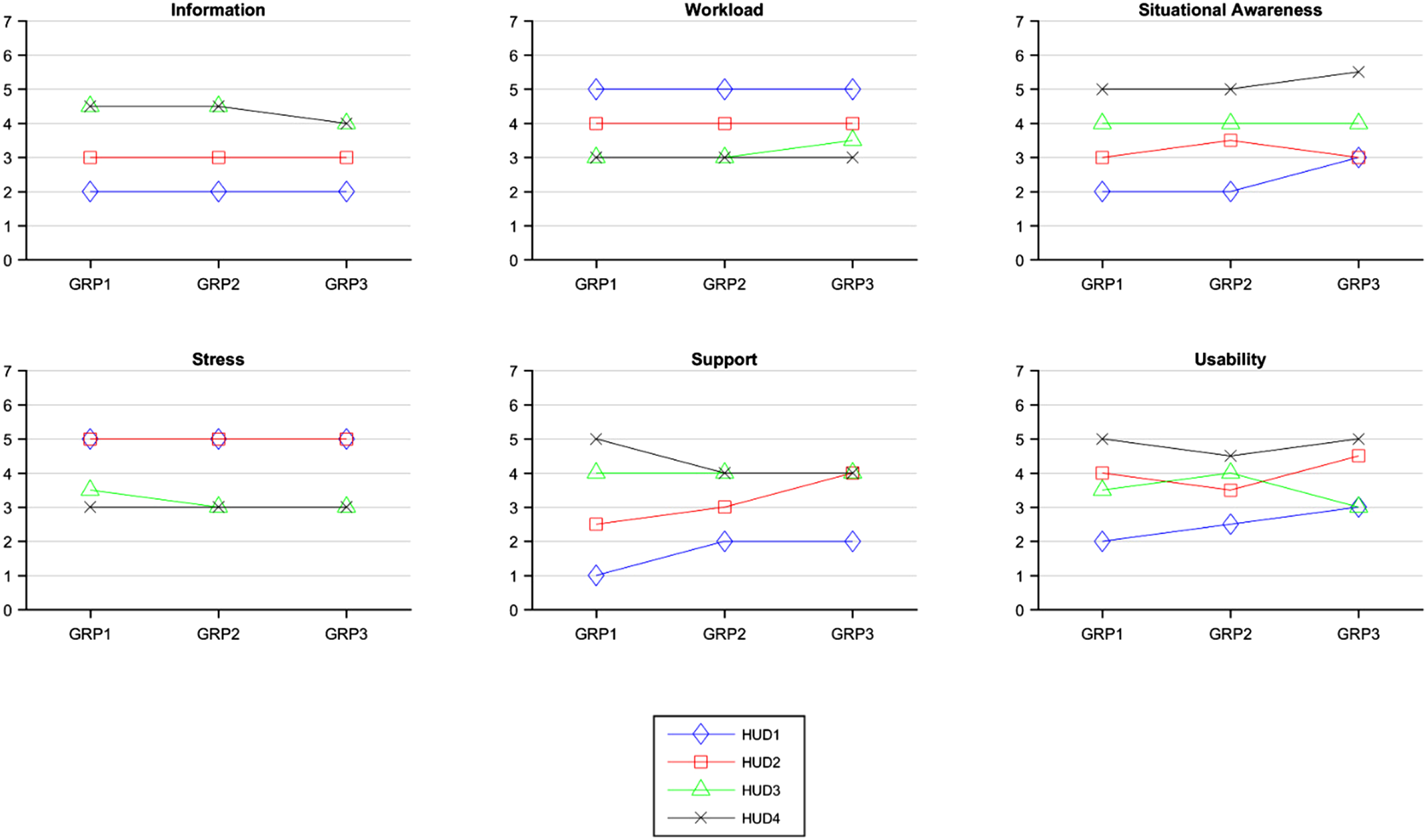
Figure 11. Self-assessment medians for Pilot Group 1–3 on HUD 1–4. Note: For variables Workload and Stress, a lower median value is favourable
3.1 Information
Differences were found between HUD 1–3 for all pilots but when comparing HUD 3 with HUD 4 this was not the case. All pilots ranked the two graphical displays (HUD 3 and HUD 4) higher compared with the non-graphical HUD 1 and HUD 2. The graphical design as such did not make any difference. Displays providing predictive/descriptive information (HUD 2–4) were preferred over the descriptive only display (HUD 1). Displaying descriptive/predictive information in combination with graphical information was ranked high by all the pilots.
3.2 Workload
Differences were found between HUD 1 and HUD 4 only for novice and semi-experienced pilots. A difference was also found between HUD 2 and HUD 4 but only for novice and expert pilots. All pilots ranked the two graphical displays (HUD 3 and HUD 4) higher compared with the non-graphical HUD 1 and HUD 2. Differences were also found between HUD 3 and HUD 4 but only for novice pilots. Expert pilots ranked the semi-circular graphical display lower than the vertical tape display. Displaying descriptive/predictive information in combination with graphical information was ranked high by all pilots.
3.3 Situational awareness
Differences were found for novice and semi-experienced pilots between HUD 1 and HUD 3, for all pilots between HUD 1 and HUD 4, between HUD 2 and HUD 4, and between HUD 3 and HUD 4. No difference was found between HUD 1 and HUD 2 or between HUD 2 and HUD 3. All pilots ranked graphical displays higher compared with the non-graphical displays. Furthermore, expert pilots ranked HUD 1 and HUD 2 equally low. Displaying descriptive/predictive information in combination with graphical information was ranked high by all pilots.
3.4 Stress
Differences were found for all pilots between HUD 1 and HUD 3, between HUD 1 and HUD 4, between HUD 2 and HUD 3, and between HUD 2 and 4. No difference was found between HUD 1 and HUD 2 and between HUD 3 and HUD 4. Again, the two graphical displays were ranked higher by all pilots but neither of the two displays was preferred when compared with each other. All pilots ranked HUD 1 and HUD 2 equally low. Displaying descriptive/predictive information in combination with graphical information was ranked high by all pilots.
3.5 Support
Differences were found for all pilots between HUD 1 and HUD 2, between HUD 1 and HUD 3, and between HUD 1 and HUD 4. A difference was found only for novice pilots between HUD 2 and HUD 3 and between HUD 2 and HUD 4. Again, the two graphical displays were ranked higher by all pilots but neither of the two displays was preferred when compared with each other. Expert pilots ranked HUD 2, HUD 3 and HUD 4 equally high.
3.6 Usability
Differences were found for all pilots between HUD 1 and HUD 2, between HUD 1 and HUD 4, and between HUD 2 and HUD 4. Differences were also found between HUD1 and HUD 3 but only for novice and semi-experienced pilots, between HUD 2 and HUD 3 only for expert pilots, and between HUD3 and HUD 4 for novice and expert pilots. The graphical vertical tape display (HUD 4) was ranked higher by all pilots. The descriptive/predictive only display (HUD 2) was ranked higher than HUD 3 by novice and expert pilots but not by semi-experienced pilots who ranked HUD 3 higher than HUD 2.
4. Discussion
In the present evaluation the methods of evaluating HUD 1–4 were based on subjective self-assessments from six-point Likert scale questionnaires and interviews, all adjusted to match the simulated taxi-runs. The purpose of the study was to evaluate which information provided the best support by collecting self-assessments on six variables. Based on the prerequisites of the evaluation (non-flight simulator, self-assessments), inferential interpretations must be used cautiously, especially for workload, stress and situational awareness. Statistical significance for these variables shall therefore be regarded more as an indication.
When assessing workload, no specific factor is a reliable measurement. Therefore, a SWAT (subjective workload assessment technique) is useful since it contains a multidimensional scale (Wilson and Corlett, Reference Wilson and Corlett1995). The three self-assessment steps (minimal, average, maximal) in the SWAT scale constitute a risk of selecting the middle level, thus avoiding an active choice (Karlsson et al., Reference Karlsson, Osvalder, Rose, Eklund, Odenrick, Bohgard, Karlsson, Lovén, Mikaelsson, Mårtensson, Osvalder, Rose and Ulvengren2009). A six-point (even) Likert scale however rules out the average option thus forcing an active choice (Karlsson et al., Reference Karlsson, Osvalder, Rose, Eklund, Odenrick, Bohgard, Karlsson, Lovén, Mikaelsson, Mårtensson, Osvalder, Rose and Ulvengren2009). In addition to the SWAT, the NASA-TLX (NASA Task Load Index) method assessing cognitive and physiological demands can be used (Hart and Staveland, Reference Hart, Staveland, Hancock and Meshkati1988). NASA-TLX is similar to SWAT but also measures physiological dimensions, a variable not applicable for the present evaluation. Both methods require extensive pre-test preparations as well as concluding post-test efforts, for researchers as well as for participants. The resources for the study at the time did not match these required efforts.
Stress can be measured by heart rate (Regula et al., Reference Regula, Socha, Kutílek, Socha, Hána, Hanáková and Szabo2014), perspiration (Torrente-Rodríguez et al., Reference Torrente-Rodríguez, Tu, Yang, Min, Wang, Song, Yu, Xu, Ye, IsHak and Gao2020), finger temperature (Oka et al., Reference Oka, Oka and Hori2001) or cortisol levels (Selye, Reference Selye1950), however, these require laboratory equipment, surveillance and means of evaluating the observations.
Situational awareness can be assessed by freeze probe techniques (Endsley, Reference Endsley1995) using e.g., SAGAT (Situation Awareness Global Assessment Technique) (Endsley, Reference Endsley, Parasuraman and Mouloua1996) or self-rating tools such as SART (Situation Awareness Rating Tool) (Taylor, Reference Taylor1990). SAGAT uses objective measurements, where system status is compared with operators’ assessments of the situation, while SART uses subjective measurements. Both tools are commonly used in simulator trials. However, since SAGAT requires freezes (where the displays go blank) in the simulation and the present evaluation consisted of freezes only it was deemed not suitable. SART collects operator assessments, usually post-trial. Collecting assessments post-trial can have adverse effects on these assessments due to poor recall or confounding with other variables such as workload (Salmon et al., Reference Salmon, Stanton, Walker, Jenkins, Ladva, Rafferty and Young2009).
Information and support can be measured by completion rates, e.g., where effectiveness, efficiency and satisfaction is assessed by fail/pass compared with accomplishing set goals (ISO, 2016). The present evaluation contained no set goals in terms of accomplishing a task but only to assess if the HUDs were perceived useful as such.
Usability can be assessed by, e.g., task success rate (Nielsen, Reference Nielsen2001), which relates the number of successful attempts with the number of attempts, or by task completion time using an analysis of variance between task completion times (Tullis and Albert, Reference Tullis and Albert2008). Usability was therefore evaluated by self-assessments and not objective measurements in the present evaluation.
The detection and the discrimination of displayed information can be improved by using different shapes, colours and sizes (Howarth and Bullimore, Reference Howarth, Bullimore, Wilson and Corlett2005). When assessing the two HUDs with combined graphical and alpha-numerical information, the pilots’ self-assessments for stress, workload, situational awareness and support were positive. The HUDs’ presentation of redundant information can explain this result (Howarth and Bullimore, Reference Howarth, Bullimore, Wilson and Corlett2005). However, for some pilots this was not the case, since stress and workload increased. This can be caused by differences in experience, training and perception, and is an indication that individual pilot performance may differ from crew performance. In fact, the concept behind a multi-crew is based on the combined performance of the crew and not on the individual pilot. Furthermore, it was found that displaying both descriptive as well as predictive information was a preferred condition of display properties. This finding is consistent with Meister (Reference Meister1985), who suggested that such properties can reduce cognitive workload. Lewis et al. (Reference Lewis, Kelland and Kupke1990) also suggest that redundancy as well as a decreased need for vigilance is a result of such a presentation. Redundancy may explain the good ratings for HUD 3 and 4 since they contained descriptive, predictive and alpha-numerical information combined with graphical information.
The four HUDs were designed and evaluated from an expert-novice perspective. The reason for this is the ever-changing composition of cockpit crew, e.g., pilots with different expertise, variations in cognitive and sensory motor abilities, age and daily form must (at the same time) be able to interact with the proposed HUDs. The outcomes from this study also indicate that differences between novice and expert pilots can be resolved by incorporating combinations of graphics, alpha-numeric presentations and intuitive design based on Gestalt laws (Reference WertheimerWertheimer, 1923/1938). Such combinations can cater for more experienced pilots who may use heuristics to a higher extent than novice pilots, who may use calculation as a strategy when interacting with a system. This is in line with research performed by Rasmussen (Reference Rasmussen1983, Reference Rasmussen1985) and the Skills, Rules and Knowledge (SRK) framework.
Experience may however be expressed in several ways. Pilot flight time is a more exact way to estimate flying experience compared with number of years of employment or age. Since pilots must log all flying activities they undertake, using flight time is therefore an easy way to enable comparisons on pilot-experience. Flight time experience has also been consistently found to be a relevant factor in epidemiologic studies of aircraft accident rates (Taylor et al., Reference Taylor, Kennedy, Noda and Yesavage2007) as well as for recruiting purposes. However, flight time as a measurement needs to be further dissected since different flight operations (e.g., high performance jet operations, crop dusting, commercial, military, multi-pilot) have implications for what a flight hour actually contains.
The study indicated that a semi-circular display, compared with a speed-tape design, reduced workload to a greater extent for novice pilots. This can be explained by the previous experience novice pilots have from the beginning of their training in using such gauges, displays and dials.
The lower (better) rating on stress for HUD 3 and 4 is valuable since one of the main advantages of HUDs is increased situational awareness (Foyle et al., Reference Foyle, Andre, McCann, Wenzel, Begault and Battiste1996; Proctor, Reference Proctor1999, Reference Proctor2000). The three variables of stress, information and situational awareness are related since information increases situational awareness and lack of (or abundant) information may decrease situational awareness due to cognitive limitations. Such a situation is disadvantageous and may increase the amount of stress in the cockpit (Wiener, Reference Wiener, Wiener and Nagel1988, Reference Wiener1989; Sarter and Woods, Reference Sarter and Woods1992).
Furthermore, the HUDs developed in this study are per se limited to being an interface for cockpit use. If stakeholders such as pilots and ATC share information by using joint systems, e.g., SMS, such information could be used to present predictions to all pilots and ATC at the same time. Such integrated systems can provide means for improved planning and situational awareness as well as reduced fuel consumption. Additionally, such a system can offer ATC means to manage the traffic flow simply by assigning target speeds direct to taxiing aircraft.
One way of assessing the proposed HUD is to regard it as a demonstrator of a more efficient way of conducting taxi under time limitations. Future studies could include evaluations of task success rate between target speed HUD presentations and non-target speed presentations. Furthermore, the use of HUDs for navigational support (Foyle et al., Reference Foyle, Andre, McCann, Wenzel, Begault and Battiste1996; Cheng et al., Reference Cheng, Andre and Foyle2009) has been assessed and incorporating a target speed presentation as well may present means of resolving both navigation and speed during taxi. Future applications of the HUD also need to meet further requirements since the HUD may similarly be used as flight guidance support. That is, during taxi, the pilot at some point needs to switch the HUD from ground mode to flight mode. An additional application may provide possibilities for the individual pilot to customise the HUD for their personal requirements and techniques.
5. Conclusion
The ground segment (taxi to departure runway) of a 4D flight trajectory is generally controlled by set time constraints. This study aimed to design and evaluate information on a display, to improve time-keeping. Conclusions from focus group interviews with pilots as well as from prevailing taxi procedures show that pilots generally perform rule-of-thumb estimations built on distance-time-speed calculations when managing taxi speeds. Based on the pilots’ self-assessments on six variables, a graphical vertical tape was proposed with descriptive/predictive HUD presentation including alpha-numerical information on target taxi speeds. Graphical information attracted the participating pilots in the usability test more than alpha-numerical information only. Results from the study also indicated that differences between novice, semi-experienced and expert pilots can be balanced by displaying a combination of alpha-numerical and graphical information, thus providing redundancy. The results from this study could be further elaborated in future research in a flight simulator. In order to derive improved inferential conclusions, self-assessments could be complemented by measurements such as NASA-TLX and SAGAT. Furthermore, evaluating navigational taxi support in combination with taxi target speed support could also be beneficial.
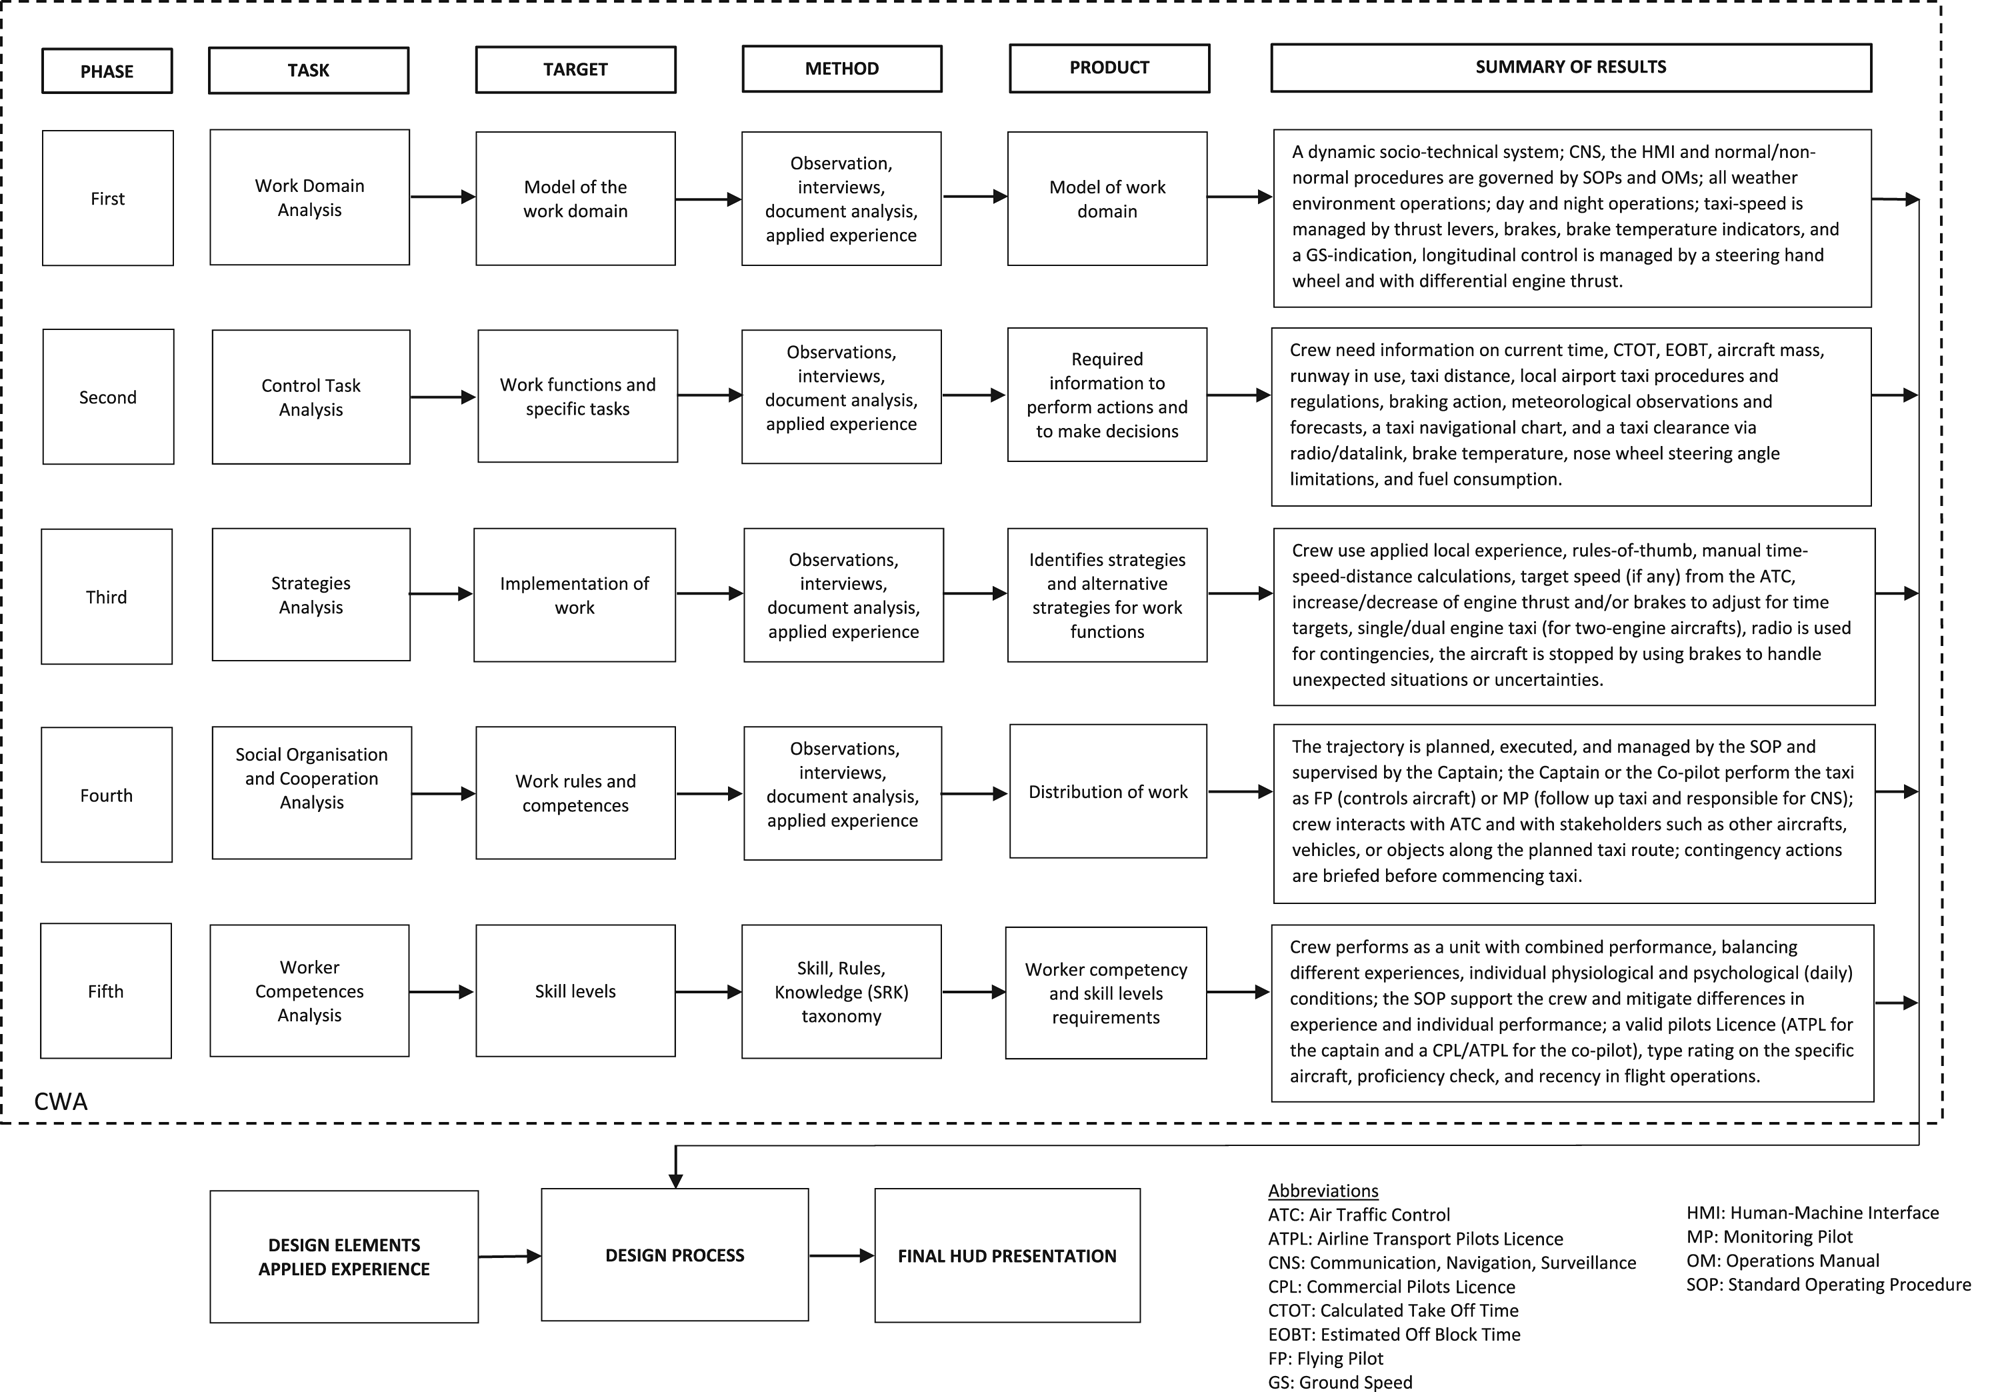
Figure A1. Cognitive work analysis (CWA) adapted from Rasmussen et al. (Reference Rasmussen, Pejtersen and Goodstein1994) and its relation to the design process
Table A1. Overview of the design elements included in the four HUD presentation designs
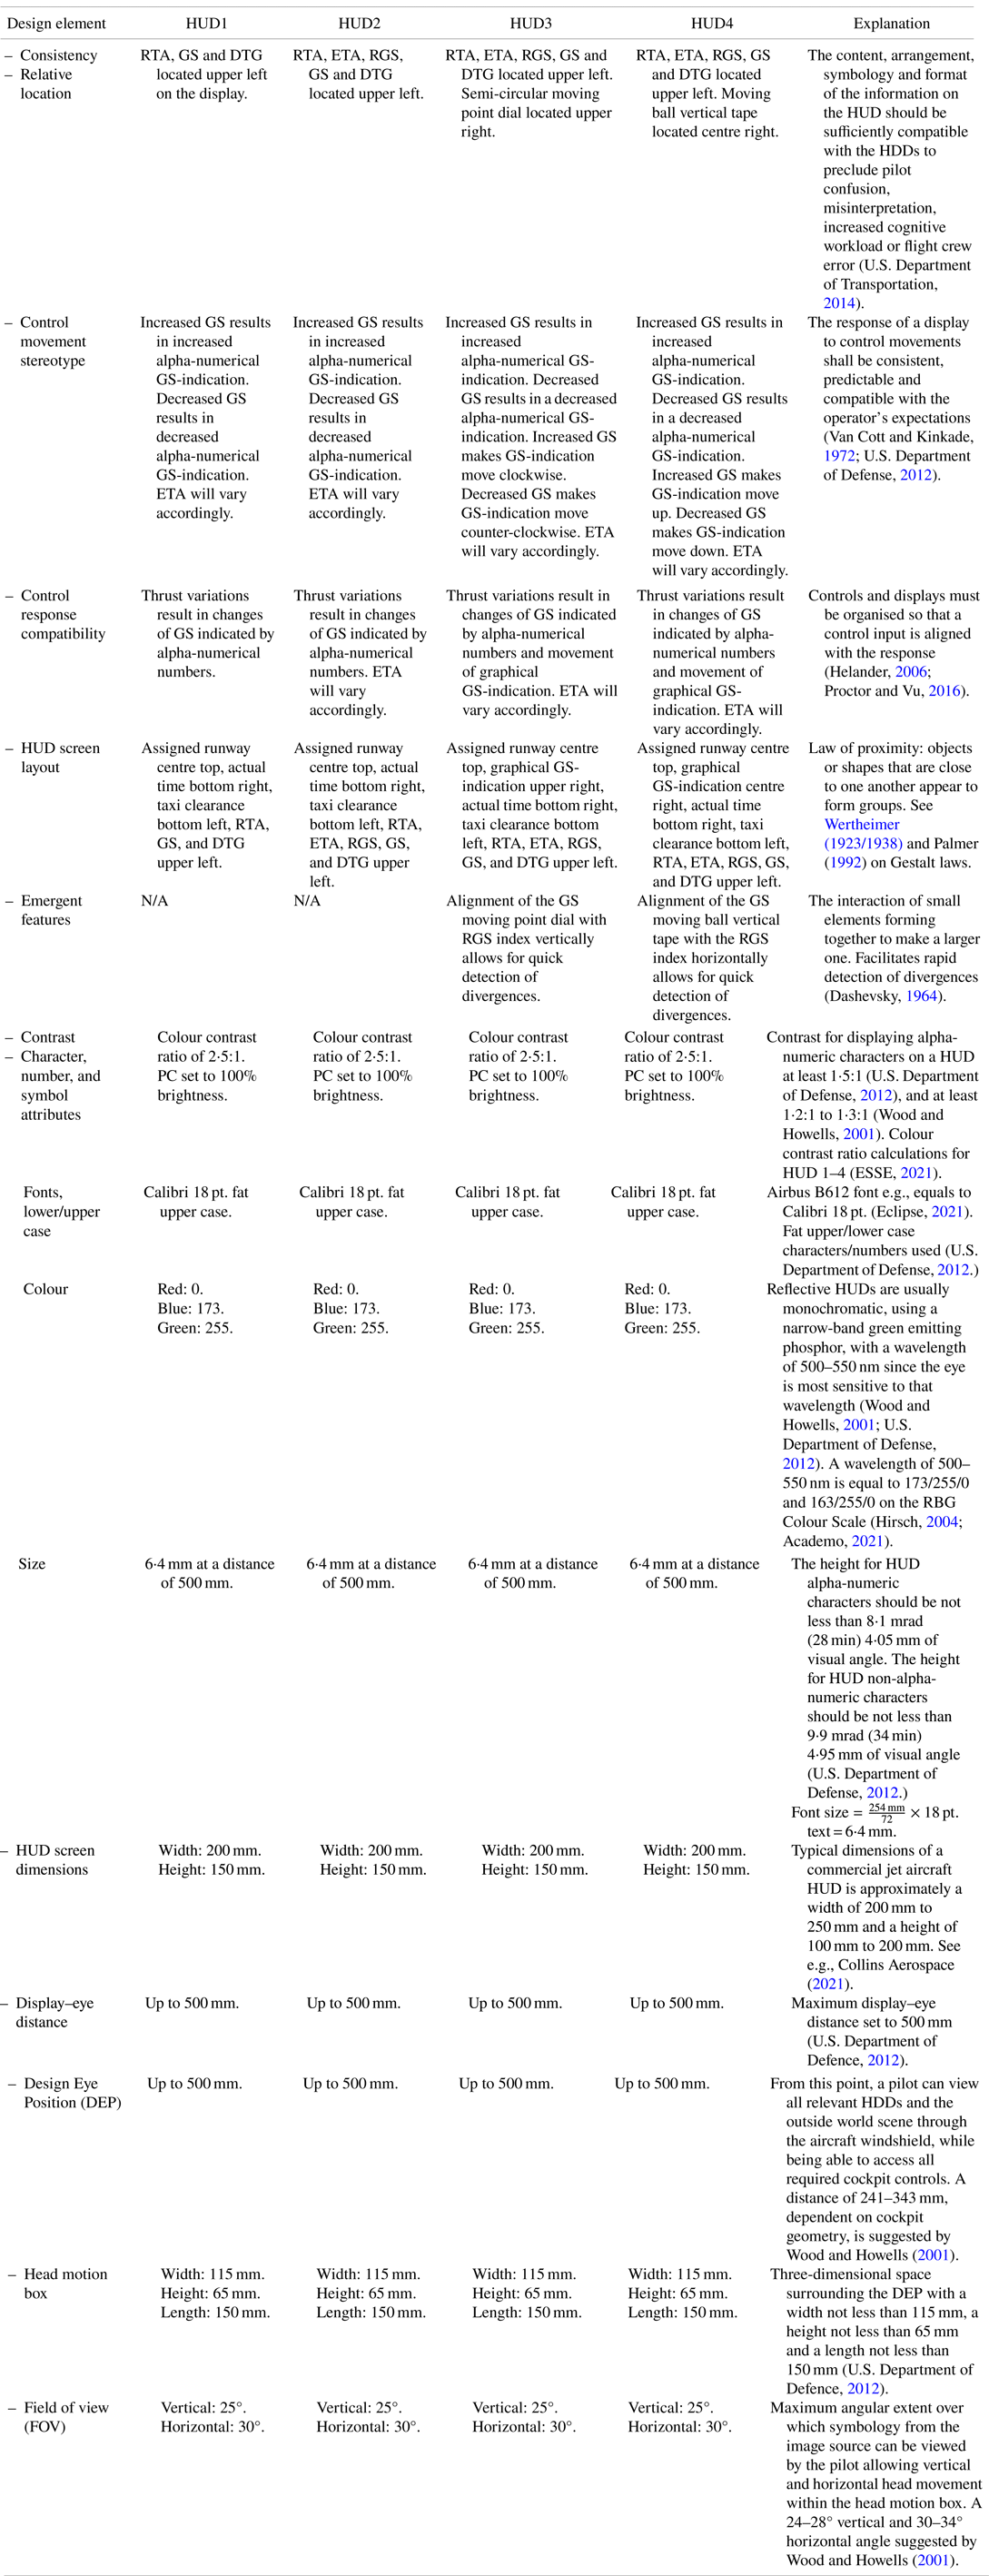
Table A2. Acronyms and explanations for HUD 1–4
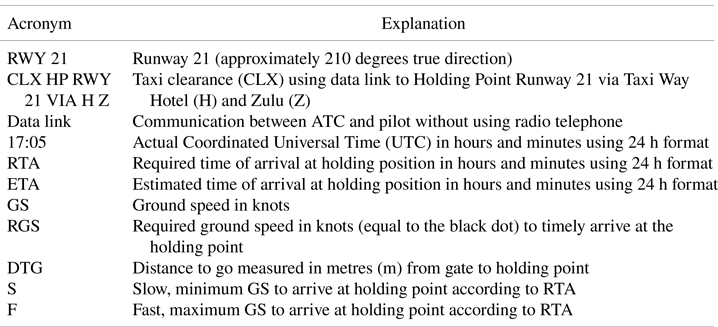
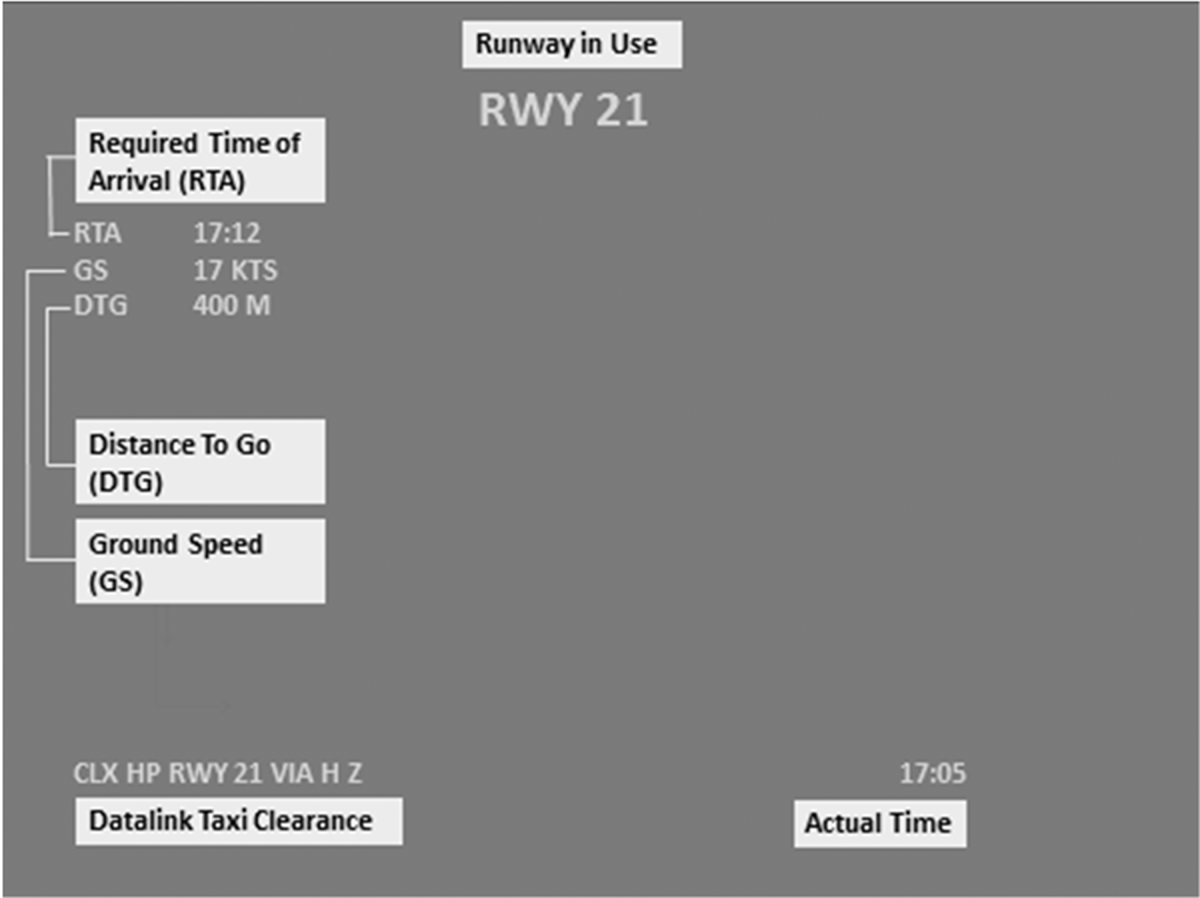
Figure A2. User description of HUD 1
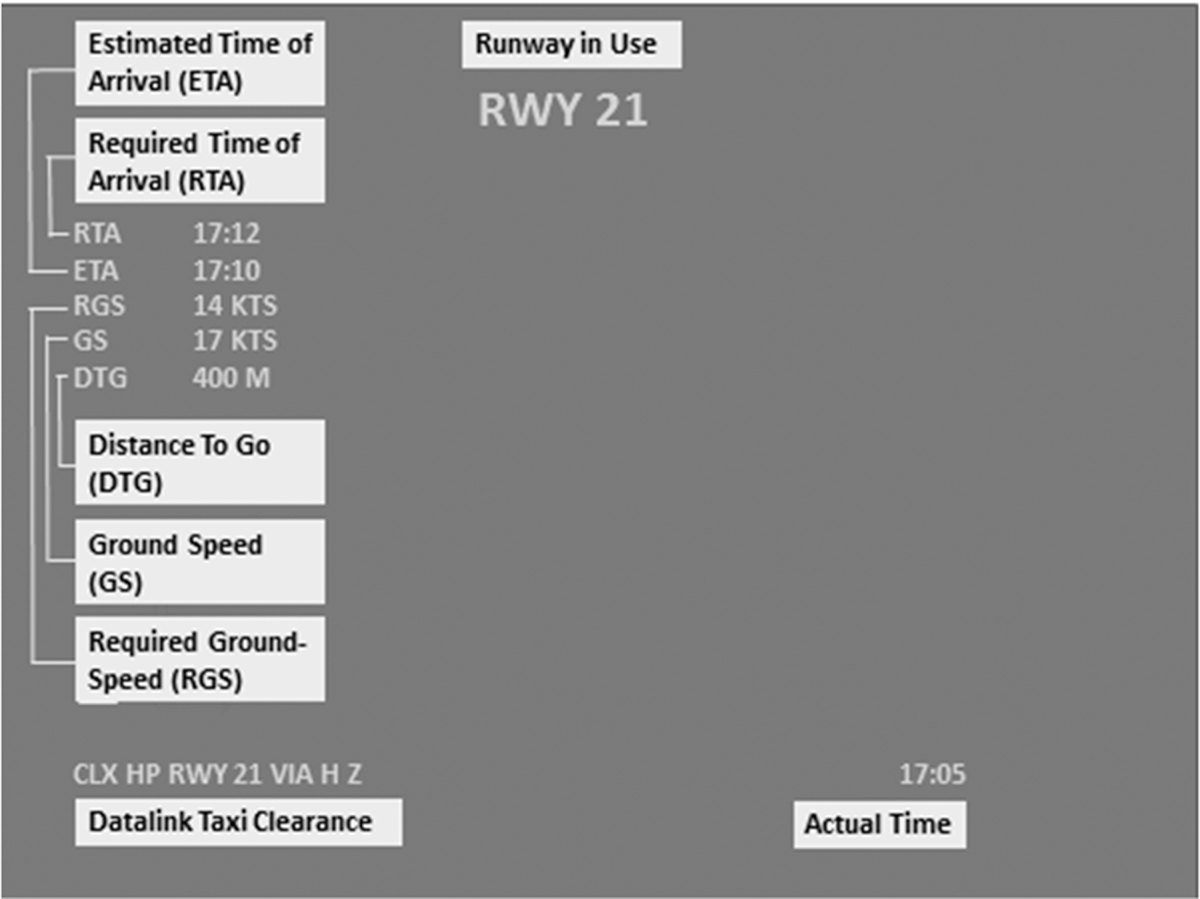
Figure A3. User description of HUD 2

Figure A4. User description of HUD 3
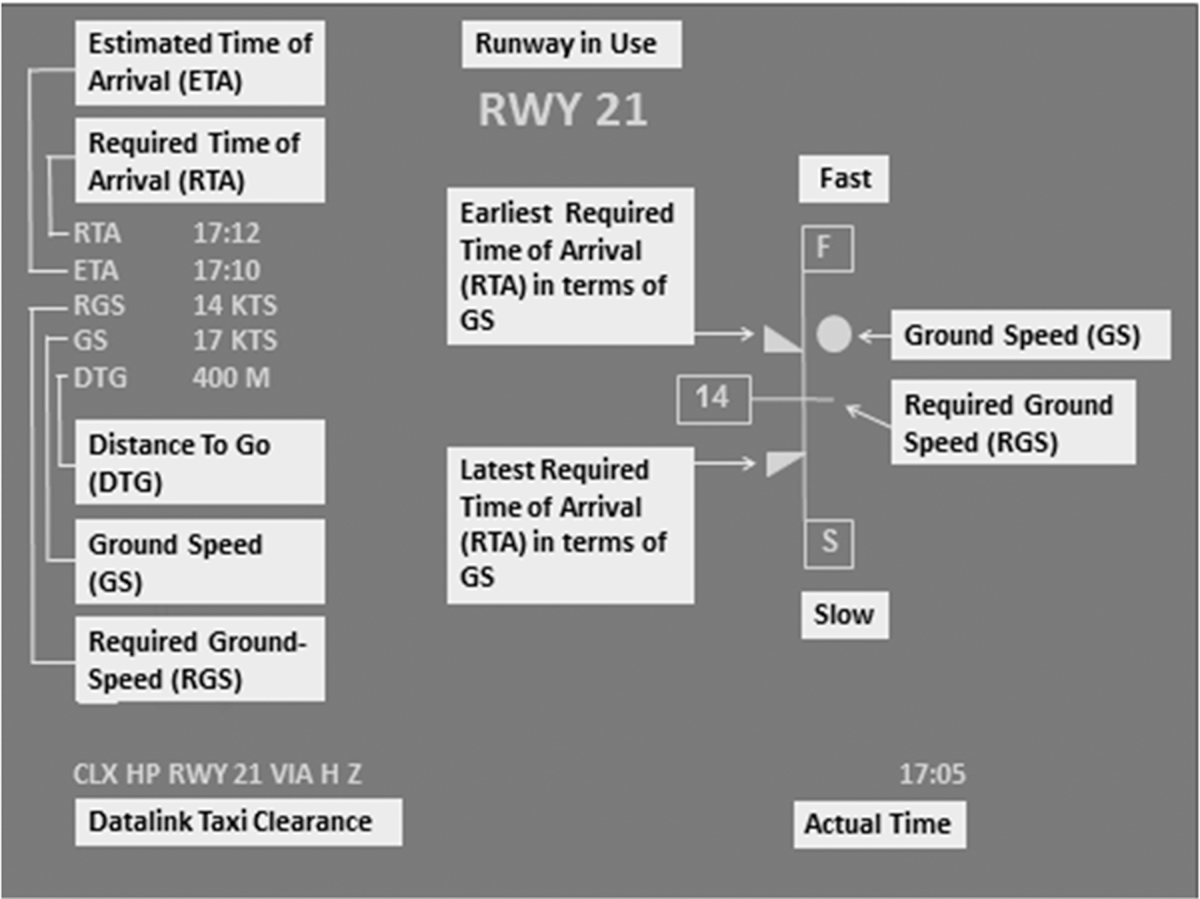
Figure A5. User description of HUD 4

Figure A6. Airport navigation chart for Gothenburg Landvetter airport (ESGG/GOT) including taxi-run Position 1–4 and schematic taxi-route. Note: Chart is not for operational use. Chart date differs from the original chart date. Chart approved for publication by NAVBLUE


 Open access