


Introduction
Oxide ceramics such as alumina, chromia, and zirconia are important materials for cutting tool development mainly due to their high hot hardness, chemical inertness with respect to work piece material, and oxidation resistance [Reference Quinto1]. Thin (1–20 µm) coatings of these materials on a less brittle tool body benefit from otherwise counteracting material properties, yielding highly wear-resistant tools. Using physical vapor deposition (PVD) techniques to deposit these coatings permits lower substrate temperatures than the traditionally used chemical vapor deposition (CVD) and possible residual stress tailoring. PVD therefore allows deposition on temperature-sensitive substrates such as high-speed steels, opening up application areas for oxide coatings not readily accessible by CVD.
An important focus in the context of PVD-coated oxides for cutting tools has been the Al–Cr–O system. The goal has been to stabilize the corundum phase, α-Al2O3, at lower deposition temperatures than in CVD with the help of isostructural α-Cr2O3 [Reference Khatibi, Genvad, Göthelid, Jensen, Eklund and Hultman2, Reference Ramm, Ante, Bachmann, Widrig, Brändle and Döbeli3]. Eskolaite (α-Cr2O3) is one of the hardest naturally occurring oxides, ∼30 GPa (measured with nanoindentation), and has been obtained by sputter deposition [Reference Eklund, Sridharan, Sillassen and Bøttiger4, Reference Hones, Levy and Randall5]. Stabilization of the α-Al2O3 can be done by template growth on, e.g., α-Cr2O3 [Reference Eklund, Sridharan, Sillassen and Bøttiger4, Reference Jin, Xu, Tazawa, Yoshimura, Music, Alami and Helmersson6, Reference Andersson, Czigany, Jin and Helmersson7] or by solid solution alloying of, e.g., α-(Al,Cr)2O3 [Reference Ramm, Ante, Bachmann, Widrig, Brändle and Döbeli3, Reference Ashenford, Long, Hagston, Lunn and Matthews8, Reference Witthaut, Cremer, Reichert and Neuschutz9, Reference Ramm, Ante, Brandle, Neels, Dommann and Dobeli10, Reference Pedersen, Bøttiger, Sridharan, Sillassen and Eklund11, Reference de Abreu Vieira, Döbeli, Dommann, Kalchbrenner, Neels, Ramm, Rudigier, Thomas and Widrig12, Reference Pohler, Franz, Ramm, Polcik and Mitterer13, Reference Diechle, Stueber, Leiste, Ulrich and Schier14]. Another possible phase on α-Al2O3 alloying with Cr is the cubic B1-like vacancy-stabilized structured (Al,Cr)2O3 [Reference Khatibi, Genvad, Göthelid, Jensen, Eklund and Hultman2, Reference Khatibi, Palisaitis, Höglund, Eriksson, Persson, Jensen, Birch, Eklund and Hultman15, Reference Najafi, Karimi, Dessarzin and Morstein16].
ZrO2 exists in several thermodynamically stable crystal structures in its pure form: the room temperature (RT) monoclinic (m) phase, tetragonal from ∼1170 °C, and cubic fluorite from ∼2300 °C [Reference Krogstad, Lepple, Gao, Lipkin and Levi17, Reference Fabrichnaya, Wang, Zinkevich, Levi and Aldinger18, Reference Simeone, Baldinozzi, Gosset, Dutheil, Bulou and Hansen19]. The high-temperature phases are metastable at RT but can become stable through alloying at RT. The tetragonal phase (t) is stabilized by alloying with early transition metal oxides, often Y2O3 [Reference Swab20, Reference Nettleship and Stevens21]. Tetragonal yttria partially stabilized zirconia (YSZ), containing 6–8 wt% of Y2O3, is often used as the principal material for thermal barrier coatings in turbines due to its low thermal conductivity and high toughness [Reference Feuerstein, Knapp, Taylor, Ashary, Bolcavage and Hitchman22, Reference Wang and Zhou23, Reference Vassen, Stuke and Stover24, Reference Mercer, Williams, Clarke and Evans25]. YSZ also often finds its use as implant material owing to its biocompatibility [Reference Soon, Pingguan-Murphy, Lai and Akbar26]. Grain refinement, if below ∼30 nm, is another way of stabilizing tetragonal (t)-ZrO2 even in pure form due to its lower surface energy compared with the monoclinic phase [Reference Baldinozzi, Simeone, Gosset and Dutheil27, Reference Garvie28]. For its ionic conductance, the cubic fluoride (stabilized with >8 wt% Y2O3) form is used as electrolyte in solid oxide fuel cells [Reference Park, Vohs and Gorte29, Reference Minh30, Reference Minh and Mogensen31, Reference Sonderby, Nielsen, Christensen, Almtoft, Lu, Jensen, Nielsen and Eklund32, Reference Sonderby, Christensen, Almtoft, Nielsen and Eklund33] and as material with reversible oxygen storage capacity when alloyed with CeO2 [Reference Song, Moon, Kim, Hong, Lee, Lee, Kim and Kim34, Reference Descorme, Madier and Duprez35].
These common materials are the basis for the motivation for the choice of the Cr–Zr–O system studied here. Replacing Al in the pseudo-binary alloy Al–Cr–O system with Zr yields another material system that may combine the interesting properties of the respective pure oxides. Previous work on the Cr–Zr–O system encompasses bulk mixing [Reference Hirano, Yoshinaka, Hirota and Yamaguchi36], nanoparticles [Reference Ram37, Reference Stefanic, Popovic and Music38], and composite material of Cr2O3 and YSZ [Reference Takano, Komeda, Yoshinaka, Hirota and Yamaguchi39]. α-(Cr,Zr)2O3 solid solution (Zr < 8.5 at%) thin film by reactive radio frequency (RF) magnetron sputtering was also reported [Reference Spitz, Stueber, Leiste, Ulrich and Seifert40], even though Zr is preferably in a Zr4+ (0.72 Å) state and larger than Al3+ (0.535 Å) [Reference Shannon41].
Rafaja et al. [Reference Rafaja, Wüstefeld, Abrasonis, Braeunig, Baehtz, Hanzig, Dopita, Krause and Gemming42] deposited amorphous Cr-rich Cr–Zr–O thin films with up to 15 at.% Zr content and performed in situ synchrotron-based X-ray diffraction (XRD) while vacuum annealing (500–1100 °C). The Zr content in the high-temperature crystallized α-(Cr,Zr)2O3 contained up to 3.2 at.% Zr, while the excess Zr formed tetragonal ZrO2, stabilized by Cr. Coatings deposited with higher Zr content resulted in higher temperature for onset of crystallization and degree of t-ZrO2 phase formation.
In contrast to the as-grown amorphous coatings in this material system, α-phase (Cr,Zr)2O3 solid solution coatings were grown at 500 °C by Spitz et al. [Reference Spitz, Stueber, Leiste, Ulrich and Seifert40]. The thermal stability and microstructural changes of this pseudo-binary oxide system were investigated by vacuum annealing at three different temperatures, 750, 810, and 870 °C, in our previous work [Reference Landälv, Lu, Spitz, Leiste, Ulrich, Johansson-Jõesaar, Ahlgren, Göthelid, Alling, Hultman, Stüber and Eklund43]. The study showed a slight increase in hardness on formation of t-ZrO2 with dissolved Cr after annealing to 810 °C, but the coating decomposed into t-ZrO2 and bcc-Cr on loss of oxygen after annealing to 890 °C. The effect of annealing atmosphere on the coating thermal stability remained unexplored and merits further study.
Therefore, the aim of the present study was to determine the thermal stability and phase evolution of the Cr-rich, Cr0.28Zr0.10O0.61, coating from earlier work [Reference Landälv, Lu, Spitz, Leiste, Ulrich, Johansson-Jõesaar, Ahlgren, Göthelid, Alling, Hultman, Stüber and Eklund43] both in vacuum and in air atmosphere and at higher maximum annealing temperature. The phase evolution during annealing was monitored continuously through in situ XRD at the synchrotron facility, DESY in Hamburg. Using the synchrotron radiation setups, the change in coating crystal structure could be monitored continuously up to a maximum temperature of ∼1140 °C in vacuum and at 975 °C in air. Post-annealing characterization with transmission electron microscope (TEM) and scanning electron microscope (SEM) and nanoindentation hardness measurements corroborated the findings from high temperature XRD, mainly, that better thermal stability was obtained if annealed in air than in vacuum.
Results
Chemical composition and hardness
Table I shows the chemical composition of the coatings in the as-deposited state and after annealing. The chemical composition of the as-deposited coating was measured in the previous study with electron probe microanalysis (EPMA) [Reference Landälv, Lu, Spitz, Leiste, Ulrich, Johansson-Jõesaar, Ahlgren, Göthelid, Alling, Hultman, Stüber and Eklund43] and remeasured in the present work with the top-view energy-dispersive X-ray spectroscopy (EDX). Both methods show that the as-deposited coatings is Cr-rich (Cr,Zr)2O3, close to stoichiometric composition with respect to oxygen. The close compositional agreement between EPMA and EDX strengthens the validity of the EDX analysis of the as-annealed compositions. The results show that the coating annealed in air to 975 °C has the same composition as the as-deposited coating. However, for the coating annealed in vacuum, with 50 °C/min to a maximum temperature of 1140 °C, the Cr/Zr ratio reduced to 0.48 compared with ∼2.9 in the as-deposited state. Also, about 5 at.% reduced oxygen is measured after vacuum annealing, and for 2 at.% Ti, see the discussion for further explanation.
TABLE I: Chemical composition measured with EDX and nanoindentation hardness of the as-deposited and annealed Cr–Zr–O coatings. The compositional balance consist of C and N and traces of Ar based on reference EPMA measurement from Ref. Reference Landälv, Lu, Spitz, Leiste, Ulrich, Johansson-Jõesaar, Ahlgren, Göthelid, Alling, Hultman, Stüber and Eklund43. The standard deviations are ∼0.5 at.% or below for Cr, Zr, and O. C has been omitted for the EDX measurements due to lower than 1 at.% content when measured with EPMA.

The measured nanoindentation hardness, presented in the last column in Table I, yields a value of 19.6 ± 1.9 GPa for the as-deposited coating. The air-annealed sample shows slightly increased average hardness 22.3 ± 2.3 GPa; however, a larger number of invalid curves are observed. In contrast to the air-annealed sample, the vacuum-annealed coating shows a significant drop in hardness to 8.5 ± 1.1 GPa.
TEM and in situ XRD of vacuum-annealed sample
Figure 1 shows in situ X-ray diffractograms acquired during vacuum annealing with a heating rate of 50 °C/min. The most prominent coatings peaks, without substrate overlaps, appeared within d-spacing range of 2.5–4 Å and therefore chosen here from the total acquired 1–5.5 Å range. The short double dotted line, at a d-spacing of 2.7 Å, shows the RT position of the α-(104)-(Cr,Zr)2O3 solid solution peak, as determined in previous work [Reference Landälv, Lu, Spitz, Leiste, Ulrich, Johansson-Jõesaar, Ahlgren, Göthelid, Alling, Hultman, Stüber and Eklund43]. Here, it is shifted to a slightly larger d-spacing due to thermal expansion of the coating at 500 °C.
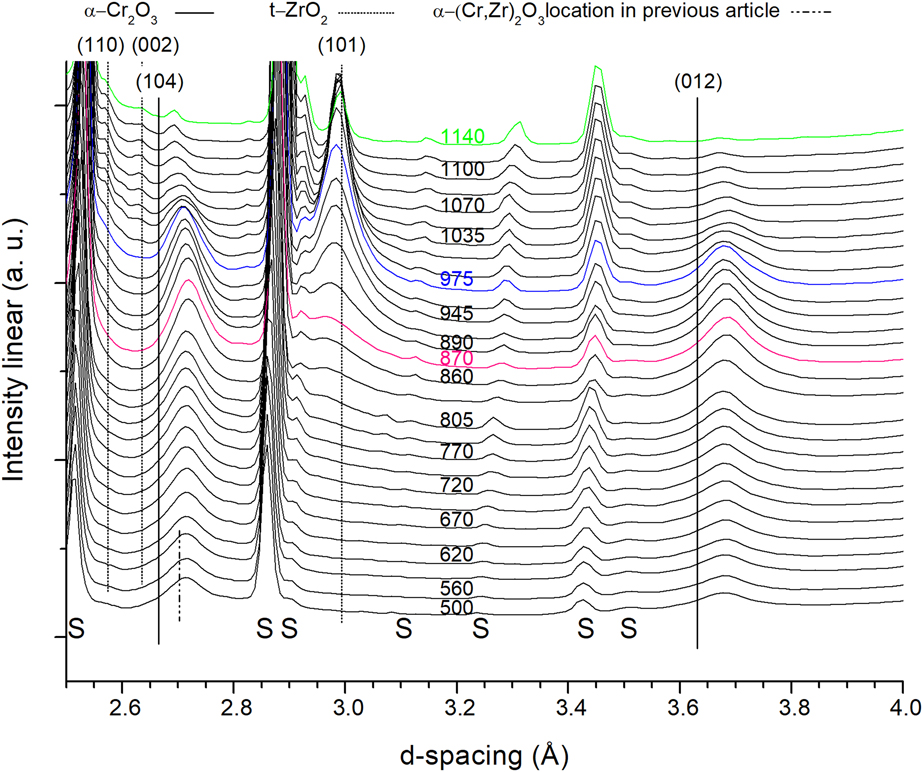
Figure 1: X-ray diffractograms of the coating annealed in vacuum up to 1140 °C. S = substrate. Green = maximum annealing temperature in vacuum, blue = maximum temperature achieved when annealing in air, and magenta = isothermal vacuum annealing temperature from previous work. Curves shifted for clarity. Temperature is given in °C.
The two α-Cr2O3 peaks visible in this range, namely, (104) and (012), are significantly shifted to larger d-spacing compared with reference α-Cr2O3 (PDF-38-1479) marked with solid black lines. As found in previous work [Reference Landälv, Lu, Spitz, Leiste, Ulrich, Johansson-Jõesaar, Ahlgren, Göthelid, Alling, Hultman, Stüber and Eklund43], this larger shift is due to the incorporation of Zr in the α-Cr2O3 structure. With increasing annealing temperature, the α-Cr2O3 peaks remain at their respective d-spacing up to ∼900 °C, with an increase in the peak/background intensity. At temperatures higher than ∼975 °C, the peak intensity decreases at the same time as the peaks shift to smaller d-spacing’s, prominent for the (104) peak. At around 800 °C, a new peak appeared at 2.97 Å, matching the (101) tetragonal-(t)-ZrO2 (PDF-42-1164), but at slightly smaller d-spacing. Note that the diffraction pattern in PDF-42-1164 was acquired at 1250 °C, which helps explaining the gradual shift toward the high temperature measured d-spacing. Its intensity increases rapidly from ∼945 °C to ∼1000 °C, where it starts to decrease. The decrease in intensity is possibly due to the movement of the sample out of the beam (seen by increased intensity for the initially low intensity substrate peaks, i.e., at 3.45 Å). Two additional t-ZrO2 diffraction peaks, around 2.6 Å, are also observed at temperatures higher than 1000 °C. At smaller lattice spacing, Figs. S2–S4, bcc-Cr peaks (PDF-6-694) can be observed at 2.06 Å (110), 1.19 (211), and 1.03 (220), all shifted ∼1.3% to larger lattice spacing compared with the PDF values at RT. The most prominent and nonoverlapping peak at elevated temperatures is the (211), which shows a drastic peak intensity increase, Fig. S2, in the same temperature range as the t-ZrO2 max intensity. This observation also correlates with the decrease in the α-(Cr,Zr)2O3 phase around 950–1050 °C, see Fig. 1. The metallic Cr adhesion layer is the origin to the RT bcc-Cr peak before annealing, situated at slightly lower d-spacing than after annealing, Fig. S3.
Figure 2 shows synchrotron XRD pattern before (red) and after (gray) vacuum annealing and the substrate before annealing (black). The peaks visible after annealing at 2.96 Å (101), 2.63 Å (002), and 2.55 Å (110) are attributed to the respective t-ZrO2 planes, shifted to smaller d-spacing compared to the PDF-card high temperature values. The peaks at 3.69 Å (110), 3.63 Å (011), and 3.16 Å (−111) are attributed to the monoclinic ZrO2 phase (PDF-37-1484). No peaks related to the α-Cr2O3 phase are observed.
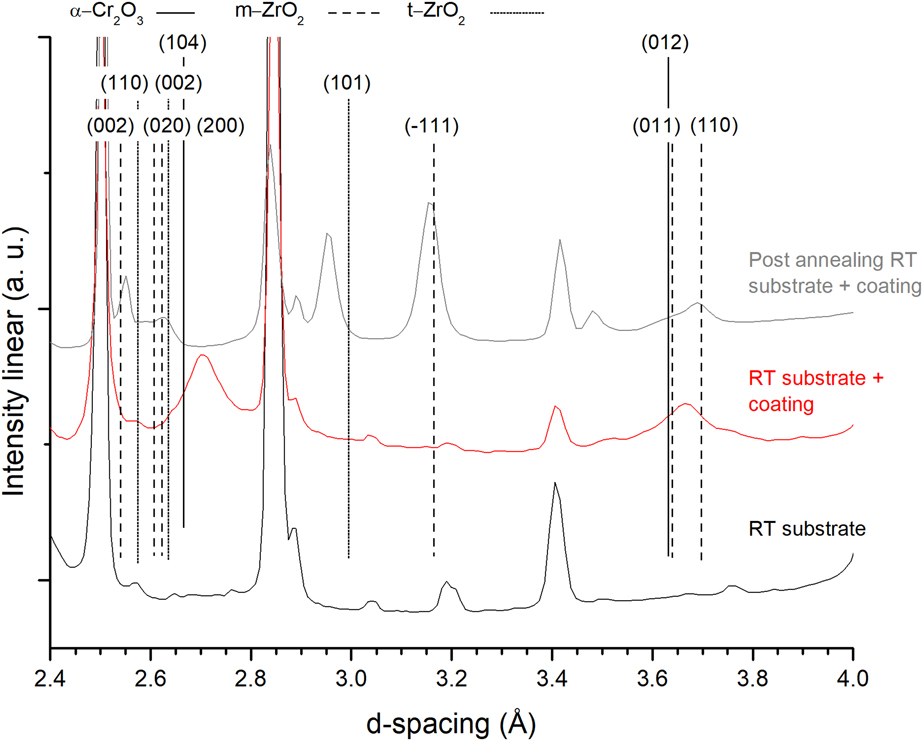
Figure 2: X-ray diffractograms of the coating before and after annealing in vacuum up to 1140 °C. Substrate scan at the bottom. Curves shifted for clarity.
Figure 3(a) shows the scanning transmission electron microscope (STEM) EDX map of a sample after vacuum annealing to 1140 °C. The red areas are Cr-rich and the turquoise areas are Zr-rich. Selected area electron diffraction (SAED) patterns (not shown) from two grains along different zone axis, 〈111〉 and  $\left\langle {1\bar{1}0} \right\rangle$, being rich in Cr in the EDX map, confirms bcc-Cr in these regions. The readers are directed to Ref. Reference Landälv, Lu, Spitz, Leiste, Ulrich, Johansson-Jõesaar, Ahlgren, Göthelid, Alling, Hultman, Stüber and Eklund43 for details on the bcc-Cr identification [Reference Landälv, Lu, Spitz, Leiste, Ulrich, Johansson-Jõesaar, Ahlgren, Göthelid, Alling, Hultman, Stüber and Eklund43]. Figure 3(b) shows a higher magnification map of the area marked with a white box in (a). This magnification matches the map in Fig. 3(c), which shows an STEM EDX map of an isothermally vacuum-annealed sample at 870 °C from Ref. Reference Landälv, Lu, Spitz, Leiste, Ulrich, Johansson-Jõesaar, Ahlgren, Göthelid, Alling, Hultman, Stüber and Eklund43. It is clear that both the Cr- and Zr-rich grains are significantly larger in the present study, especially the Zr-rich phase. The ZrO2 phase identification is based on the synchrotron XRD data in combination with TEM-EDX mapping showing Zr-rich regions. Another mapping (not shown), including the substrate–coating interface, shows continuous layers of the binding layers, with segregated Cr and Zr, still present after the high-temperature annealing.
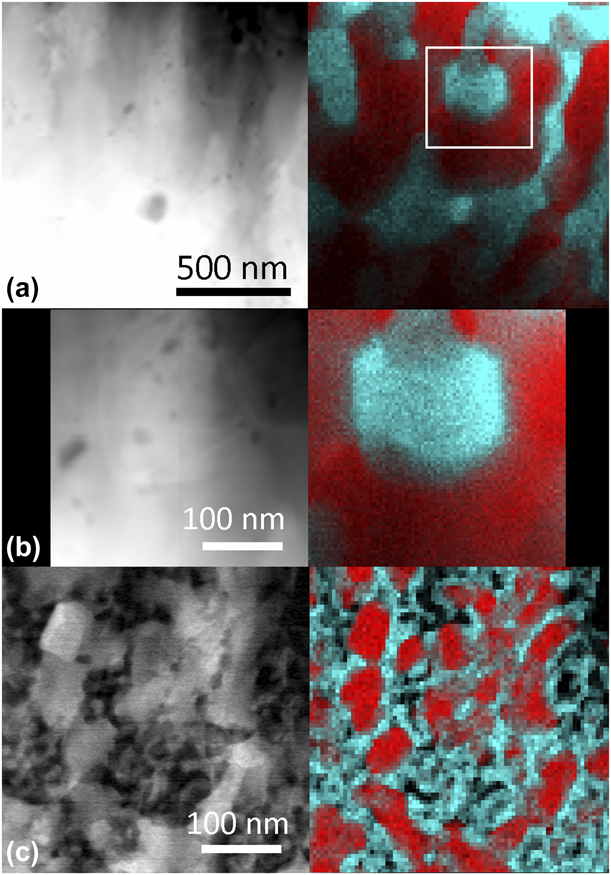
Figure 3: (a) Overview STEM micrograph with corresponding EDX map, Zr (turquoise) and Cr (red), of vacuum-annealed sample (up to 1140 °C). (b) Zoom of white box in (a) with the same scale as the work for comparison in (c). (c) Comparison from previous work [Reference Landälv, Lu, Spitz, Leiste, Ulrich, Johansson-Jõesaar, Ahlgren, Göthelid, Alling, Hultman, Stüber and Eklund43] after isothermal vacuum annealing at 870 °C. The reference sample show comparable smaller grains, especially for t-ZrO2. Observe different sized scale bars. Cross-section samples with growth direction are vertical. (c) Reprinted from L Landälv et al., Structural evolution in reactive RF magnetron sputtered (Cr,Zr)2O3 coatings during annealing, Acta Materialia 131, 543-552. Copyright (2017), with permission from Elsevier.
TEM and in situ XRD of air-annealed sample
Figure 4 shows a fraction of in situ X-ray diffractograms from the sample annealed in air. The increase in the background for larger d-spacing originates from more air scattering at lower angles. This was reduced in the vacuum setup by the experimental setup.
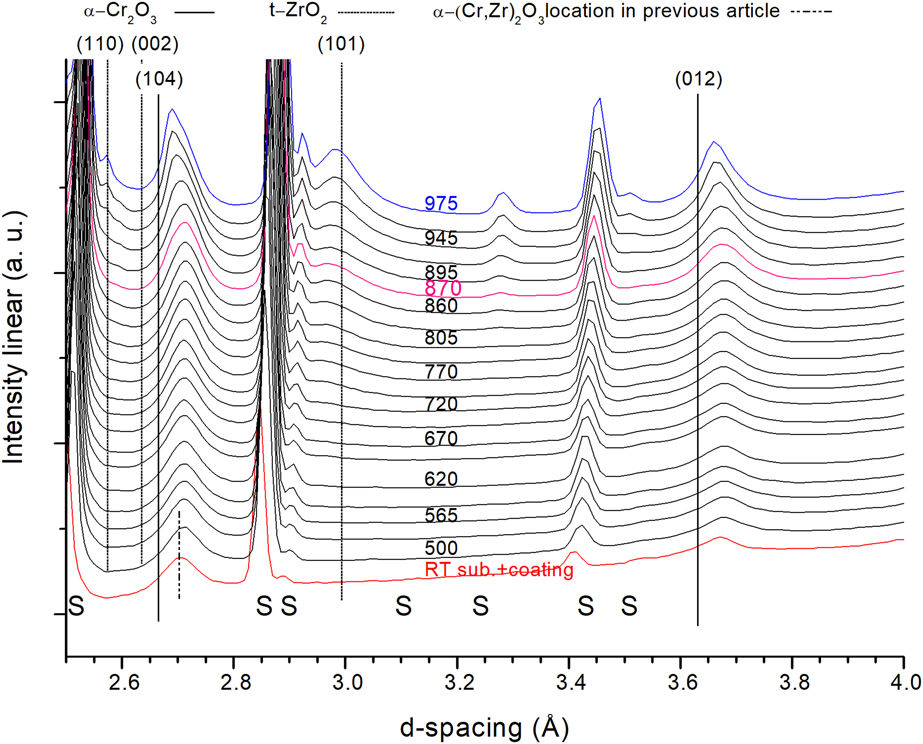
Figure 4: X-ray diffractograms with increasing annealing temperature of the coating annealed in air up to 975 °C. S = substrate. Blue = maximum temperature achieved when annealing in air and magenta = isothermal vacuum annealing temperature from previous work. Curves shifted for clarity. Temperature is given in °C.
The two α-Cr2O3 peaks visible in this range, (104) and (012), are significantly shifted to larger d-spacing compared to the α-Cr2O3 structure, marked with solid black lines, due to the incorporation of Zr in the α-Cr2O3, whereas decrease in lattice spacing above 900 °C, especially for the (104) peak, is attributed to loss of Zr from the initial α-(Cr,Zr)2O3 structure.
The onset of t-ZrO2 formation is visible already around 750 °C for the (101) peak at slightly lower angles compared with the PDF value (PDF-42-1164). An additional diffraction peak is visible at ∼2.55 Å (110) from around 945 °C, which correlates well with increased intensity for the main t-ZrO2 diffraction peak and the shift to smaller lattice spacing for the α-(Cr,Zr)2O3 structure. At the maximum annealing temperature in air, the α-(Cr,Zr)2O3 peak intensities are still the dominant ones over the t-ZrO2, contrary to what is seen in the vacuum annealing case.
Figure 5 shows the in situ XRD patterns at RT before and after annealing to 975 °C in air. After annealing, the as-deposited α-(Cr,Zr)2O3 peaks (104) and (012) shifted to match pure α-Cr2O3 phase. The (110) peak is also visible at ∼2.48 Å as a shoulder on the substrate peak. The t-ZrO2 (101) and (110) peaks are present, shifted to slightly smaller d-spacing compared with the PDF-card (partly related to different measurement temperatures). The peak at 3.25 Å is attributed to the substrate. Contrary to the vacuum annealing case, no substantial bcc-Cr formation could be observed in XRD. See Supplementary material Figs. S5–S6 for further comparison.
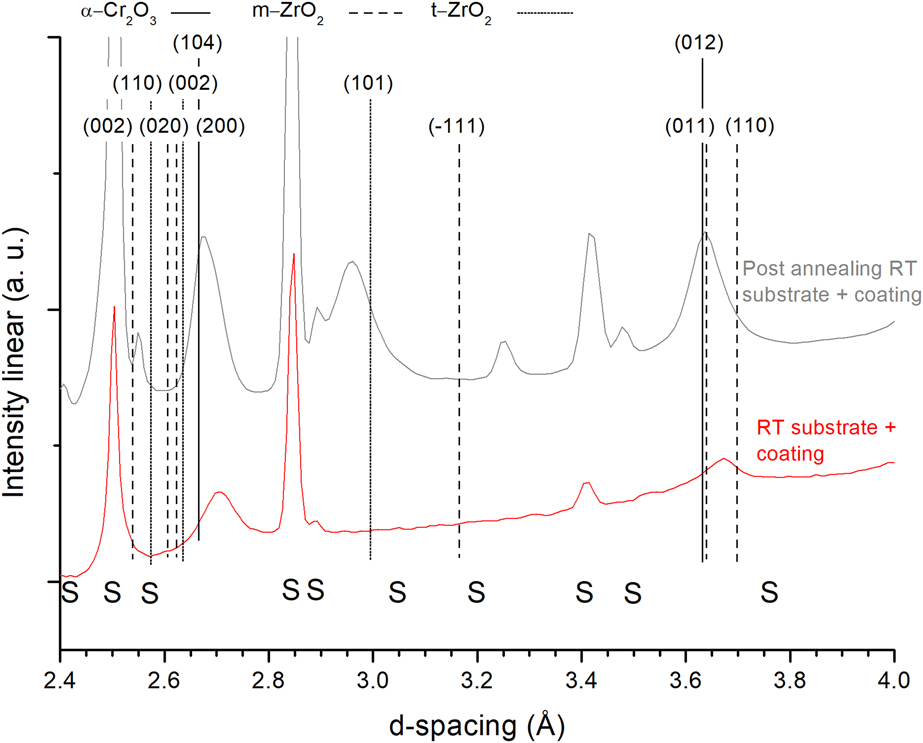
Figure 5: X-ray diffractograms of the coating before and after annealing in air up to 975 °C. Curves shifted for clarity. S indicates substrate peaks.
Figure 6(a) shows a TEM EDX map of a sample after air-annealing to 975 °C. The red regions are Cr-rich and the turquoise are Zr-rich. Figure 6(b) shows an EDX map of an isothermally vacuum-annealed sample (810 °C) from Ref. Reference Landälv, Lu, Spitz, Leiste, Ulrich, Johansson-Jõesaar, Ahlgren, Göthelid, Alling, Hultman, Stüber and Eklund43 for comparison (same color designation and scale). The microstructure is slightly coarser in the present study, annealed at 165 °C degree higher temperature, but the structural features are still present.
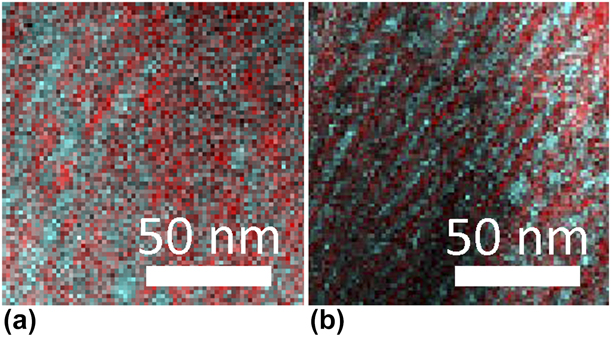
Figure 6: TEM-EDX mapping of air- and vacuum-annealed samples. (a) Current work after completing annealing cycle in air to 975 °C. (b) Sample for comparison from previous work [Reference Landälv, Lu, Spitz, Leiste, Ulrich, Johansson-Jõesaar, Ahlgren, Göthelid, Alling, Hultman, Stüber and Eklund43] after isothermal vacuum annealing at 810 °C, image not previously published. The reference sample shows similar banded microstructure of t-ZrO2 (turquoise) and α-(CrZr)2O3 (red) but on a finer scale. Cross-section samples with growth direction are vertical.
Top-view SEM on samples before and after annealing in air or vacuum
Figure 7 shows top-view SEM of the (a) as-deposited coating, (b) air-annealed coating, and (c) vacuum-annealed (50 °C/min heating rate) coating. The as-deposited coating shows small feather-like features on the surface. The air-annealed sample (975 °C maximum temperature) shows small grains embedded in a matrix with some larger grains protruding from the surface. The vacuum-annealed sample (1140 °C maximum temperature) shows large voids in between areas with large grains. The grains are ∼30/100 nm in size for the air-annealed sample and ∼160 nm for the vacuum-annealed sample.

Figure 7: SEM micrograph. (a) As-deposited (Cr,Zr)2O3 coating. (b) After annealing in air to 975 °C. (c) After annealing in vacuum to 1140 °C.
Discussion
The as-deposited coating was thoroughly characterized in Ref. Reference Landälv, Lu, Spitz, Leiste, Ulrich, Johansson-Jõesaar, Ahlgren, Göthelid, Alling, Hultman, Stüber and Eklund43. In summary, the microstructure was shown to consist of elongated, slightly tilted domains in the growth direction. These domains consisted of alternated Zr-rich amorphous oxide and Cr-rich α-(Cr,Zr)2O3 domains, ∼3–4 nm in diameter. The alternating phases showed some degree of mutual solid solutions by the smaller Cr3+ and the larger Zr4+ ion in the respective structures [Reference Shannon41, Reference Shannon and Prewitt44].
Compositional analysis revealed that the as-deposited composition is maintained after annealing to 975 °C in air, whereas the coating annealed in vacuum to 1140 °C indicates loss of Cr as well as slight lower oxygen content, see Table I. XRD in combination with TEM shows monoclinic and tetragonal ZrO2 and bcc-Cr as final phases in the vacuum-annealed sample. The mix of oxide and metallic phases helps explaining the measured chemical stoichiometry with respect to oxygen in the vacuum-annealed sample. The measured Zr and O contents add up to a ZrO2-phase with 0.527 Zr/O ratio, close to the 0.5 stoichiometric ratio for ZrO2. Some of the Zr is also most likely present in the Cr phase due to its shift in XRD to 1% larger d-spacing. Zr incorporation in bcc-Cr would shift the oxide forming fraction in the coating in the direction of a more stoichiometric ZrO2. The shift in Cr/Zr ratio from ∼2.8 in the as-deposited film to ∼0.5 in the vacuum-annealed coating (50 °C/min) indicates significant loss of Cr from the coating. This motivated additional TEM-EDX measurements on a cross-section sample (not shown). These measurements gave indications of different Cr/Zr ratios depending on the depth in the sample, with Cr/Zr ratio close to the with SEM-EDX determined as deposited ratio when averaging the 1 µm closest to the oxide film–binding layer interface, and a Cr/Zr ∼1 for a compositional average of the top 1 µm of the coating. TEM-EDX averaging the entire coating thickness resulted in Cr/Zr ratios similar to the value obtained for the as-deposited coating with SEM-EDX. The segregation of Cr- and Zr-rich grains on a fairly large length scale (several 100 nm), see Fig. 3, with possible enrichment of Zr-rich grains at the surface, could be the explanation to why top-view SEM-EDX, with limited acquisition depth, shows higher Zr-content than in the as-deposited film. Additional calculations on electron penetration depth and acquisition depth for the generated γ-rays for the top-view SEM-EDX measurement (with 15 keV electrons) showed that the primary information depth was the first ∼500 nm, which falls within the high Zr content region identified with TEM-EDX. The absence of a continuous Zr-rich top layer visible with STEM-EDX map on cross-sectional samples made it, however, difficult to assess the coverage and thus the total influence on the SEM-EDX measurements. The loss of Cr through formation of volatile Cr-oxide [Reference Graham and Davis45, Reference Hindam and Whittle46] is judged to be minor due to high vacuum 10−5 Pa condition for the vacuum-annealed sample in this study.
The top-view SEM-EDX measured 2 at.% Ti in the same vacuum-annealed coating is attributed to possible in diffusion of Ti from the substrate within the top ∼1.4 µm of the coating (approximately acquisition depth of the SEM probe). A Ti gradient in the film was not possible to corroborate with STEM-TEM due to Ti-TEM grid, causing evenly distributed Ti-signal due to resputtering. The Ti content measured with SEM-EDX is, however, that low that it is not thought to have influenced the annealing results appreciable.
As calculated in a previous work [Reference Landälv, Lu, Spitz, Leiste, Ulrich, Johansson-Jõesaar, Ahlgren, Göthelid, Alling, Hultman, Stüber and Eklund43], ZrO2 is more stable than Cr2O3 under oxygen-deficient conditions due to the lower formation energies of ZrO2. ZrO2 requires more oxygen to form than Cr2O3 and will therefore be able to attract O at the expense of Cr2O3, leading to the formation of bcc-Cr, which is observed here. The SEM micrographs of the 50 °C/min vacuum-annealed sample also show void formation after annealing to 1140 °C. This is possibly due to the transformation of α-(Cr,Zr)2O3 to bcc-Cr (having higher density) on loss of some oxygen.
The XRD diffractograms of the coating before and after annealing in vacuum to 1140 °C, Fig. 2, show that the main transformation product is a mixture of tetragonal and monoclinic ZrO2. The tetragonal phase is probably stabilized by Cr dissolved in the structure, partly explaining the shift to ∼1% smaller d-spacing. The monoclinic phase, being the RT stable phase for pure ZrO2, has been probably formed during cooling of the sample since no such diffraction peaks are clearly observed during heating (Fig. 1). For the monoclinic phase to crystallize exclusively, the trivalent undersized cation concentration (i.e., Cr-content) needs to be below ∼1 at.% metal fraction (∼2 mol% Cr2O3) [Reference Li, Chen and Penner-Hahn47, Reference Yoshimura, Yashima, Noma and Sōmiya48] and the grain size larger than ∼30 nm [Reference Baldinozzi, Simeone, Gosset and Dutheil27, Reference Garvie28]. Since the grain size observed in TEM (Fig. 3) is larger than 30 nm, there must be both ZrO2 grains with no or very little Cr and some with larger Cr content, stabilizing the tetragonal phase. This is also observed in the different peak shifts for monoclinic and tetragonal phase, small to none for monoclinic  $\left( {\bar{1}10} \right)$, (011), and (110) peaks, while significant shift to smaller d-spacing for the tetragonal peaks, i.e., (101) and (110), partly explained by the high temperature values from the PDF-card. This mixture of tetragonal and monoclinic phase was not seen in the previous work, where the coating was annealed to a maximum of 870 °C. The difference is explained by the increased maximum temperature, promoting long-range diffusion and grain growth, which favor the monoclinic phase.
The third phase found in the vacuum-annealed sample is the bcc-Cr. The XRD intensity is too high after annealing to just be attributed to the Cr-containing adhesion layer, partly visible before annealing [bcc Cr-(211) peak]s, Figs. S3–S4. The identification of the phase in the oxide part of the coating in post-annealed sample is done in TEM with a combination of SAED (not shown in the present paper) and TEM-EDX map. The detailed identification of this phase has been shown in previous work [Reference Landälv, Lu, Spitz, Leiste, Ulrich, Johansson-Jõesaar, Ahlgren, Göthelid, Alling, Hultman, Stüber and Eklund43] and found to be the same in this work. The new in this study, concerning bcc-Cr, is to be able to show the formation onset of bcc-Cr during in situ annealing. The constant X-ray illumination of the adhesion layer zone, since both coating and substrate peaks are visible during the entire annealing study, would result in constant peak intensity for the Cr adhesion layer if no phase transformation occurred. In this study, however, the bcc-Cr (211) peak intensity increases, thus corroborates the formation of more bcc-Cr during high-temperature annealing, starting at ∼945 °C, see Fig. S2. This peak increase is closely related to the onset of t-ZrO2 formation and the disappearance of the α-(Cr,Zr)2O3 phase peaks.
For the air-annealed sample (Fig. 5), the t-ZrO2 phase is shifted to smaller d-spacing after annealing, possibly due to solid solution with the smaller atom Cr, since the macroscopic residual stresses should be annealed out after this high annealing temperatures on such a small sample piece. The α-Cr2O3 phase shows very close match to the PDF-card (PDF-38-1479), only slightly larger d-spacing, which could indicate some residual Zr in the lattice. No monoclinic ZrO2 or bcc-Cr is visible in the air-annealed sample with XRD (Fig. 5). The TEM-EDX map confirms a similar segregation pattern (Fig. 6), as was observed in previous vacuum annealing work, where alternating α-Cr2O3 and t-ZrO2 regions were determined. Altogether, the same conclusion about the phases can be drawn for this air-annealed sample.
Since the maximum annealing temperature for the air- and vacuum-annealed samples ended up not being the same, other comparisons than the direct comparison of the post-annealed samples need to be performed. The temperature control was also different between the two setups, making the heating rate in the air-annealed sample closer to 10 °C/min, in steps of 5 min plateaus. Thus, when comparing the 50 °C/min vacuum annealing with the slower heating rate air sample, the changes in the air sample would be closer to equilibrium at a given temperature of comparison. Comparison of the XRD of the air-annealed and vacuum-annealed samples at the maximum temperature of the air-annealed sample allow for the most one-to-one like comparison of the effect of annealing atmosphere possible in this setup. The integrated peak intensity ratio between the (101) t-ZrO2 and the α-Cr2O3 peaks, (104) and (012), at this temperature differs significantly between the samples annealed in vacuum and the one in air at that temperature (Supplementary material, Fig. S7). For the vacuum-annealed sample, the ratios are 3.6 and 5.1 [(101)/(104) and (101)/(012)], while for the air-annealed sample, the ratios are 1.3 and 2.9. The air-annealed sample shows higher or comparable intensity for the α-Cr2O3 peaks, shown as a lower ratio value, compared with the t-ZrO2 peak at this temperature. This indicates higher stability of this (Cr,Zr)2O3 coating in air than under vacuum conditions. The absence of high-intensity Cr (211) peak at 1.19 Å (Supplementary material, Fig. S8) help explain why the t-ZrO2 phase show lower diffraction intensity. This is probably due to its hindered formation/grain growth by the in air more stable alpha-Cr2O3 phase which is not being transformed to bcc-Cr. The 1.19 Å peak at 975 °C in Fig. S8 is attributed to the (211) peak of a bcc-Cr phase with some dissolved Zr, resulting in the ∼1% increase in lattice spacing. The solubility of Zr in Cr is according to the phase diagram limited to ∼0.6 at.% under thermodynamic equilibrium [Reference Predel49]. There is also a (213) t-ZrO2 peak position in the same d-spacing range if compared with lower order peak position at this temperature. The observed intensity for the 1.19 Å peak is, however, large compared with the (211) and (103) t-ZrO2 peaks at 1.54 and 1.57 Å. The two later should have significantly higher intensities than the (213) t-ZrO2 peak according to the PDF-card. Even considering texture effects, this is likely a significant difference. Texture effects should as well be intrinsically reduced by the way the diffractogram intensities are summed over 180° azimuth angle, covering a large part of the reciprocal space. An additional annealing run was performed in vacuum, with lower heating rate (10 °C/min), which is more explained in Supplementary material and shown in Figs. S7–S9. The higher t-ZrO2/α-Cr2O3 peak ratio for the slowly vacuum-annealed sample indicates the higher degree of conversion to t-ZrO2 when the heating rate is slower (more similar to the air-annealed sample).
The difference in max annealing temperature and slightly different heating rate, where the maximum temperature is judged to be the more important parameter, limit the possibility of claiming better thermal stability of the air-annealed sample above 975 °C. However, the above-explained difference in peak ratios and the existence of bcc-Cr in the vacuum-annealed samples already at this temperature give a strong indication that the coating is more stable in air than in vacuum.
The hardness of the air-annealed sample remained close to the as-deposited value of 19.6 GPa after the annealing to 975 °C. Thus, the as-deposited hardness level may be retained after annealing to higher temperatures than in Ref. Reference Landälv, Lu, Spitz, Leiste, Ulrich, Johansson-Jõesaar, Ahlgren, Göthelid, Alling, Hultman, Stüber and Eklund43, if done in air and for limited time (here, ∼45 min with temperature higher than 810 °C). The retained hardness after the annealing can be explained by the crystallization of t-ZrO2, the limited grain growth, and retained microstructure, the last two being observed in the STEM-EDX map [Fig. 6(a)]. This can also be compared to an 810 °C isothermally vacuum-annealed coating [Fig. 6(b)], which is a sample from Ref. Reference Landälv, Lu, Spitz, Leiste, Ulrich, Johansson-Jõesaar, Ahlgren, Göthelid, Alling, Hultman, Stüber and Eklund43. The vacuum-annealed sample in this study shows a hardness, i.e., lower than that of the as-deposited sample, more corresponding to values of m-ZrO2, ∼10 GPa [Reference Catledge, Cook, Vohra, Santos, McClenny and David Moore50], not even considering the negative effect of voids on the hardness, as observed in Fig. 7. The spread in hardness values was smaller for the vacuum-annealed sample than in the air-annealed case, even considering the voids. This is possibly due to the metallic Cr fraction in the vacuum-annealed coating, resulting in a slight increase in deformability. The hardness of nc-Cr [Reference Wu, Zhang, Huang, Bei and Nieh51], highly dependent on grain size, is also in the range of the hardness of the vacuum-annealed sample measured in this study.
Conclusions
We have studied the behavior of Cr-rich α-(Cr,Zr)2O3 solid solution coatings on annealing in vacuum and in air atmosphere with in situ synchrotron XRD as well as post-annealing TEM, SEM, and hardness measurements with nanoindentation.
The annealing in vacuum shows t-ZrO2 formation starting ∼800 °C, which is followed by decomposition of the α-Cr2O3 structure in conjunction with bcc-Cr formation, starting at ∼950 °C. The resulting coating after annealing to 1140 °C is a coarse grained mixture of t-ZrO2, m-ZrO2, and bcc-Cr, with intermediate voids.
The air-annealed sample shows t-ZrO2 formation starting at ∼750 °C. The α-(Cr,Zr)2O3 starts to transform to α-Cr2O3 at ∼945 °C at the same time as the t-ZrO2 formation increases. The resulting coating after annealing to 975 °C is a mixture of α-Cr2O3 with dissolved Zr and t-ZrO2 with dissolved Cr. The microstructure coarsened slightly, but the mechanical properties are maintained, with no detectable bcc-Cr formation.
Comparing the relative integrated peak intensities of t-ZrO2 and α-Cr2O3 at 975 °C, a larger t-ZrO2 fraction is shown in the vacuum-annealed coating, compared with the air-annealed coating, already at this temperature. The results indicate that the studied pseudo-binary oxide is more stable in air atmosphere than in vacuum. Using relevant annealing atmosphere should be considered to ensure an optimization to wear-resistant coating applications in future studies.
Experimental details
The deposition of the Cr–Zr–O coatings was performed with stationary substrate (TiAl alloy) in a Leybold Z 550 RF magnetron sputtering deposition equipment with the base pressure of the chamber being 6 × 10⁻⁴ Pa. An ∼250 nm Cr adhesive layer was deposited in DC mode in a separate process, while both ∼250 nm CrZr and 4.5 µm CrZrO depositions were done in the RF mode with a segmented Cr/Zr-target at 500 °C. Full description is found in previous work [Reference Landälv, Lu, Spitz, Leiste, Ulrich, Johansson-Jõesaar, Ahlgren, Göthelid, Alling, Hultman, Stüber and Eklund43].
The substrate used for deposition was a TiAl alloy, commercial name TNB-V2, with a composition of 47 at.% Ti, 45 at.% Al, and 8 at.% Nb. This alloy was used for the annealing experiment since it is known to resist high temperatures up to 900 °C with maintained mechanical properties. The samples for the X-ray synchrotron radiation annealing test were cut into ∼2 mm thick pieces (perpendicular to the sample surface) from the same deposited half disc used/described in previous study [Reference Landälv, Lu, Spitz, Leiste, Ulrich, Johansson-Jõesaar, Ahlgren, Göthelid, Alling, Hultman, Stüber and Eklund43].
The chemical composition of the as-deposited coating, prior to the annealing experiment, was determined by EPMA (Camebax Microbeam), as reported in Ref. Reference Landälv, Lu, Spitz, Leiste, Ulrich, Johansson-Jõesaar, Ahlgren, Göthelid, Alling, Hultman, Stüber and Eklund43. The annealed coating and an as-deposited sample piece from the same original larger sample was imaged in top view with an SEM, Leo 1550 Gemini field emission gun, with 5 kV acceleration voltage and in-lens detector. The chemical composition was determined with an 80 mm2 X-Max Oxford Instruments EDX equipment installed on the same SEM system, using 15 keV acceleration voltage. At this accelerating voltage, the penetration depth of the beam is not sufficient to reach the substrate. Carbon detected with EDX was not considered since previous EPMA measurements showed below 1 at.% C, N, and Ar in the as-deposited sample. The previous EPMA measurement of the as-deposited coating served as a reference for the EDX measurements and matched well.
In situ wide-angle X-ray scattering was performed in transmission mode at the High Energy Materials Science Beamline P07 at Petra III, DESY Hamburg, using a 5 μm high and 20 μm wide X-ray beam with an energy of 78 keV (wavelength 0.159 Å). The diffracted X-rays were collected on a PerkinElmer 2D detector 2048 × 2048 pixels (41 × 41 cm size), which was positioned ∼1.4 m after the sample. For both the air and vacuum annealing experiments, the diffractograms were recorded continuously in a process that took ∼13 s in total (5 exposures of 1 s, each including equally long background exposures), hence ∼4 diffractograms/min. The data were evaluated by converting the 2D-diffractogram to 1D diffractograms by integrating the data in the upper half of the detector. The 2D data from the bottom half of the detector were omitted due to the higher absorption of X-rays transmitted through the substrate and sample holder.
The annealing was performed using two different setups, both in transmission geometry, one for air annealing and other for vacuum annealing.
The air annealing setup consisted of a suspended quartz rod, on which the sample rested on (open air, atmospheric pressure, convective induced air flow). The sample was heated from above with a focused Osram Xenophot halogen lamp (MR16 64635 HLX). The temperature was set by the voltage applied to the heating lamp. Prior to the test, an approximate calibration of the temperature was done using a thermocouple type K at the sample position. The exact sample temperature was later calculated through the thermal expansion of the substrate (see below). The annealing test started by heating the sample to approximately the deposition temperature, followed by an 11 min hold period before the gradual heating started. The voltage was then increased in steps of 0.5 V every 5 min to a maximum of 17.5 V, corresponding to a total of 110 min before cooling started. Cooling back to RT took 21 min. Diffractograms were acquired before and after the annealing and continuously during annealing according to the previously specified procedure. The diffractograms shown from the coating annealed in air were selected to be from the end of each 5 min hold period.
The vacuum annealing was performed in an ultra-high vacuum deposition system (base pressure was ∼3 × 10⁻⁵ Pa, not baked) with the possibility to investigate the sample in situ with XRD while heating the sample. The deposition system is described in detail elsewhere [Reference Schroeder, Thomson, Howard, Schell, Näslund, Rogström, Johansson-Jõesaar, Ghafoor, Odén, Nothnagel, Shepard, Greer and Birch52]. The heating was carried out with an infrared laser directed on the backside of a SiC sample holder plate, on which the sample rested on without any clamp or thermal conduction paste. The temperature was controlled by a pyrometer reading taken from the same side as the laser heating. The temperature on the sample surface was calibrated to the temperature readout from the pyrometer by a K-type thermocouple mounted on top of a sapphire substrate prior to the annealing test. The sample temperature as determined by the thermocouple in the vacuum setup was considered to be the most accurate temperature measurement and is the temperature referred to in the remaining part of the article. The heating rate during annealing in vacuum was 50 °C/min from the starting hold temperature of 400 °C. The annealing time from this hold temperature until the maximum temperature of 1140 °C was 21.5 min, followed by a hold period of 7 min. The time to reach the same temperature as the maximum temperature reached for the air-annealed sample was 15.5 min, and the discrepancy in maximum annealing temperature is treated in the next paragraph.
Since the uncertainty of sample temperature was larger for the air-annealing setup, the temperature of the air-annealed sample was obtained by determining the peak position of three substrate peaks (d-spacing 1.17, 2.20, and 4.06 Å) and comparing that with the substrate peak positions of the vacuum-annealed sample. By assuming the same thermal expansion coefficient for the air-annealed sample and the vacuum-annealed sample, an equivalent sample temperature was determined for the air-annealed sample. Further description about this procedure can be found in the Supplementary material, summarized in Fig. S1 (substrate d-spacing as a function of vacuum calibrated T for air- and vacuum-annealed samples). This recalibration showed that the maximum temperature reached for the air-annealed samples was 975 °C, ∼165 °C lower than the maximum achieved temperature (1140 °C) for the vacuum-annealed sample. This difference in maximum attained annealing temperature needs to be considered when comparing the post-annealed properties. The diffractograms shown from the vacuum-annealed sample were selected in a way such that the sample had the same temperature as the ones selected from the air-annealed sample.
Overview STEM micrographs were acquired with an FEI Tecnai G2 TF20 UT TEM, using high-angle annular dark field mode, equipped with a field emission gun operated at a voltage of 200 kV and an EDX from EDAX with an energy resolution of 130 eV.
The hardness was measured with a UMIS2000 nanoindentation system equipped with a Berkovich indenter. 49 quasi static (closed loop) indents were made on the as-deposited and as-annealed surfaces with a maximum load of 30 mN (maximum depth ∼340 nm for the softest sample, being well below 10% of total coating thickness). The data were analyzed by the technique of Oliver and Pharr [Reference Oliver and Pharr53] and reported here are the mean value and the standard deviation from 46 (as-deposited), 44 (vacuum annealed 50 °C/min), and 30 (air-annealed) indents with valid loading curves, respectively. The machine compliance was calibrated to 0.2 nm/mN.
Supplementary material
To view supplementary material for this article, please visit https://doi.org/10.1557/jmr.2019.340.
Acknowledgments
The Swedish Research Council (VR, Grant No. 621-2012-4368) is acknowledged for financial support for L.L’s industry Ph.D. studies with AB Sandvik Coromant. P.E. acknowledges the Knut and Alice Wallenberg Foundation through a Fellowship grant, and P.E. and J.B. acknowledge the Swedish Government Strategic Research Area in Materials Science on Functional Materials at Linköping University (Faculty Grant SFO-Mat-LiU No. 2009 00971). B.A. acknowledges financial support from the Swedish Research Council (VR) through the International Career Grant No. 330-2014-6336 and by Marie Sklodowska Curie Actions, Cofund, Project INCA 600398, as well as from the Swedish Foundation for Strategic Research (SSF) through the Future Research Leaders 6 program. We acknowledge financial support from the Swedish Research Council via the Röntgen Ångström Cluster (RÅC) Frame Program (No. 2011–6505) and the German Federal Ministry of Education and Research (BMBF) under Grant No. 05K12CG1.


 Open access