


Introduction
The use of intermetallic γ-TiAl-based alloys in aerospace and automotive applications, e.g., as turbine blades, inlet valves or turbocharger wheels, enables to enhance the efficiency and engine performance. This allows to reduce CO2 and NOx emissions effectively [Reference Clemens and Mayer1, Reference Mayer, Erdely, Fischer, Holec, Kastenhuber, Klein and Clemens2, Reference Masiol and Harrison3, Reference Bewlay, Nag, Suzuki and Weimer4]. The material's low density of 3.9–4.2 g/cm3, which results in high-specific yield strength and specific Young's modulus, enables lightweight designs [Reference Mayer, Erdely, Fischer, Holec, Kastenhuber, Klein and Clemens2]. Up to temperatures of 800 °C, γ-TiAl-based alloys exhibit good oxidation resistance and creep properties. However, they generally suffer from poor ductility and fracture toughness at room temperature (RT) [Reference Mayer, Erdely, Fischer, Holec, Kastenhuber, Klein and Clemens2, Reference Wimler, Lindemann, Clemens and Mayer5, Reference Miyaguchi, Otsu, Takashima and Takeyama6]. Depending on chemical composition, the amount of impurities, applied heat treatments, phase fractions, and morphology of the present phases, fracture elongations of up to 5% have been measured in standardized tensile tests at RT [Reference Wimler, Lindemann, Clemens and Mayer5, Reference Liu, Schneibel, Maziasz, Wright and Easton7, Reference Wang, Ding, Zhang, Chen, Guo and Fu8].
The process-adapted 4th generation TNM+ alloy, with a nominal composition of Ti–43Al–4Nb–1Mo–0.3C–0.3Si–0.1B (in at.%), solidifies via the β-Ti(Al) phase (disordered body-centered cubic (bcc), A2 structure) and enables an almost texture-free cast microstructure [Reference Mayer, Erdely, Fischer, Holec, Kastenhuber, Klein and Clemens2, Reference Klein, Usategui, Rashkova, Nó, San Juan, Clemens and Mayer9, Reference Burtscher, Klein, Mayer, Clemens and Fischer10]. To enhance the operating temperatures and improve the creep properties, the reduction of detrimental microstructural components by heat treatments is an effective method [Reference Kastenhuber, Klein, Clemens and Mayer11, Reference Leitner, Schloffer, Mayer, Eßlinger, Clemens and Pippan12]. The omission of the βo-TiAl phase (ordered bcc, B2 structure) and globular γ-TiAl grains (γglob) (ordered face-centered tetragonal, L10 structure) results in a fully lamellar (FL) microstructure [Reference Klein, Usategui, Rashkova, Nó, San Juan, Clemens and Mayer9, Reference Burtscher, Klein, Mayer, Clemens and Fischer10, Reference Leitner, Schloffer, Mayer, Eßlinger, Clemens and Pippan12, Reference Beschliesser, Chatterjee, Lorich, Knabl, Kestler, Dehm and Clemens13, Reference Wang and Nieh14]. This is realized by solution annealing within the α-Ti(Al) single-phase field region (disordered hexagonal, A3 structure) followed by a stabilization annealing slightly above the envisaged service temperature [Reference Klein, Usategui, Rashkova, Nó, San Juan, Clemens and Mayer9]. During these heat treatments, the chosen parameters influence grain size and lamellar spacing of the evolving α2/γ colonies, as reported in Refs. [Reference Burtscher, Klein, Mayer, Clemens and Fischer10, Reference Beschliesser, Chatterjee, Lorich, Knabl, Kestler, Dehm and Clemens13]. In the course of this, at temperatures below 1175 °C, the α-phase transforms to the ordered α2-Ti3Al phase (ordered hexagonal, D019 structure) due to short-range diffusion [Reference Mayer, Erdely, Fischer, Holec, Kastenhuber, Klein and Clemens2, Reference Schwaighofer, Clemens, Lindemann, Stark and Mayer15]. The resultant FL microstructure is known to exhibit a superior combination of strength and creep properties but suffers from a lack of ductility [Reference Wimler, Lindemann, Clemens and Mayer5, Reference Klein, Usategui, Rashkova, Nó, San Juan, Clemens and Mayer9].
Nevertheless, in several studies, the formation of cracks along semicoherent α2/γ interfaces is reported to take place due to the limited number of available glide systems [Reference Balsone, Worth, Larsen and Jones16, Reference Huang, Bowen and Jones17, Reference Halford, Takashima, Higo and Bowen18, Reference Chauniyal and Janisch19]. This results in a preferred crack propagation along the aforementioned interface type due to local stress concentrations within α2/γ colonies [Reference Bayraktar20, Reference Edwards21, Reference Arata, Kumar, Curtin and Needleman22, Reference Lu, Zhang, Qiao, Wang, Chen and Chu23, Reference Worth, Larsen, Balsone and Jones24]. Macroscopic specimens exhibiting an FL microstructure generally attain higher fracture toughness and J-integral values. This is reasoned by the positive effect of colony boundaries and, consequently, the orientation of α2/γ colonies with respect to the crack path [Reference Balsone, Worth, Larsen and Jones16, Reference Edwards21, Reference Chan and Kim25, Reference Clemens, Schloffer, Schwaighofer, Werner, Gaitzenauer, Rashkova, Schmoelzer, Pippan and Mayer26, Reference Iqbal, Pyczak, Neumeier and Göken27, Reference Appel, Lorenz, Sparka and Wagner28, Reference Dlouhý, Stratil, Fukutomi and Hasegawa29, Reference Chan30, Reference Palomares-García, Pérez-Prado and Molina-Aldareguia31, Reference Edwards, Di Gioacchino and Clegg32]. Crack deflection, ligament bridging, pull-outs, mechanical twinning or slip in γ lamellae and the development of microcracks in front of and parallel to the crack tip within colonies furthermore improve the fracture properties [Reference Iqbal, Pyczak, Neumeier and Göken27, Reference Palomares-García, Pérez-Prado and Molina-Aldareguia31, Reference Ritchie, Kinney, Kruzic and Nalla33, Reference Palomares-García, Pérez-Prado and Molina-Aldareguia34]. Hence, misorientation between crack propagation direction and lamellar alignment is beneficial [Reference Worth, Larsen, Balsone and Jones24, Reference Hénaff, Bittar, Mabru, Petit and Bowen35, Reference Neogi, Alam, Hartmaier and Janisch36]. Furthermore, crack-tip blunting by ductile phases, shear ligament toughening, twinning, and crack-tip interface debonding are also considered to enhance the crack resistance at the micro-scale [Reference Leitner, Schloffer, Mayer, Eßlinger, Clemens and Pippan12, Reference Hénaff, Bittar, Mabru, Petit and Bowen35, Reference Chan and Kim37]. Therefore, the deformability of γ lamellae due to mechanical twinning or slip of dislocations within the plastic zone in front of the crack tip and the interaction with adjacent γ or α2 lamellae has to be considered [Reference Chauniyal and Janisch19, Reference Edwards21, Reference Lu, Zhang, Qiao, Wang, Chen and Chu23, Reference Edwards, Di Gioacchino and Clegg32, Reference Edwards, Di Gioacchino, Goodfellow and Clegg38, Reference Schnabel and Bargmann39].
The current work aims to investigate the fracture behavior of lamellar interfaces of an FL γ-TiAl-based alloy and to determine the decisive factors on crack propagation at the micro-scale. These results are achieved by in situ testing of miniaturized notched cantilevers, whereby the pre-notches exhibit a distinct orientation and position concerning α2/γ and γ/γ interfaces, respectively. Using continuous stiffness measurement (CSM) and computer vision (CV), the crack length related to a specific displacement, the corresponding conditional fracture toughness (Kq), and the J-integral were determined [Reference Edwards21, Reference Alfreider, Kolitsch, Wurster and Kiener40, Reference Alfreider, Kozic, Kolednik and Kiener41, Reference Edwards, Di Gioacchino and Clegg42]. This allows gaining fundamental knowledge of local processes as well as their interplay with different interface types within α2/γ colonies as a basis for strategies to enhance the fracture resistance of TiAl alloys.
Results
The specimens exhibit distinct differences in mechanical response concerning their lamellar alignment and type of tested interface. Thus, in the following, cantilevers exhibiting perpendicular and parallel α2/γ interfaces regarding their presumed crack plane are discussed separately. The specimen positions and orientations were chosen in a way that the lamellar structure of the α2/γ colonies is aligned either perpendicular (type (L)) or parallel (type (II)) to the assumed crack propagation plane of the cantilevers [see Fig. 1(c)]. The dimensions of the fabricated cantilevers and their orientation to the containing grains are listed in Table 1.
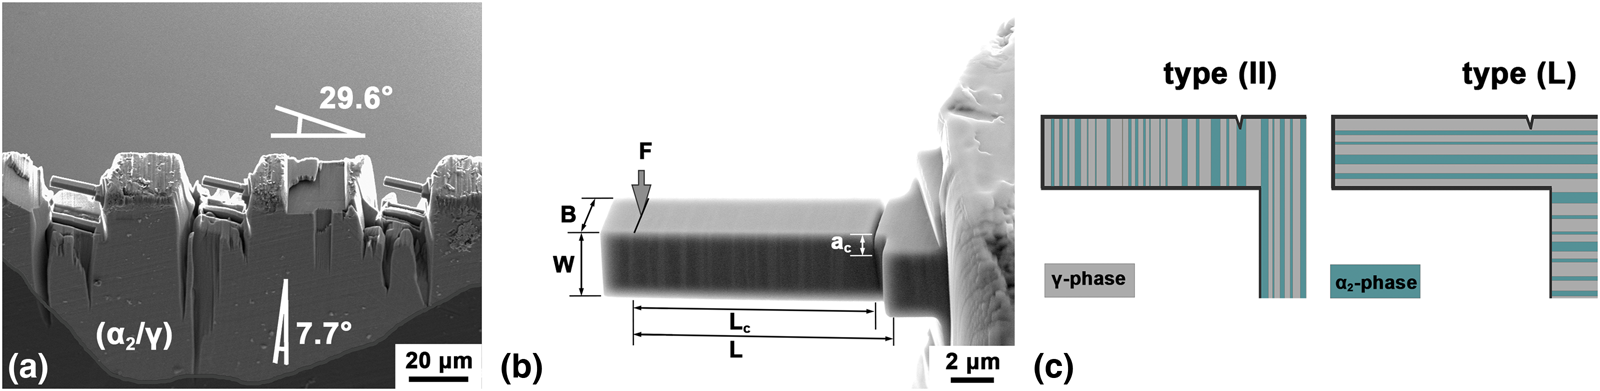
Figure 1: (a) Overview of three cantilevers with an angle of 29.6° to the hosting sample taken in the scanning electron microscope (SEM) with secondary electron (SE) contrast. The original α2/γ colony is visible in BSE contrast and highlighted with gray contrast for better visibility. (b) SEM-SE side view of a notched TNM+ cantilever with designated α2 and γ lamellae parallel to the expected crack propagation plane. (c) Sketches of the two different cantilever types, including their lamellar orientation of α2 and γ-phase as tested herein.
TABLE 1: Summary of the tested cantilevers including their dimensions [see Fig. 1(b)], orientation dependency of the α2/γ interfaces to the expected crack plane (type (II) or (L)) and deviation angle φ of α2/γ lamellae to the desired orientation.
The accuracy of the measurements was determined to be ± 0.02 μm, representing the maximum standard deviation of at least four individual length measurements for each dimension.
a) Unnotched cantilever.
Continuous stiffness measurement
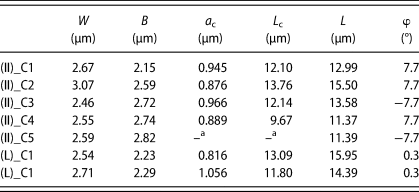
The measured force- and dynamic compliance–displacement data from in situ experiments are displayed for (II)_C2 specimen in Fig. 2(a). Due to the high scanning speed, varying stages of crack development can be differentiated. Here, position (1) marks the initial state at the beginning of data recording. The corresponding SE images are displayed in Fig. 2(b). Position (2) indicates the last data point before unstable crack growth arises. This event is accompanied by a drastic decrease in force and an increase in compliance as well as displacement. In position (3) the crack arrests, followed by a stable dynamic compliance with increasing force, suggesting again elastic loading at the crack tip. Thereafter, the force continues to gradually decrease, while the dynamic compliance increases, suggesting again crack propagation up to a maximum displacement of 5 μm at position (4).
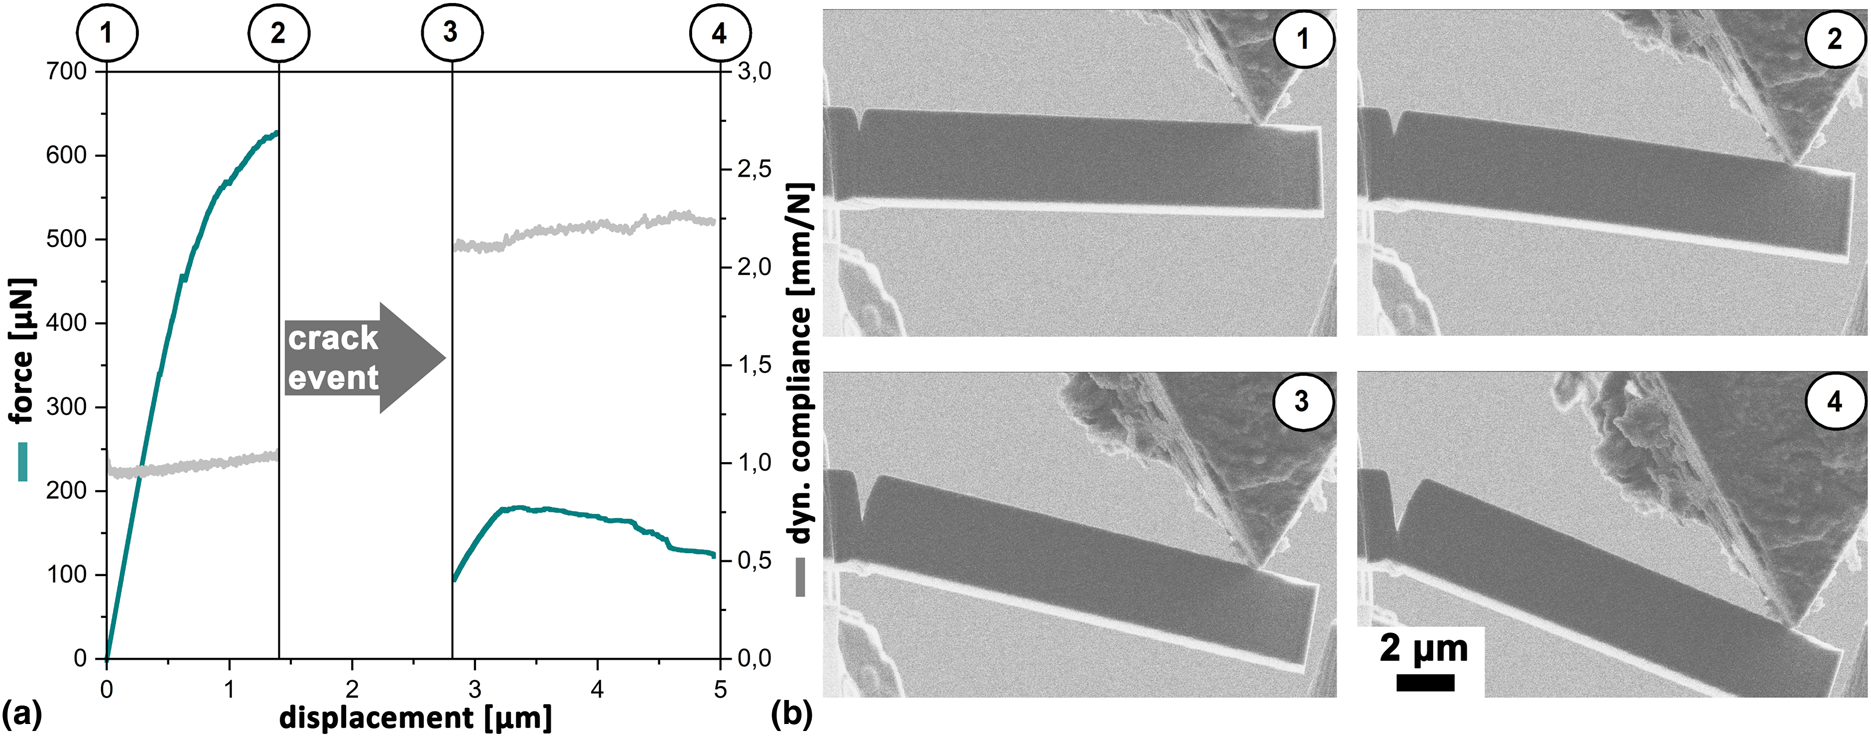
Figure 2: (a) Measured force- and dynamic compliance over displacement data, determined during the in situ CSM experiment of (II)_C2 cantilever within the SEM. The gap between (2) and (3) indicates unstable crack growth along an α2/γ interface. In (b), selected frames of the recorded video depict the evident states: (1) prior loading, (2) directly before unstable crack growth, (3) directly after unstable crack growth, and (4) at the end of the in situ experiment are shown.
As described in the experimental part, the continuous stiffness is calculated from the inverse of the dynamic compliance. Furthermore, it is used for crack length and J-integral determination, which is described in detail in the "Methodology" section.
Fracture parameter
The determined force–displacement and J-integral over crack length data of tested cantilevers from type (II) with predominant interlamellar crack growths are displayed in Figs. 3(a) and 3(b), respectively. The specimens witnessed drastic drops in force–displacement data, correlating to sudden unstable crack events along the respective interfaces. However, also minor force drops without simultaneous crack propagation are visible in Fig. 3(a) during early loading, indicating twinning or dislocation movements on activated glide systems [Reference Edwards21, Reference Lu, Zhang, Qiao, Wang, Chen and Chu23, Reference Ding, Chiu, Chu, Paddea and Su43]. Finally, a drastic force drop accompanied by extensive crack elongation indicates interface cleavage followed by the termination of the experiment. Determined J-integral values were calculated according to Eq. (3), as detailed in the data evaluation and analysis part.
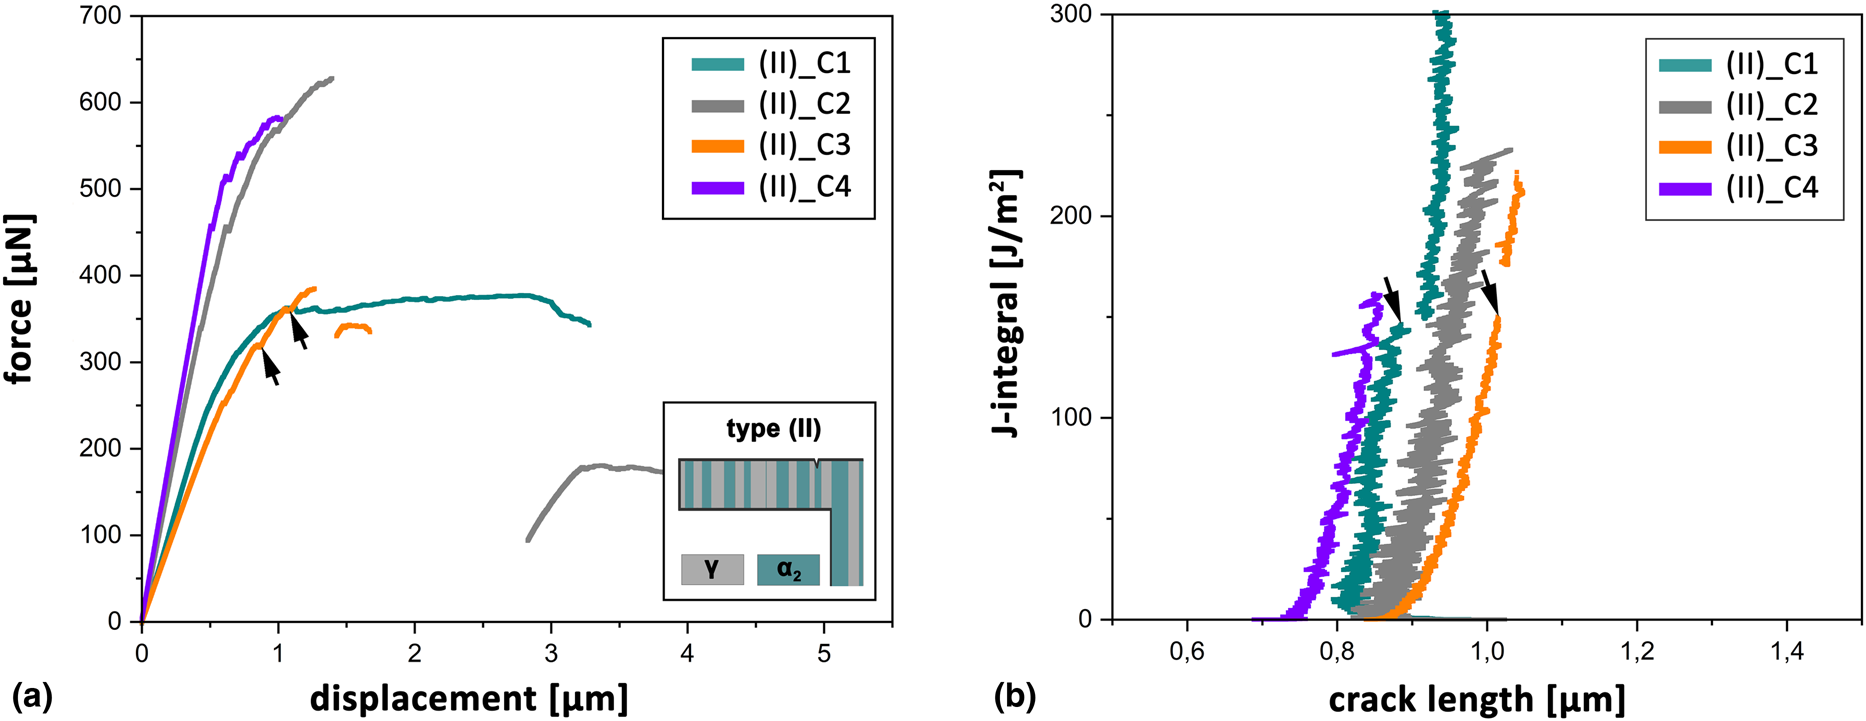
Figure 3: (a) Force–displacement and (b) J-integral over crack length data from micro-cantilever experiments with parallel orientation of the tested interfaces to the notch. Black arrows indicate minor force drops in (a) and non-fatal fracture events in (b).
The fracture parameters at final fracture or in the presence of a primary crack event are listed in Table 2, whereas K q and conditional fracture toughness from the J-integral (K q,j) are calculated from Eqs. (2) and (6), respectively. The listed K q values are calculated in the stable crack propagation regime prior to unstable crack events and constitute therefore the conditional fracture toughness. Relating parameters were determined at the corresponding position of K q. The elastic and plastic parts of the J-integral are determined according to Eqs. (4) and (5) and are displayed as J el and J pl. Furthermore, the tested interface types were validated by post-mortem SEM investigations and, therefore, constitute the actual tested interfaces.
TABLE 2: Calculated fracture toughness and J-integral (J) values of tested cantilevers.
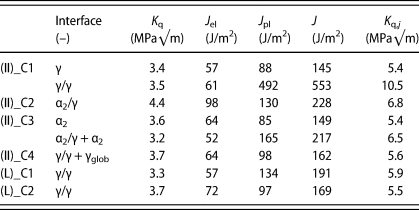
In the case of the specimen (II)_C1 and (II)_C3, two data sets are given for the primary translamellar fracture event of a single lamella and final fracture along different interfaces, respectively. In the case of the (II)_C4 specimen, γglob indicates an additional globular γ grain along the crack path. The given values of type (L) cantilevers correspond to the first significant drops in force–displacement data. Their positions are marked in Fig. 4 by black arrows. Tested interfaces are defined as γ/γ, indicating solely perpendicular γ lamellae in the tested specimen volume.
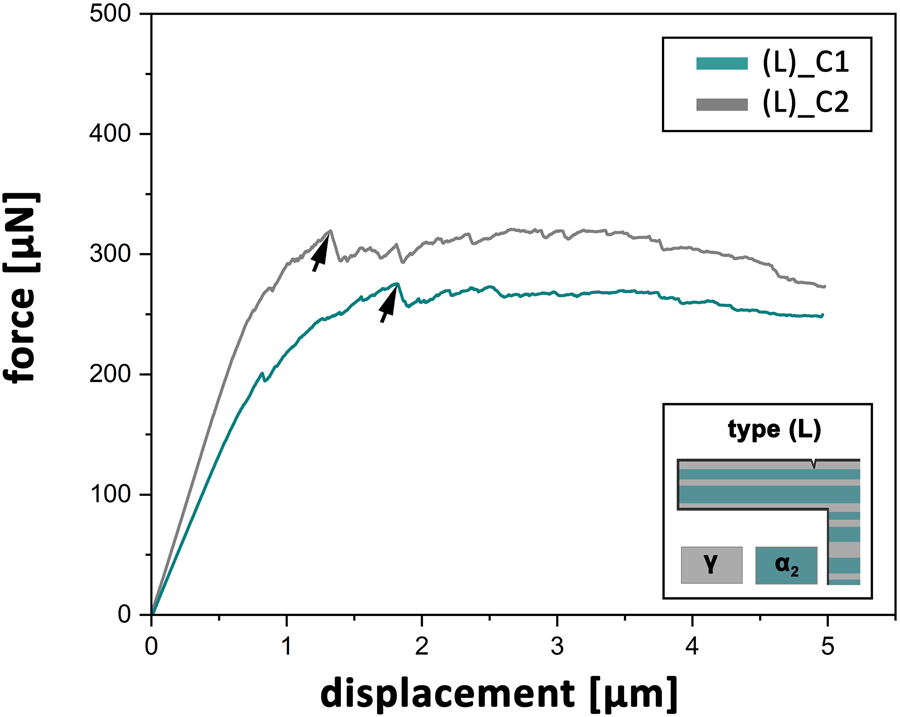
Figure 4: Force–displacement data of cantilevers exhibiting their expected crack propagation plane perpendicular to the α2/γ lamellae. Therein, distinct force drops without simultaneous crack growth are marked by arrows, indicating the positions of respective data points from Table 2.
In addition to type (II) specimens, cantilevers with their expected crack plane perpendicular to the lamellar direction were tested (type (L)). This experimental setup was suggested to result in translamellar crack propagation and corresponding force–displacement curves are displayed in Fig. 4. Backscattered electron (BSE) images of type (L) cantilevers showed merely γ lamellae with different γ/γ interfaces along the cantilevers section. Thus, a Young's modulus of 180.6 GPa was calculated with the Voigt model taking into account the strong anisotropy of elastic constants in the γ-phase [Reference Tanaka44]. The determined maximum forces at the base of type (L) cantilevers are notably lower compared to type (II) cantilevers. However, substantiated in the absence of the α2-phase, a quite ductile specimen behavior was determined. The determination of fracture parameters was implemented correspondingly to the case of type (II) cantilevers. Therefore, calculated K q and J-integral values of type (L) cantilevers are listed in Table 2. Due to the absence of unstable crack events, the positions of drastic force drops were used for the determination of K q (black arrows in Fig. 4). Owing to the absence of α2 lamellae within the tested cantilevers, the interface type was defined as γ/γ interfaces.
Crack propagation and fracture analysis
In the case of the (II)_C1 specimen, the notch was introduced within a broad γ lamella, and therefore, two different crack events were identified by fracture analysis and CSM determination [Fig. 5(a)]. Prior to the first event, the crack propagated translamellar through the massive γ lamella. At a J-integral value of 145 J/m2, a minor discontinuity with a simultaneous crack growth of 31 nm is marked in Fig. 3(b) by an arrow. At this point, the translamellar failure of the narrow γ lamella is assumed to take place [black arrow in SEM-SE image, Fig. 5(a)] and indicates the first crack event. According to Eq. (2), the determined K q amounts to 3.4 MPa√m for the failure of the γ lamellae.
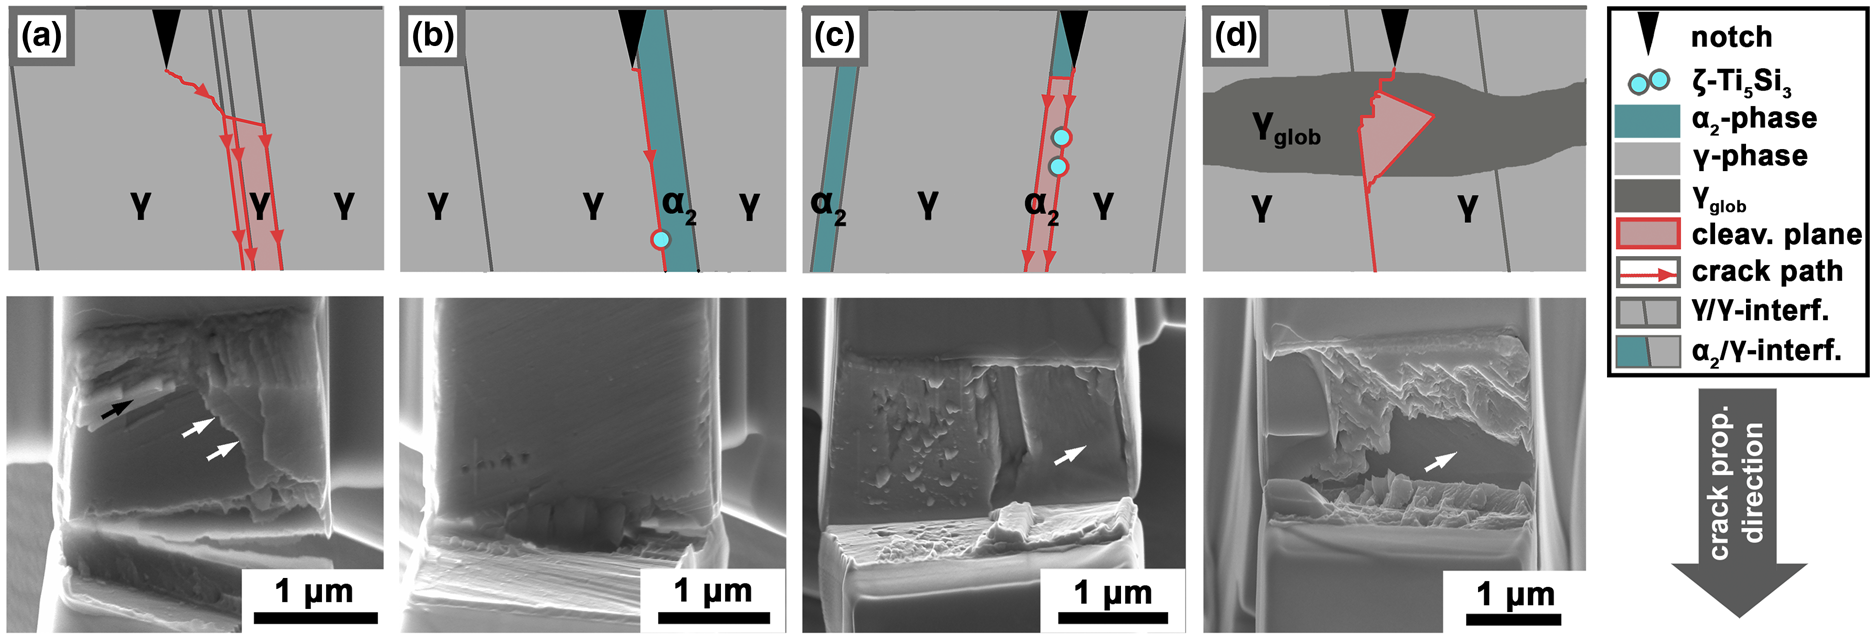
Figure 5: Sketch of the observed crack path along different interface types as well as a side view of the cantilever (top) and SEM-SE images of the corresponding fractured surfaces (bottom) are displayed. (a), The fracture along a γ/γ interface, (b) an α2/γ interface, (c) an α2/γ interface as well as an α2 lamella, and (d) the simultaneous crack propagation along a globular γ grain and γ/γ interface are depicted. Arrows indicate cleaved interfaces as described in detail within the respective section.
During the second crack event, interlamellar crack propagation along different γ/γ interfaces took place. Here, the J-integral reached a maximum value of 553 J/m2 upon considerable crack propagation of 512 nm, according to CSM determination. During in situ testing, shearing and final tearing of a ligament were observed in the SEM video, as reported in Ref. [Reference Lu, Zhang, Qiao, Wang, Chen and Chu23]. This ligament constitutes part of a failed γ lamella which is marked by white arrows in Fig. 5(a) and outlined in the sketch by splitting the fracture path. Using Eq. (6), K q,j values of 5.4 and 10.5 MPa√m were determined for the translamellar failure of a single γ lamella and final interlamellar crack growth along γ/γ interfaces, respectively [Reference Halford, Takashima, Higo and Bowen18]. Furthermore, solely the share of J pl increased from the first to second fracture event (Table 2). This indicates severe effects from plastic deformation, again evidenced by the formation of a distinct plastic zone at the bottom side of the cantilever. Along the fractured surface in Fig. 5(a), this plastic zone is visible as an undefined fractured zone, which was additionally enhanced during the fatal bending in the aftermath of the experiment.
The second specimen (II)_C2 was notched near an α2/γ interface and failed at higher force but lower displacement values compared to the (II)_C1 specimen. The crack propagation was determined to be constant during the first segment of loading [see Fig. 7(a)]. The determined K q value at the onset of fatal fracture of 667 nm amounts to 4.4 MPa√m and, therefore, constitutes the highest measured value in this study. The calculated J-integral raised to 228 J/m2 before the first unstable crack propagation and is significantly higher compared to the first fracture event of (II)_C1 specimen along a γ interface. Here, the elastic and plastic share of the measured J-integral are both equally elevated in contrast to the first fracture event of (II)_C2 specimen. Afterward, the crack was decelerated by the combined effect of crack deflection at ζ-Ti5Si3 silicide particles and minor plastic zone formation at the bottom side of the cantilever. These particles were pulled out of the γ interface and stuck within the α2 lamella [Fig. 5(b)]. Due to the strong affinity of Si to Ti and the α2-phase, their globular shape and position along the interface, these particles are assumed to be ζ-Ti5Si3 silicides as reported in Refs. [Reference Klein, Usategui, Rashkova, Nó, San Juan, Clemens and Mayer9, Reference Klein, Rashkova, Holec, Clemens and Mayer45].
The force–displacement curve of the (II)_C3 specimen behaves similarly to the already discussed (II)_C2 specimen, despite the deviation angle φ pointing toward the opposite direction. This is explained by the fact that the (II)_C3 and (II)_C5 cantilevers were fabricated mirror-inverted to enable higher occupancy within the limited extent of the selected α2/γ colony. Again, the fractured surface unveiled numerous ζ-Ti5Si3 particles and also a part from an α2 lamella could be identified. Due to the presumed strengthening effect of ζ-Ti5Si3 silicide particles on the α2/γ interface, the crack was forced to propagate through the enclosed α2 lamella to the facing α2/γ interface exhibiting no strengthening particles [Fig. 5(c), white arrow]. This may be the reason of the lower maximum force level and consequent lower K q value of 3.4 MPa√m of this cantilever [Fig. 3(a)] [Reference Göken, Kempf and Nix46]. As already observed in Fig. 3(b), the major amount of these particles remained on the α2 interface. A study regarding the interface structure of ζ-Ti5Si3 particles within the γ-phase unveiled in- and semicoherent interface types to be cleaved [Reference Sun, Kim, Cao, Lee and Yan47]. Therefore, different interface types and orientation relationships between the γ-phase and polygonal or needle-shaped ζ-Ti5Si3 particles were reported and may contrary influence the cleavage energy. During in situ testing, initially steady crack growth was determined by CSM until a J-integral of 149 J/m2. Then, sudden crack propagation of 11 nm could be observed [Fig. 3(b)]. This first crack event was presumably linked to the delamination of the α2 lamella segment. Afterward, the crack again propagated steadily for 17 nm to a J-integral of 217 J/m2, followed by a second crack event extending 665 nm. According to in situ observations and fracture analysis, the α2/γ interface and the α2 lamella were cleaved during this fracture event. Hence, the strengthening effect of the particles at the α2/γ interface forced the crack to the opposing interface and consequently the α2 lamella cleaved. This is substantiated by observations of Heatherly et al. [Reference Heatherly, George, Liu and Yamaguchi48] who identified the cleavage of α2 lamellae as a primary failure mechanism within α2/γ colonies. On the right-hand side of the fractured surface in Fig. 3(c), the cleaved α2 lamella is encountered.
The notch in the (II)_C4 cantilever was located within a coarse γ lamellae and the specimen also contains an elongated globular γ grain within the expected crack path. In Fig. 5(d), a sketch of the reconstructed crack path and an SEM image of the fractured surface are depicted. Based on CSM, the crack evolved with a steady propagation rate over the first 95 nm. Here, only minor drops were detected in the force–displacement curve, which may be linked to the activation of dislocation movement or mechanical twinning processes within the γ-phase. Based on the in situ CSM experiment, the J-integral reached a maximum value of 162 J/m2 prior to unstable crack propagation. This is in good accordance with the (II)_C1 value before translamellar unstable crack growth through a coarse γ lamella. Here, with a conditional fracture toughness of 3.7 MPa√m and a calculated K q,j of 5.6 MPa√m, enhanced values in contrast to (II)_C1 cantilevers could be determined. Thereafter, the specimen failed by concurrent crack growth through the globular γ grain and coarse γ lamella. The deflection of the crack path along a presumed {111} splitting plane within the globular γ grain may be responsible for the enhanced fracture properties compared to the (II)_C1 specimen [Reference Appel, Lorenz, Sparka and Wagner28, Reference Neogi, Alam, Hartmaier and Janisch36, Reference Appel and Christoph49, Reference Appel and Wagner50]. Therefore, the presence of globular γ grains within α2/γ colonies may be considered as beneficial for the case of improved fracture toughness. Furthermore, the crack front within the coarse γ lamella reached a subjacent γ/γ interface, which is highlighted by a white arrow in (d). During the experiment, no evident plastic zone evolved at the bottom side of the cantilever.
In the case of type (L) specimens, the notch was introduced perpendicular to the lamellar interfaces and, therefore, in general exhibits translamellar crack propagation. Furthermore, the absence of the α2-phase within the tested cantilevers could be determined by SEM investigations and leads to relatively ductile behavior.
As visible in Fig. 4, determined force–displacement curves of (L)_C1 and (L)_C2 specimens are almost identical in the first section. Therefore, both of the tested cantilevers are regarded as identical. Here, a constant slope and constant crack elongation could be determined until position (1) in Fig. 8. In the following, force–displacement curves of specimens (L)_C1 and (L)_C2 both contain minor force drops including a distinct increase of displacement (see black arrows in Fig. 4). Hence, the sudden activation of glide systems within the γ-phase with emerging twins or dislocation movements are presumed [Reference Ding, Chiu, Chu, Paddea and Su43].
The translamellar crack propagation is sketched in Fig. 6(a), including SEM images of the fractured surface shown in Fig. 6(b) and a side view of the tested (L)_C1 cantilever in Fig. 6(c). The ragged surface indicates severe plastic deformation during crack propagation. Furthermore, no distinct cleavage plane is visible and the crack was stopped at a γ/γ interface [Fig. 6(c)].
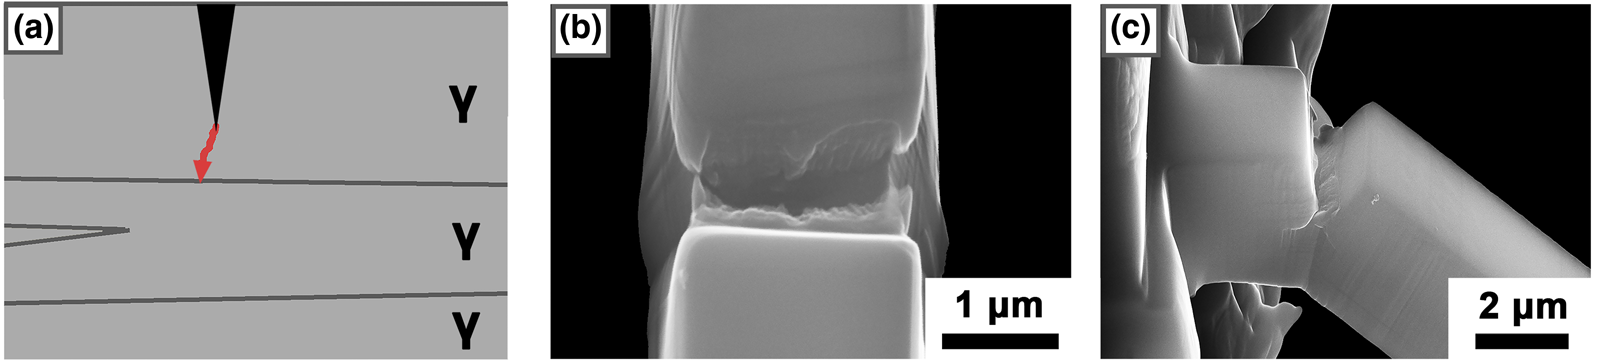
Figure 6: For specimen (L)_C1 (a) a sketch of the observed crack path through γ lamellae with (b) the corresponding fractured surface and (c) a side view showing the crack path are displayed. Since the type (L) cantilevers were located at the same position within the α2/γ colony, corresponding lamellae were tested and only one representative sketch and fractured surface are displayed.
Furthermore, K q was determined after Eq. (2) at a designated force of 275.5 μN for (L)_C1 and 319.5 μN for (L)_C2 specimen, which leads to conditional fracture toughnesses of 3.3 and 3.7 MPa√m, respectively. Since the cantilevers were positioned at an equal lateral height within the hosting α2/γ colony, similar γ lamellae were targeted during testing. Hence, the results of (L)_C1 and (L)_C2 cantilevers can be considered as equivalent. However, lower K q values were determined due to the loss of strength of a γ/γ arrangement in contrast to an α2/γ composite [Reference Miyaguchi, Otsu, Takashima and Takeyama6]. Therefore, the absence of α2/γ interfaces enables ductility and higher deformation durability without or at least only with minor crack propagation compared to type (II) specimens [Reference Huang, Bowen and Jones17, Reference Yoo and Fu51]. However, a similar mean J-integral value of 180 ± 11 J/m2 for translamellar crack propagation through a γ lamella as in the case of the (II)_C1 cantilever was determined.
Computer vision evaluation
In Fig. 7, the calculated crack length after CSM is compared with the crack length determined by the CV method from the in situ SEM video of (II)_C2 cantilever, constituting a representative for type (II) specimen. For better visibility, both crack length data sets were smoothed applying a Lowess filter [Reference Cleveland52]. Here, different positions in Figs. 7(a) and 7(b) are marked to indicate stable crack growth (1), the maximum of stress intensity prior to unstable crack growth (2), the first data point after crack arrest (3), and the end of the experiment (4), respectively. The crack length data, evaluated by the CSM method, decreased to an initial value of about 866 nm and further indicates stable crack growth with increasing displacement. This behavior is attributed to the initial contact stiffness at the onset of the experiment, due to the contact effects of the indenter [Reference Alfreider, Kozic, Kolednik and Kiener41]. During stable crack growth, the determined crack lengths are almost coincident between the two methods. The onset of unstable crack growth was first detected by the CSM method, which is reasoned by the limited scan speed of the SEM with 6 frames/s. The evaluated crack propagation during the unstable crack event marked in Fig. 7(b) by (2/3) amounts to 713 and 822 nm for the CSM and CV methods, respectively. Corresponding side-view SEM images in the SE mode are displayed in Fig. 7(c). However, a notable deviation of 441 nm between these methods in position (4) is visible. This behavior can be explained, on the one hand, by the formation of a distinct deformation zone at the bottom side of the cantilever and, therefore, in an increased effective cross-section. On the other hand, the CV method is merely able to track the crack path in one dimension. The fractured surface in Fig. 5(b) indicates an inconsistent crack growth along its cross-section. Here, the crack propagates further on the left-hand side of the fractured surface, featuring the visible part during in situ testing. Therefore, a combination of these effects is considered as responsible for the deviation. However, data analysis regarding toughness values and J-integral were only performed prior to first detected unstable crack growth and are, therefore, unaffected by this phenomenon occurring at large deflections and crack extensions.
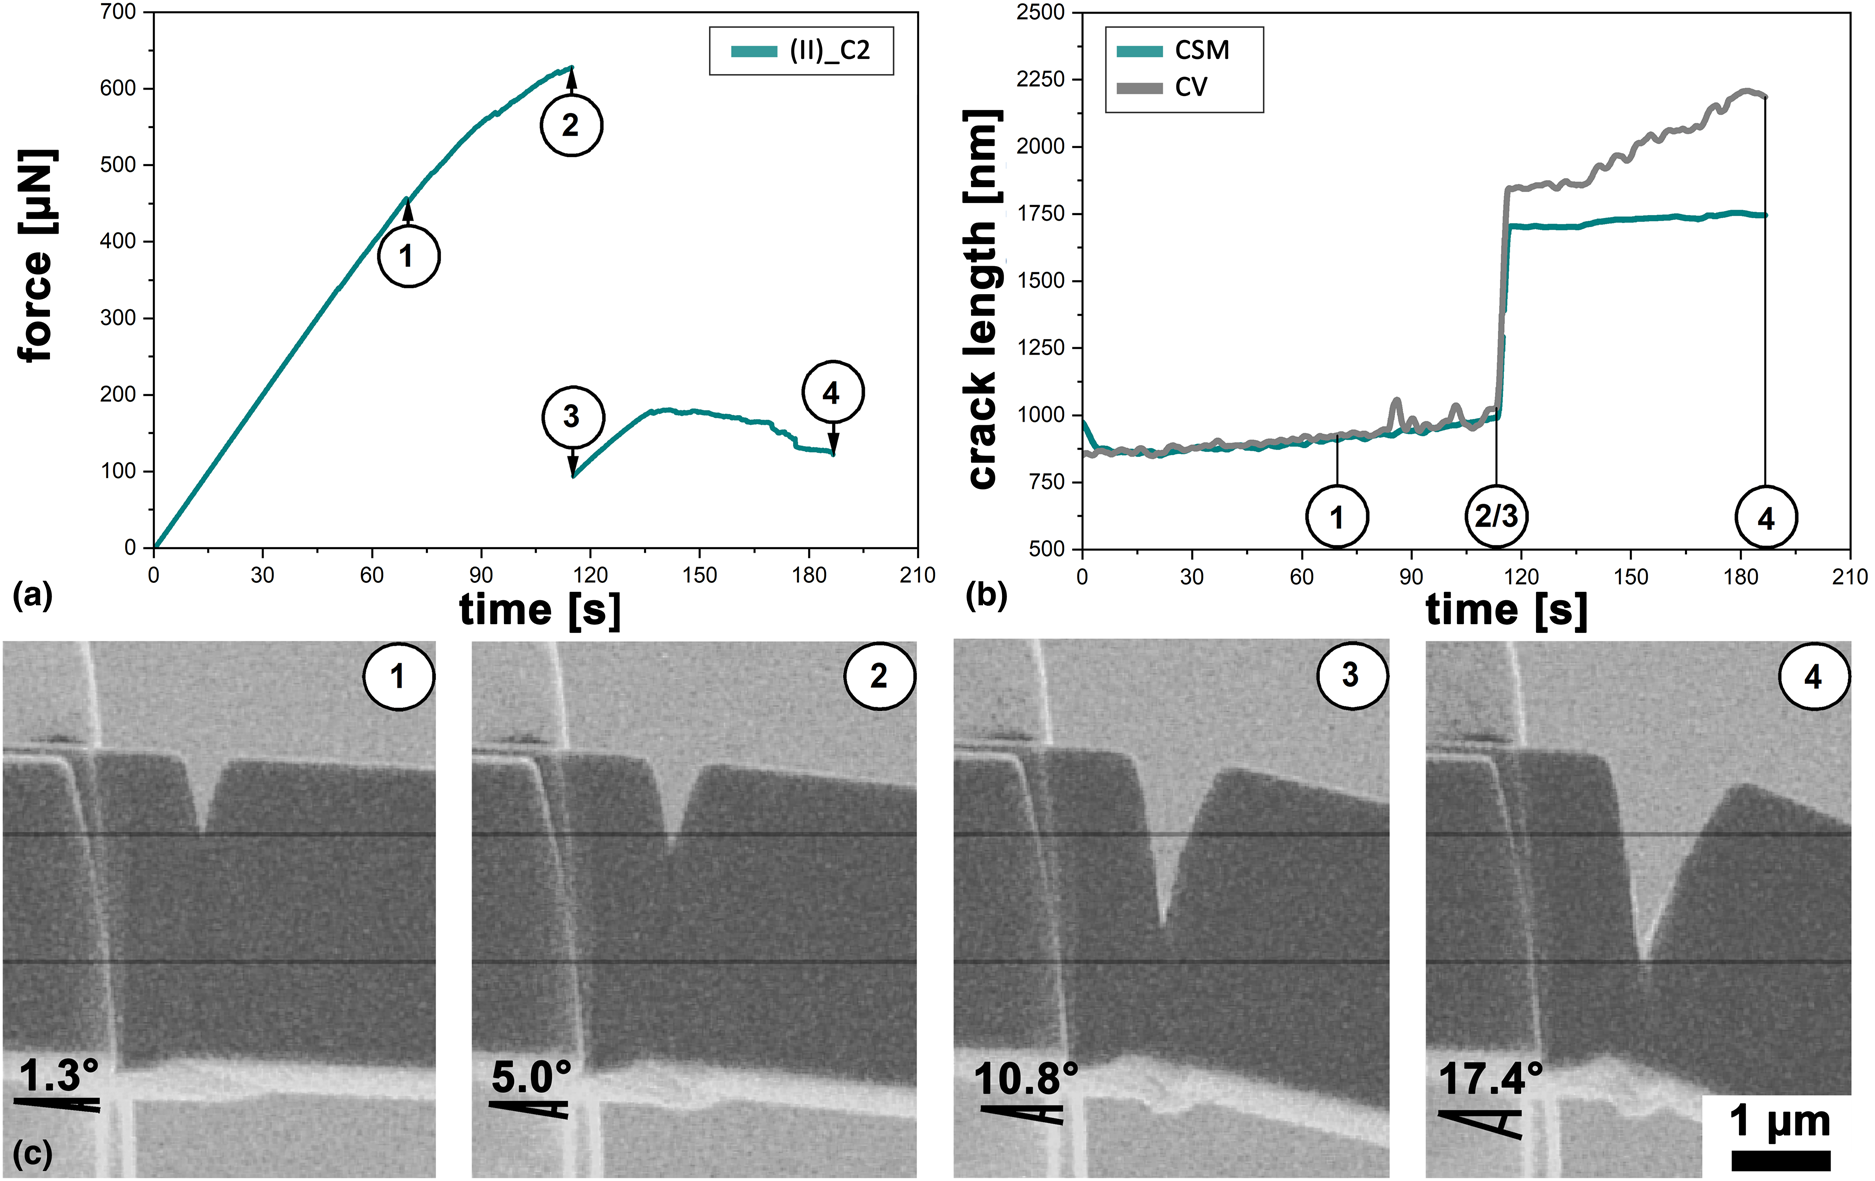
Figure 7: (a) Force–time data and (b) crack length–time data, determined by CSM and CV, of the (II)_C2 cantilever are displayed. Furthermore, positions from 1–4 marked in (a) and (b) correspond to the detailed SEM images in (c). These micrographs represent side-view snapshots of the in situ SEM video and contain two horizontal lines to highlight crack growth during the experiment. Given angles indicate the bending angle in contrast to the unloaded cantilever.
Also, for type (L) cantilevers, the crack length was determined by the CSM and CV methods, respectively. The corresponding force- and crack length–time data for the (L)_C2 cantilever are displayed in Figs. 8(a) and 8(b). Numbers from 1 to 4 indicate the respective positions of SEM micrographs recorded during in situ experiments [Fig. 7(c)]. The an calculated by CSM includes an initial contact phenomenon during the first seconds of the experiment. However, an average deviation of 48 ± 6 nm is determined between the different methods until position (2). Therefore, a significant force drop evident in (a) (2) is accompanied by no measurable crack propagation in (b) (2), indicating mechanical twinning or dislocation slip events on an activated [111] plane within the prevailing γ lamella [Reference Edwards21, Reference Palomares-García, Pérez-Prado and Molina-Aldareguia31, Reference Palomares-García, Pérez-Prado and Molina-Aldareguia34, Reference Appel and Wagner50, Reference Appel, Paul and Oehring53]. The result of severe dislocation activity is visible as a band-like structure in (c) (4) and highlighted by an arrow. Furthermore, an increasing deviation in determined crack lengths from position (3) is noted. This deviation increases with the emerging blunting of the crack tip and increasing bending angle. A decreasing crack length as determined by the CSM method would indicate an apparent increase in stiffness during the experiment. Under the consideration that the Young's modulus remains constant, geometric changes of the cantilever must be taken into account to explain this. Furthermore, a minor slip of the wedge-shaped indenter away from the notch was noticed during the experiment. However, according to Eq. (1), this would lead to a decrease of kn. Therefore, the effective cross-section of the cantilever is increased due to a combined effect of crack-tip blunting and the formation of a plastic zone at the bottom side of the cantilever [Reference Du, Shen, Xiong, Shang, Wang and Fu54]. This behavior becomes noticeable for bending angles above 7.1° or a displacement of 2.23 μm and, therefore, does not affect the results of Table 2. Apart from this, an increasing angle results in a change of the alignment of the wedge and the tested cantilever. This may influence the contact stiffness between the indenter and the specimen, thus resulting in a deviation of the calculated crack length at higher load-line displacements. Furthermore, a minor deviation of the crack from the ideal notch plane was determined at the positions 3 and 4, which may also contribute to the observed discrepancy.
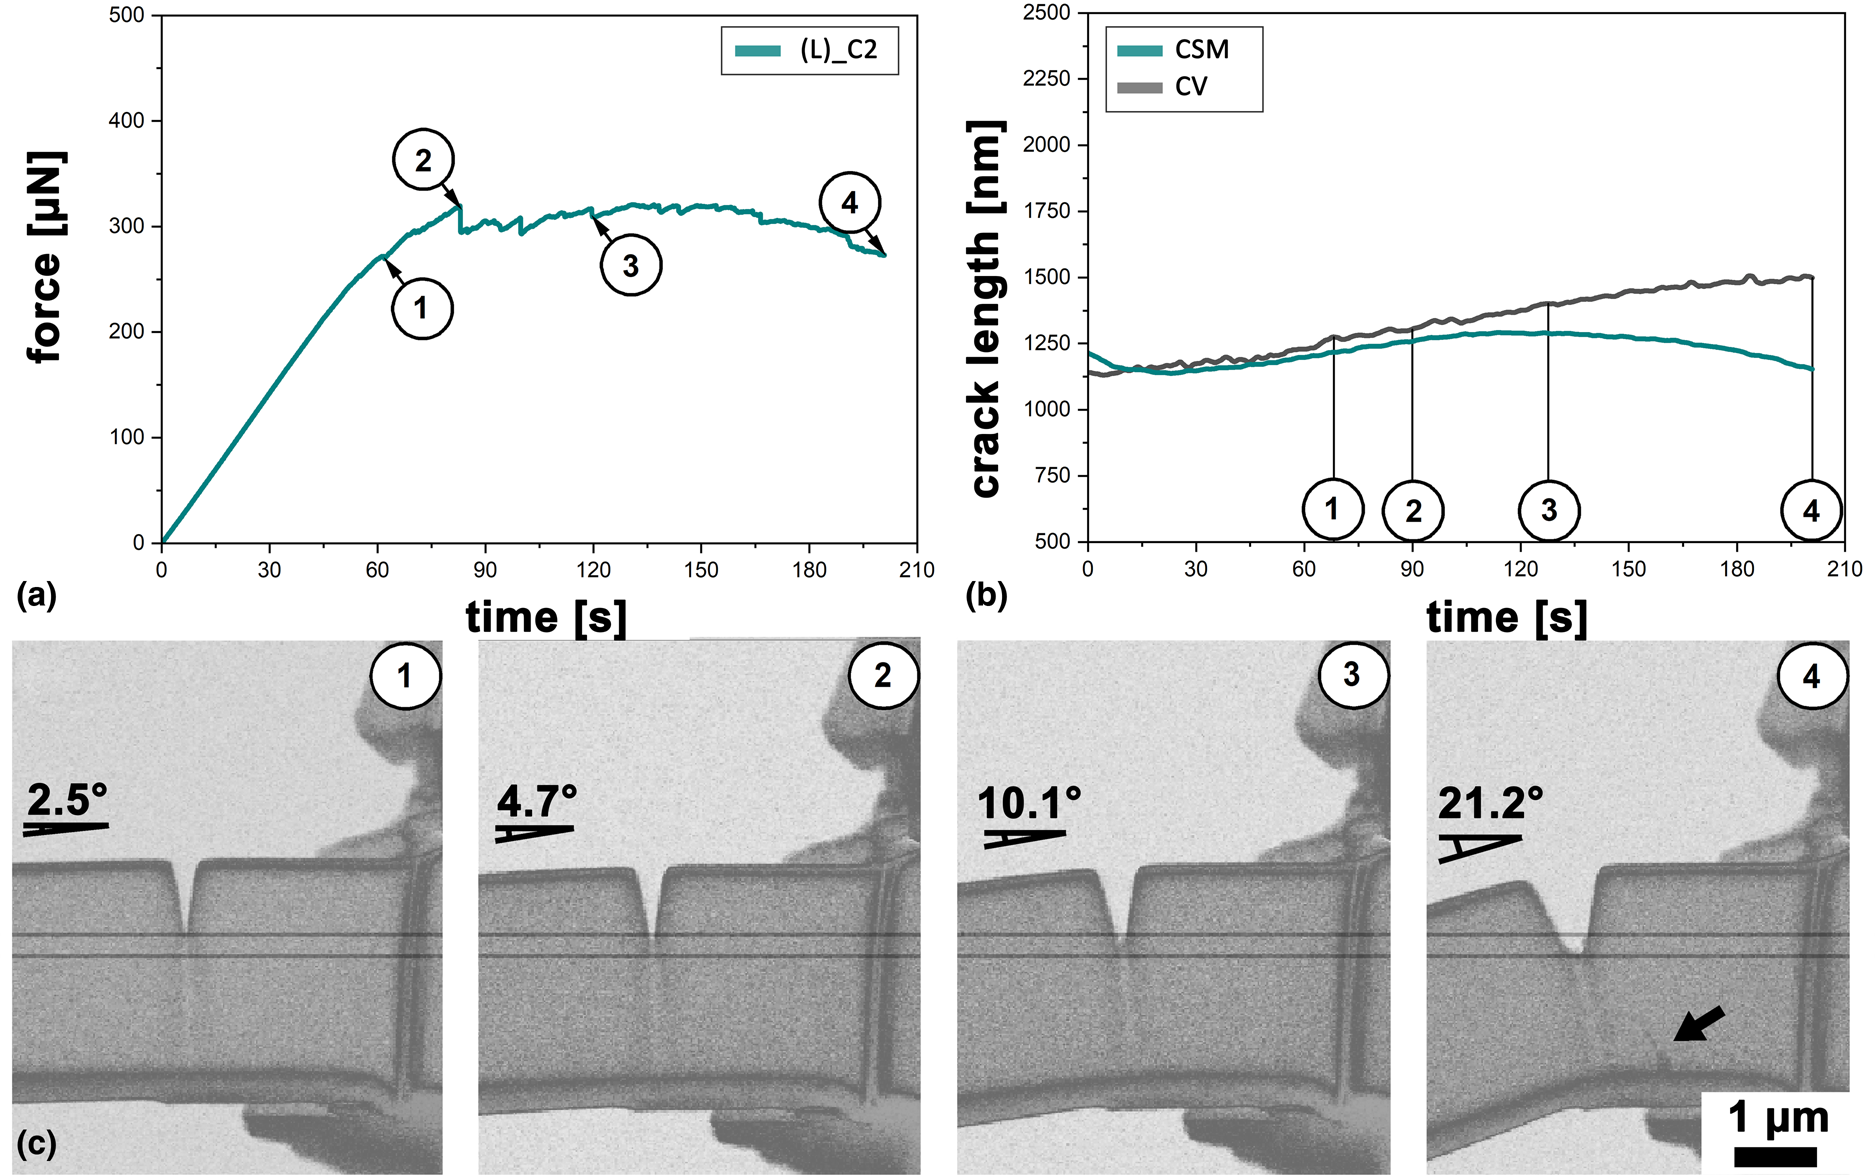
Figure 8: (a) Force–time data and (b) smoothed crack length–time data, determined by CSM and CV, of the (L)_C2 cantilever are displayed. Further, positions from 1–4 are marked in (a) and (b) corresponding to detailed images in (c). These micrographs are side-view snapshots of the in-situ SEM video and contain two horizontal lines to indicate crack growth during the experiment. Furthermore, the displayed bending angle indicates the deviation from the initial orientation of the cantilever in the advance of the experiment. In (c) (4), a black arrow denotes the presence of a band-like structure, visible on the cantilever's surface. Within the supplementary material (Supplementary Fig. S2), an SE SEM image displays the band-like structure in higher resolution and magnification.
Young's modulus
Since the elastic properties are crucial in analyzing the data, an additional unnotched cantilever featuring similar dimensions as specimen (II)_C4 was fabricated to validate calculated stiffness values and to verify the calculated Young's modulus for type (II) specimens. This cantilever also exhibited a negative deviation angle φ of −7.7° between lamellar orientation and presumed crack propagation direction due to the cantilever arrangement during fabrication. Furthermore, the distance between the base and the indenter (11.39 μm) was kept constant compared to (II)_C4 specimen. Furthermore, the initial stiffness of this unnotched cantilever (k 0) was determined from the corrected compliance. This compliance was augmented by subtracting the smoothed base compliance, consisting of the contact and machine compliance, which was determined at the base of the tested cantilever. The k 0 value could then be determined to be 1548 N/m in the case of the (II)_C5 cantilever. Using Eq. (1), a Young's modulus of 186.8 GPa for the specimen (II)_C5 was determined, which is in excellent accordance with the modulus of 189 GPa calculated after the Reuss model (see the "Data evaluation and analysis" section). At this point, it should be noted that the determination of the Young's modulus is quite sensitive to minimal errors of the used parameters. Especially, caution in the determination of the dimensions B, W, and L is required. Therefore, a high standard deviation of the determined Young's modulus is expected.
Discussion
In general, type (II) specimens exhibit very similar force–displacement curves, containing an initial elastic part denoted by a constant slope. Furthermore, a matching stable crack elongation could be determined by CSM and CV. This is accompanied by minor but sudden drops visible within the force–displacement data of Fig. 3(a) (black arrows). These drops indicate the formation of twins or the activation of discrete dislocation glide events within γ lamellae on specific {111} planes [Reference Iqbal, Pyczak, Neumeier and Göken27, Reference Appel, Paul and Oehring53]. Based on acoustic emission experiments, the development of mechanical twins within the γ phase is activated earlier and more pronounced as dislocation induced deformation [Reference Kauffmann, Bidlingmaier, Dehm, Wanner and Clemens55, Reference Marketz, Fischer, Kauffmann, Dehm, Bidlingmaier, Wanner and Clemens56]. The formation of twins is furthermore considered as a major deformation mechanism in micro-mechanical specimens and within the plastic zone in front of the crack tip [Reference Huang, Bowen and Jones17, Reference Chan30, Reference Palomares-García, Pérez-Prado and Molina-Aldareguia31, Reference Ding, Chiu, Chu, Paddea and Su43]. Hence, the role of ordinary dislocations increases with increasing deformation [Reference Marketz, Fischer, Kauffmann, Dehm, Bidlingmaier, Wanner and Clemens56].
The measured conditional fracture toughnesses from type (II) specimens are in good agreement with results from polysynthetically twinned TiAl alloys exhibiting a similar lamellar orientation, where maximum values of 3.6 or 3.4 MPa√m were observed [Reference Miyaguchi, Otsu, Takashima and Takeyama6, Reference Ding, Chiu, Chu, Paddea and Su43]. Halford et al. [Reference Halford, Takashima, Higo and Bowen18] determined a mean K q value of 3.7 MPa√m for interlamellar fracture mode regarding the so-called TiAl-Alloy 7. Consequently, higher values could be measured by increasing the translamellar ratio of the fractured surface [Reference Halford, Takashima, Higo and Bowen18].
The elevated K q and J-integral values (Table 2) along α2/γ interfaces from type (II) specimen are in agreement with the computational results of the work of separation energies for different γ interface types and α2/γ interface within a binary TiAl alloy [Reference Neogi, Alam, Hartmaier and Janisch36, Reference Kanani, Hartmaier and Janisch57]. Kanani et al. [Reference Kanani, Hartmaier and Janisch57] proposed that the separation energies of an α2/γ interface exceed those of different γ interface types. According to Yoo and Fu [Reference Yoo and Fu51], the cleavage energy of different γ/γ interfaces ranges between 4.2 and 4.4 J/m2, whereas it amounts to 4.5 J/m2 for α2/γ interfaces. An increased concentration of interstitials leads to a reduction of the cleavage energy of the α2/γ interfaces to 3.8 J/m2.
The determined K q values of type (II) specimens behave similarly, except specimen (II)_C1, where a distinct plastic zone is formed at the bottom side of the cantilever. Furthermore, the presence of 0.3 at.% of C in the TNM+ alloy leads to an increased hardness of the α2- and γ-phase and is predominantly enriched within α2 lamellae [Reference Klein, Rashkova, Holec, Clemens and Mayer45, Reference Klein, Schachermayer, Mendez-Martin, Schöberl, Rashkova, Clemens and Mayer58]. The results of this study confirm a higher fracture strength of α2/γ interfaces despite the assumed embrittling effect of C within α2 lamellae [Reference Klein, Schachermayer, Mendez-Martin, Schöberl, Rashkova, Clemens and Mayer58]. This is evoked by the higher solubility of C and Si within the α2-phase compared to the γ-phase. Therefore, compared to polysynthetically twinned γ-TiAl, slightly higher K q values are achieved for the TNM+ alloy. The stabilization annealing step of the heat treatment at 900 °C for 3 h leads to a decreasing mean width of α2 lamellae and concomitant precipitation of ζ-Ti5Si3 silicides along with repeating α2/γ interfaces [Reference Klein, Usategui, Rashkova, Nó, San Juan, Clemens and Mayer9, Reference Wang and Nieh59, Reference Karadge, Kim and Gouma60, Reference Gouma, Mills and Kim61]. Karadge et al. [Reference Karadge, Kim and Gouma60] proposed the movement of C from α2/γ interfaces into the center of α2 lamellae based on energy-filtered transmission electron microscope (TEM) investigations. This is reasoned by the increasing size of octahedral sites by decreasing misfit strains along the α2/γ interface to the center of the adjoining α2 lamellae [Reference Appel and Christoph49, Reference Karadge, Kim and Gouma60, Reference Hazzledine62]. In contrast to this, Si is enriched along α2/γ interfaces and if the solubility level is reached, ζ-Ti5Si3 silicides are precipitated [Reference Klein, Usategui, Rashkova, Nó, San Juan, Clemens and Mayer9, Reference Wang and Nieh59]. Therefore, during testing, failure along γ/γ interfaces and translamellar α2 fracture is preferred. This may be explained by the assumed strengthening effect of persistent ζ-Ti5Si3 silicides, enabling to compensate the embrittling effect of C within α2/γ colonies. However, the strengthening effect of ζ-Ti5Si3 silicides located along the α2/γ interface could not be precisely quantified. Nevertheless, the crack was deflected from its intended path, which indicates a distinct toughening effect for an increasing number of particles [Reference Kruzic, Campbell and Ritchie63]. Though, due to different ζ-Ti5Si3 morphologies and interface types, the strengthening effect could not be confirmed doubtlessly [Reference Sun, Kim, Cao, Lee and Yan47].
Concluding, fracture parameters, crack propagation, and force–displacement data of type (II) specimens confirm a semi-brittle interlamellar fracture behavior along γ/γ and α2/γ interfaces [Reference Pippan, Wurster and Kiener64].
In the case of type (L) specimen, lower K q values were determined due to the loss of strength of a γ/γ laminate in contrast to an α2/γ arrangement [Reference Miyaguchi, Otsu, Takashima and Takeyama6]. Calculated K q,j values and elevated J pl fractions compared to J el values indicate a major influence of plastic deformation during the experiments. According to Appel and Wagner [Reference Appel and Wagner50], deformation of the γ-phase primarily takes place on {111} planes by ordinary dislocations and mechanical twinning. When the crack follows {111}γ planes, it is deflected at γ/γ interfaces due to the crystallographic orientation change of the γ lamellae. In front of the crack tip, the formation of deformation twins within the several micron-sized plastic zone was reported [Reference Huang, Bowen and Jones17, Reference Ding, Chiu, Chu, Paddea and Su43, Reference Appel and Wagner50]. During the in situ testing of the (L)_C2 cantilever, a band-like structure evolved on the surface and is visible in Fig. 8(c) [Reference Edwards21, Reference Iqbal, Pyczak, Neumeier and Göken27]. This indicates twinning or high dislocation mobility and, therefore, distinct ductile behavior of this specimen condition. Ding et al. determined the importance of mechanical twinning within a polysynthetically twinned TiAl alloy and identified the formation of twins in front of the crack tip as the main reason for crack growth [Reference Ding, Chiu, Chu, Paddea and Su43].
Regarding the results of CSM and CV measurements, the determined crack lengths are in good accordance until the cleavage of the α2/γ interface of (II)_C2 specimen. The measured deviation between both data sets in position (3) of Fig. 7(b) was determined to be 145 nm. Considering the inconsistent fractured surface in Fig. 5(b), a reduced mean crack propagation of 167 nm as indicated by CV was observed. Besides this, the already mentioned geometric changes during testing may explain the deviation in position (4).
Furthermore, the determined crack lengths from CSM and CV measurements of (L)_C2 specimen are in good accordance up to a displacement of 2.23 μm, which is located between position (2) and (3) in Fig. 8. Due to the formation of a plastic zone accompanied by the appearance of a glide step on the surface of the cantilever and the blunting of the crack tip a geometric change of the cantilever ensues. Furthermore, a deviation of contact stiffness originating from the geometric details of the used indenter tip, due to the changing contact angle must be taken into account. However, considering a straight crack front, the complementary CV method enables to access valid crack lengths during the entire experiment. Thus, the translamellar crack propagation was determined to be constant during the loading part of the experiment. The force–displacement data and the observation of a band-like structure indicate a distinct ductile behavior of the investigated material during translamellar fracture experiments [Reference Pippan, Wurster and Kiener64].
These findings are in contrast to macroscopic tests on the investigated alloy, where a rather brittle behavior is reported [Reference Wimler, Lindemann, Clemens and Mayer5]. To enhance the fracture toughness of the entire α2/γ colony, strengthening of the weakest interface type is required. Furthermore, the number of α2/γ interfaces can be increased by a sufficient heat treatment to decrease the lamellar spacing. The amount of α2 phase and ζ-Ti5Si3 silicides may be optimized by the alloying concept in order to enlarge the number of strengthened α2/γ interfaces. However, macroscopically thinner lamellae within the α2/γ colonies would result in a strain localization along the colony boundaries and thus higher tendency for crack initiation [Reference Edwards, Di Gioacchino and Clegg32, Reference Schnabel and Bargmann39]. Also, a change in the α2/γ ratio and significantly lower lamellar spacing are reported to affect coherency [Reference Chauniyal and Janisch19, Reference Hazzledine62]. Furthermore, the presence of small globular γ grains along different interfaces may improve fracture behavior. To obtain balanced mechanical properties and optimized fracture behavior, all contributing length scales must be considered and evaluated as reported in Refs. [Reference Kastenhuber, Klein, Clemens and Mayer11, Reference Leitner, Schloffer, Mayer, Eßlinger, Clemens and Pippan12, Reference Appel, Paul and Oehring53].
The minimal size of the calculated plastic zone exceeds the dimensions of the fabricated cantilevers by far [65]. Therefore, the fracture toughness according to ASTM E399 is not size-independent and thus shown values are of conditional nature.
Conclusions
Within this study, micro-sized cantilevers with a parallel or perpendicular orientation of α2/γ lamellae to the expected crack propagation plane (type (II) or (L)) were successfully fabricated from a fully lamellar intermetallic TNM+ alloy. These cantilevers were tested at RT in situ with simultaneous CSM during loading and supplementary recording of in situ SEM videos. This allows the determination of crack propagation based on continuous stiffness and CV methods for both specimen types. K q, J-integral, and the resulting K q,j were calculated and compared with data from the existing literature allowing the following conclusions to be drawn:
(i) Based on the force–displacement data, the formation of glide steps and the existence of a distinct plastic zone at the bottom side of certain cantilevers, a semi-brittle to ductile fracture behavior of the investigated TNM+ alloy is assumed to prevail in micro-scale.
(ii) K q values range, in case of type (II) cantilevers, between 3.2 and 4.4 MPa√m for γ/γ and α2/γ interfaces, respectively. Type (L) cantilevers reached 3.3 and 3.7 MPa√m due to significant lower attained force levels, based on the lack of α2 lamellae in the tested volumes.
(iii) Furthermore, the highest J-integral value of 553 J/m2 was determined for a γ/γ interface in the case of a type (II) cantilever. This was substantiated in the good deformability of a rather broad γ lamella, exhibiting an adequate number of available glide or twin planes next to the crack tip.
(iv) Bridging of α2 and γ ligaments, crack deflection due to globular γ grains along γ/γ interfaces and an assumed strengthening effect based on the presence of ζ-Ti5Si3 silicides along α2/γ interfaces could be identified for type (II) cantilevers.
(v) Due to the lack of α2 lamella and the presence of numerous available slip systems within the γ-phase, gradually blunting of the crack tip and a ductile material behavior was determined for type (L) cantilevers. Furthermore, during in situ experiments, they exhibit a steady crack propagation without pronounced unstable events.
(vi) In situ crack length determination by CSM and an ex situ evaluation of the recorded video signal by CV was implemented for selected specimens. While both generally agree well upon force drops or severe crack propagation events, a distinct deviation in determined crack lengths was observed for type (L) cantilevers at large bending deflections.
Concluding, fundamental knowledge concerning fracture behavior of different interface types of an advanced 4th generation TiAl alloy was gathered. Hence, the understanding of critical material parameters and, thus, the basis for improvements regarding crack propagation in fully lamellar microstructures is provided.
Methodology
Material
The material investigated in this study is based on the TNM alloying concept improved by nominal additions of 0.3 at.% C and 0.3 at.% Si. The actual chemical composition is Ti–43.3Al–4.02Nb–0.96Mo–0.12B–0.34C–0.31Si (in at.%) and is denominated as TNM+ alloy [Reference Mayer, Erdely, Fischer, Holec, Kastenhuber, Klein and Clemens2, Reference Klein, Usategui, Rashkova, Nó, San Juan, Clemens and Mayer9, Reference Burtscher, Klein, Mayer, Clemens and Fischer10]. It was processed by plasma arc melting (PAM) and supplied by Hanseatische Waren Handelsgesellschaft mbH & Co KG, Bremen, Germany. After casting, the material was subjected to a hot isostatic pressing (HIP) procedure at 1200 °C and 200 MPa for 4 h to homogenize the microstructure and reduce residual casting porosity. The material's microstructure investigated in the present study was adjusted in atmospheric condition in a high-temperature furnace Carbolite RHF 1600 equipped with three type-S thermocouples. The heat treatment according to Klein et al. [Reference Klein, Usategui, Rashkova, Nó, San Juan, Clemens and Mayer9], enabling the precipitation of γ lamellae within the supersaturated α2 grains, leads to the formation of α2/γ colonies, which represent the FL microstructure subjected to the detailed analyses reported here. The resultant mean lamellar spacing was 248 nm, including a standard deviation of 150 nm [Reference Burtscher, Klein, Mayer, Clemens and Fischer10]. This was determined by conventional TEM using a Philips CM 12 microscope in the edge-on condition of the TNM+ specimen [Reference Blackburn66]. Two different α2/γ colonies with no preferred orientation are found in Supplementary Fig. S1.
Experimental setup and specimens
The tested cantilevers were fabricated by focused ion beam (FIB) milling with subsequently decreasing currents from 5 nA for coarse cuts down to 20 pA for final polishing and notch cutting. The aforementioned FIB column is operated within a scanning electron microscope (SEM/FIB; Zeiss Auriga Laser platform, Carl Zeiss AG, Oberkochen, Germany). Their final dimensions, position, notch depth, and orientation of the α2/γ lamellae were determined from micrographs recorded by the use of SE and BSE detectors attached to the SEM/FIB workstation. All measurements were conducted manually using ImageJ v1.5.3. The symbol (L) in the designation indicates a perpendicular and the symbol (II) a parallel alignment of the α2/γ lamellae to the notch and, therefore, to the presumed crack propagation direction. This should lead in the case of type (II) and (L) cantilever to an interlamellar and translamellar crack growth, respectively. However, a minor deviation to the requested orientation was determined by SEM and is denoted as angle φ in Table 1. The fracture tests were conducted in situ in an SEM (LEO 1540XB, Carl Zeiss AG, Oberkochen, Germany) using a Hysitron pico-indenter PI-85 (Bruker Corporation, Billerica, USA) equipped with a 60° wedge-shaped conductive diamond tip (Synton-MDP, Nidau, Switzerland) and a CSM module. During testing, a loading rate of 10 μN/s and a maximum displacement of 5 μm was used.
Data evaluation and analysis
The aforementioned experimental setup allows to constantly record the compliance and therefore to continuously evaluate the stiffness of the cantilevers [Reference Alfreider, Kozic, Kolednik and Kiener41]. The measured force–displacement and dynamic stiffness data were acquired at a rate of 300 points/s and the respective corresponding in situ images were captured at a rate of 6 frames/s. The initial stiffness of the unnotched cantilever k 0 is calculated by classical Euler–Bernoulli beam theory according to Eq. (1):
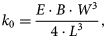 $${k}_ 0 = \displaystyle{{{E}\cdot {B}\cdot W^3} \over {4\cdot {L}^ 3}},$$
where E denotes the Young's modulus of γ-TiAl with 189 GPa for type (L) cantilevers at RT, which was calculated after the Reuss model for layered composites according to the moduli of the α2- and γ-phase with 160 and 200 GPa, respectively [Reference Göken, Kempf and Nix46]. Furthermore, L, B, and W represent the bending length, width, and height of the cantilever. An SE image of a cantilever including its geometrical dimensions is illustrated in Fig. 1(b). The dynamic stiffness kn for the actual data point n was evaluated by the inverse of dynamic compliance and is assessed by the continuous compliance measurement during the experiment. Subsequently, the actual crack length (an) was calculated after an analytical approach following Alfreider et al. [Reference Alfreider, Kolitsch, Wurster and Kiener40].
Following ASTM E399, linear elastic fracture mechanics (LEFM) requires a minimum dimension of the initial crack length (a c) and B concerning the magnitude of the plastic zone, which is defined as  $2.5\cdot {K}_{{\rm IC}}^ 2 /{\rm \sigma }_{ y}^ 2$ [65, Reference Wurster, Motz and Pippan67]. Here, K IC and σy represent the material's fracture toughness and the yield strength, respectively. This would result in a required a c and B values of 10 μm and a resulting minimum L of 129 μm. This specimen size would exceed the mean α2/γ-colony size within the microstructure of the investigated TNM+ alloy and necessitates smaller dimensions of the fabricated cantilevers (Table 1) [Reference Wimler, Lindemann, Clemens and Mayer5, Reference Miyaguchi, Otsu, Takashima and Takeyama6]. Therefore, LEFM is not valid, the conditional stress intensity factor (K q,n) for the actual data point n is calculated using the following equation according to ASTM 399 [65]:
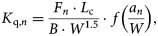 $${K}_{{{\rm q}\comma n}} = \displaystyle{{{F}_{n}\cdot {L}_{\rm c}} \over {{B}\cdot {W}^{1.5}}}\cdot {\,f}\left({\displaystyle{{{a}_{n}} \over {W}}} \right),$$
where Fn denotes the actual load, L c the cantilever's length to the notch, and f(an/W) denotes the geometry factor after Wurster et al. [Reference Wurster, Motz and Pippan67]. Furthermore, taking into account the plastic part, the J-integral based on elastic–plastic fracture mechanics is calculated using the iterative method according to ASTM 1820 [68, Reference Ast, Merle, Durst and Göken69, Reference Ast, Ghidelli, Durst, Göken, Sebastiani and Korsunsky70]. The J-integral for actual data point (Jn) is derived from the sum of elastic  ${J}_{n}^{{\rm el}}$ and plastic ${J}_{n}^{{\rm pl}}$ parts following Eqs. (3)–(5).
 $${J}_{n} = {J}_{n}^{{\rm el}} + {J}_{n}^{{\rm pl}}, $$
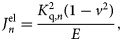 $${J}_{n}^{{\rm el}} = \displaystyle{{{K}_{{{\rm q}\comma n}}^ 2 \lpar { 1-{v}^ 2} \rpar } \over {E}},$$
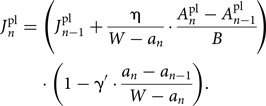 $${J}_{n}^{{\rm pl}} = \left({{J}_{{n}- 1}^{{\rm pl}} + \displaystyle{{{\rm \eta }} \over {{W}-{a}_{n}}}\cdot \displaystyle{{{A}_{n}^{{\rm pl}} -{A}_{{n}- 1}^{{\rm pl}} } \over {B}}} \right)\cdot \left({ 1-{\rm \gamma }^{\prime}\cdot \displaystyle{{{a}_{n}-{a}_{{n}- 1}} \over {{W}-{a}_{n}}}} \right).$$
 According to Schafrik [Reference Schafrik71], the Poisson's ratio ν for a binary TiAl alloy at RT amounts to 0.233. The plastic work at the actual data point n, entitled  ${A}_{n}^{{\rm pl}}$, corresponds to the area below the load–displacement curve subtracted by the elastic work and is calculated by numeric integration [Reference Alfreider, Kozic, Kolednik and Kiener41, Reference Ast, Merle, Durst and Göken69]. Here, occasional negative ${A}_{n}^{{\rm pl}}$ values due to noise in the measured data are set to zero and are, therefore, not regarded as valid data points in the calculation of ${J}_{n}^{{\rm pl}}$. The constants η and γ′ possess values of 1.9 and 0.9, respectively [Reference Alfreider, Kozic, Kolednik and Kiener41].
To compare K q values from LEFM with calculated J-integral values, Eq. (6) is used [Reference Wurster, Motz and Pippan67, Reference Riedle, Gumbsch and Fischmeister72]:
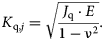 $${K}_{{{\rm q}\comma j}} = \sqrt {\displaystyle{{J_{\rm q}\cdot {E}} \over { 1-{\rm \nu }^ 2}}} .$$
After in situ testing, the microcantilevers were bent to an angle of at least 45° to enable analysis of the fracture surface using SEM.
Besides the CSM-based approach, the crack propagation during the experiments was further analyzed by CV methods on the visible specimen surface during the experiment [Reference Edwards, Di Gioacchino, Goodfellow and Clegg38, Reference Edwards, Di Gioacchino and Clegg42]. Therefore, the image is binarized and the crack flank is extracted without the necessity of surface speckle patterns [Reference Edwards21, Reference Palomares-García, Pérez-Prado and Molina-Aldareguia34, Reference Edwards, Di Gioacchino and Clegg42]. The crack length is measured in the x- and y-direction by assuming a fixed point at the sample top surface where the crack was initialized. To improve the accuracy of this method, drift correction was applied to eliminate influences due to thermal and mechanical shifting. Typically, an error of ± 3 pixels, relating to crack-tip detection and recognition errors, arises. To enhance the quality of crack detection, different filters, e.g., non-local means and Gaussian are used. However, the determined crack length accuracy depends on magnification, signal-to-noise ratio and image resolution, as well as the image acquisition rate.
Acknowledgments
The authors acknowledge funding by the European Research Council under Grant number: 771146 (M.B., K.S., D.K.). Financial support by the Austrian Federal Government (837900) represented by Österreichische Forschungsförderungsgesellschaft mbH and the Styrian and the Tyrolean Provincial Government within the framework of the COMET Funding Programme (IC-MPPE, A1.24), as well as partial financial support by the Austrian Science Fund FWF (project number P25325-N20) is gratefully acknowledged (M.A.).
Data availability
The data sets generated during the current study are available from the corresponding author on a reasonable request.
Supplementary material
To view supplementary material for this article, please visit https://doi.org/10.1557/jmr.2020.306.


 Open access