


I. INTRODUCTION
Thermoelectric materials may play a pivotal role in improving energy sustainability. Thermoelectric devices are not expected to replace current methods of energy generation, but instead, to harness the waste heat that evolves from burning of fossil fuels in automobiles or power plants. Thermoelectric generators are especially attractive in that they are silent and house no moving components. Reference LeBlanc, Yee, Scullin, Dames and Goodson1 Other advantages include reliability (exceeding 100,000 h of steady-state operation) and the scalability of size to meet the required application. Reference Riffat and Ma2
The primary factor that prevents thermoelectrics from wider implementation is the low efficiency-to-cost ratio. Reference LeBlanc, Yee, Scullin, Dames and Goodson1 For example, tellurium, a component in some of the most-utilized thermoelectrics, has a cost that is comparable to Pt. Reference Ayres and Ayres3 SiGe alloys are among the most efficient thermoelectric materials at high temperatures, but only possess an efficiency of around 8%. Reference Bux, Blair, Gogna, Lee, Chen, Dresselhaus, Kaner and Fleurial4 Currently, thermoelectrics are constrained to niche uses, especially where cost concerns are outweighed by other factors, such as in military or space applications. Reference Riffat and Ma2 Thus, there is interest in developing less-expensive alternative thermoelectrics.
Despite the ubiquity of oxides in other electronic applications, only a handful of useful oxide thermoelectrics have been reported. Layered cobaltites still lead by almost a factor of 2 in terms of zT. Reference Walia, Balendhran, Nili, Zhuiykov, Rosengarten, Wang, Bhaskaran, Sriram, Strano and Kalantar-zadeh5 However, oxygen-deficient unfilled strontium barium niobate (or SBN, Sr5−x Ba x Nb10O30), which crystallizes in the tungsten bronze structure, was reported to have an upper bound of zT that was on par with the layered cobaltites. Reference Lee, Bock, Trolier-McKinstry and Randall6 The term “unfilled” refers to a tungsten bronze system in which only 5 out of the 6 A-sites of the structure are occupied. Reference Zhu, Fu, Stennett, Vilarinho, Levin, Randall, Gardner, Morrison and Reaney7
The high figure of merit of SBN was attributed to the remarkable increase in the electrical conductivity when processed under sufficiently-reducing atmospheres. Reference Lee, Wilke, Trolier-McKinstry, Zhang and Randall8 While oxygen vacancies act as a dopant species contributing to the electrical conductivity of SBN, only modest increase were shown for annealing atmospheres of 10−6 through 10−12 atm pO2; the large increase in electrical conductivity was observed only after reaching an annealing condition of 10−14 atm pO2. Reference Bock, Trolier-McKinstry, Mahan and Randall9 Coinciding with this increase in electrical conductivity was the precipitation of a NbO2 phase. Reference Bock, Trolier-McKinstry, Mahan and Randall9 Because the electrical conductivity of NbO2 is low between 300 and 600 K, it should not be directly responsible for the large enhancement in conductivity. Reference Janninck and Whitmore10 The large increase in conductivity was associated with the filling of the A-site vacancy in the structure, and the resulting generation of carriers. Reference Bock, Trolier-McKinstry, Mahan and Randall9,Reference Bock, Chan, Tsur, Trolier-McKinstry and Randall11,Reference Chan, Bock, Guo, Trolier-McKinstry and Randall12 Here, the filling of the A-site acts as the other source of dopants. With respect to unfilled SBN, the effect of the A-site occupancy can be demonstrated with the expression:
 $$5{\left( {{\rm{Sr}},{\rm{Ba}}} \right)_{\rm{A}}}^ \times + {\rm{V}}_{\rm{A}}^ \times + 10{\rm{Nb}}_{{\rm{Nb}}}^ \times + (30 - \delta ){\rm{O}}_{\rm{O}}^ \times \leftrightarrow 5\left( {{\rm{Sr}},{\rm{Ba}}} \right)_{\rm{A}}^ \times + \left( {{\rm{Sr}},{\rm{Ba}}} \right)_{{{\rm{V}}_{\rm{A}}}}^{ \cdot \cdot } + 2{{\rm{e}}^ - } + 10{\rm{Nb}}_{{\rm{Nb}}}^ \times + (30 - \delta ){\rm{O}}_{\rm{O}}^ \times \quad ,$$
where the 6 A-sites are denoted by the subscript, A and the ${\rm{V}}_{\rm{A}}^ \times$
refers to the empty A-site in the unfilled SBN.
Reference Chan, Bock, Guo, Trolier-McKinstry and Randall12
The filling of the A-sites was supported by the observation that NbO2 precipitation was reversible, showing that neither Ba nor Sr were volatilizing out of the system.
Reference Bock, Chan, Tsur, Trolier-McKinstry and Randall11
For unfilled SBNs, the amount of NbO2 precipitated (which is a function of pO2 and temperature) controlled the degree of A-site occupancy.
Reference Bock, Chan, Tsur, Trolier-McKinstry and Randall11
It was found that 100% A-site occupancy could not be reached in unfilled SBN. However, Chan et al. and Kolodiazhnyi et al. have shown that the “filled” chemistry can be produced where all A-sites are occupied and where NbO2 is absent.
Reference Chan, Bock, Guo, Trolier-McKinstry and Randall12,Reference Kolodiazhnyi, Sakurai, Vasylkiv, Borodianska and Mozharivskyj13
This “filled” SBN (Sr
x
Ba6−x
Nb10O30−δ) is referred to as a “filled” bronze.
Reference Zhu, Fu, Stennett, Vilarinho, Levin, Randall, Gardner, Morrison and Reaney7
${\rm{V}}_{\rm{A}}^ \times$
refers to the empty A-site in the unfilled SBN.
Reference Chan, Bock, Guo, Trolier-McKinstry and Randall12
The filling of the A-sites was supported by the observation that NbO2 precipitation was reversible, showing that neither Ba nor Sr were volatilizing out of the system.
Reference Bock, Chan, Tsur, Trolier-McKinstry and Randall11
For unfilled SBNs, the amount of NbO2 precipitated (which is a function of pO2 and temperature) controlled the degree of A-site occupancy.
Reference Bock, Chan, Tsur, Trolier-McKinstry and Randall11
It was found that 100% A-site occupancy could not be reached in unfilled SBN. However, Chan et al. and Kolodiazhnyi et al. have shown that the “filled” chemistry can be produced where all A-sites are occupied and where NbO2 is absent.
Reference Chan, Bock, Guo, Trolier-McKinstry and Randall12,Reference Kolodiazhnyi, Sakurai, Vasylkiv, Borodianska and Mozharivskyj13
This “filled” SBN (Sr
x
Ba6−x
Nb10O30−δ) is referred to as a “filled” bronze.
Reference Zhu, Fu, Stennett, Vilarinho, Levin, Randall, Gardner, Morrison and Reaney7
While there is extensive literature on the electrical properties of SBN, most studies involve the unfilled composition of SBN. There are few studies with respect to the filled counterpart. Currently, only the low-temperature thermoelectric properties of filled SBN have been reported. Reference Kolodiazhnyi, Sakurai, Isobe, Matsushita, Forbes, Mozharivskyj, Munsie, Luke, Gurak and Clarke14 The present work fills this gap, with emphasis on the high-temperature thermoelectric properties of filled SBN. Due to the large increase in the electrical conductivity when A-sites are occupied in SBN, the Seebeck coefficients would be expected to be adversely affected. The results of Kolodiazhnyi et al. and Li et al. show that filled and partially filled SBNs possess low thermal conductivity from temperatures of 10–1000 K. Reference Kolodiazhnyi, Sakurai, Vasylkiv, Borodianska and Mozharivskyj13,Reference Li, Liu, Hou, Zhang, Zhou, Su, Zhu, Li and Wang15 The effect on the power factor is thus a larger concern than the calculation of zT in this work.
II. EXPERIMENTAL PROCEDURE
A. Ceramic processing
The fabrication of dense (>95% of theoretical density for the barium end member (Ba6Nb10O30−δ or BNO) up to 60:40 Sr:Ba; and ∼93% of theoretical density for 80:20 Sr:Ba) SBN ceramics are given in previous work, but are summarized briefly here. Reference Chan, Bock, Guo, Trolier-McKinstry and Randall12 Ceramic green bodies were formed by the isostatic pressing of filled SBN powders. The filled SBN powders were produced from the solid-state reaction of well-mixed high purity powders: 99.9% wt% SrCO3 (Sigma-Aldrich, St. Louis, Missouri), 99.9 wt% Nb2O5 (Alfa Aesar, Haverhill, Massachusetts), and 99.9 wt% BaCO3 (Alfa Aesar) at 1300 °C for 10 h under a reducing atmosphere of 2.5% H2 balanced with Ar. The green bodies were then sintered at 1350 °C for 5 h under the same reducing atmosphere.
The sintered ceramics featured an average grain size between 2 and 3 µm across all compositions with a bimodal grain size distribution. Reference Chan, Bock, Guo, Trolier-McKinstry and Randall12 Though the 80:20 composition possessed lower densities relative to the theoretical value, no obvious differences in porosity were observed. Given the similarity in microstructure between all compositions, the microstructure is not expected to have a significant effect on electrical properties. Sintered pellets were cut into rectangular prisms of appropriate sizes for each of the electrical conductivity, Seebeck coefficient, and Hall Effect measurements. For electrical conductivity and Seebeck samples, the sample sizes were 8.50–9.75 mm, 1.30–1.80 mm, and 1.00–1.30 mm for length, width, and thickness, respectively. Hall samples were 4.00–5.00 mm, 1.00–1.50 mm, and 1.00–1.40 mm, for length, width, and thickness, respectively. Samples were then annealed between 1300 and 1310 °C for 30 h under a pO2 ∼10−16 atm using 2.5% H2 balanced with Ar gas or ∼10−14 atm pO2 with the addition of water vapor.
B. Electrical measurements: electrical conductivity and Seebeck coefficient
Electrical conductivities and Seebeck coefficients were obtained on a commercial Linseis LSR-3 unit (Linseis Inc., Robbinsville, New Jersey). Measurements were made using the differential method, employing a 4-point configuration, in which each of the four electrical leads also act as a thermocouple. In this method, a rectangular sample is loaded between two Pt blocks that supply the current for electrical conductivity measurements. Two inner probes measure the Seebeck voltage, the potential drop, and the temperature, such that the temperature gradient is calculated directly at the point of measurement. The temperature gradient and the global temperature were controlled by an auxiliary heater and infrared lamps located along the chamber, respectively.
Seebeck coefficients were measured from 50 °C to 700 °C (∼323 to ∼973 K) in increments of 50 °C with a heating rate of 3 °C/min under an atmosphere of 1% H2 balanced with He. It is noted that this atmosphere will not further reduce the samples because the filled SBN samples were equilibrated under forming gas conditions at a higher temperature of 1300 °C; use of a He atmosphere would actually oxidize the samples. Seebeck voltages were measured at 11 temperature gradients from 0 °C to 50 °C (relative to the top and bottom Pt leads) in gradient increments of 5 °C. The dwell time for each of these measurements was 1 min. The slope given by the Seebeck voltages and temperature gradients was used to calculate the Seebeck coefficient for each particular global temperature. Power factors were calculated from the conductivity and Seebeck coefficients.
4-Point probe electrical conductivities were also obtained independently using a Keithley digital multimeter (Keithley Instruments, Cleveland, Ohio). The temperature was controlled using a tube furnace. The reducing atmosphere was set with a gas mixture of 2.5% H2 balanced with N2 during each measurement. Samples were electroded with 100 nm of Pt using a Quorum Technologies sputter coater (East Sussex, United Kingdom) and masked with Kapton tape. Epo-Tek Ag epoxy (resin + hardener in 1:1 ratio) was used to attach Ag wires onto the electrodes. The Ag epoxy was cured at 120 °C for 15 min. Samples were electrically connected by physically twisting the Ag wire onto the Pt leads of the measurement apparatus. A heating program of 2 °C/min ramp up from room temperature to 700 °C, hold for 1 h at 700 °C, and then a ramp down at 2 °C/min was used while measurements were taken every 30 s. Results were in good agreement with those measured on the LSR-3.
C. Carrier concentration (Hall measurement)
Carrier concentrations were quantified using a Quantum Design PPMS system (Quantum Design Inc., San Diego, California) via the Hall effect. A Hall-bar geometry with electrodes laid out in a 1-2-2-1 configuration was utilized. Reference Jandl, Usadel and Fischer16 Ga–In electrodes were used as Ohmic contacts. Reference Cava, Peck, Krajewski and Fleming17 A Ga–In alloy of approximately 50:50 vol% composition was painted onto each sample. Ag wires and Ag epoxy were used to attach leads to the electrodes. Sample leads were soldered onto a “Hall Puck” (i.e., the sample stage). The puck was loaded into the temperature-controlled vacuum chamber and sealed at ∼5 mTorr. The temperature was maintained at 300.0 ± 0.1 K and a 5000 µA AC current was used. Samples underwent two measurements starting from a magnetic field of 80,000 Oe to −80,000 Oe and then from −80,000 Oe back to 80,000 Oe at a rate of 100 Oe/s. Hall resistances (R XY ) were measured every 10,000 Oe. The error due to electrode misalignment was corrected by this reversal of the magnetic field, since this contribution was not dependent on the magnetic field.
The magnetic permeability for filled and unfilled SBN have not yet been reported in the literature. However, Sienko et al. and Kupka et al. reported the magnetic susceptibilities for many of the sodium, potassium, and rubidium tungsten bronzes, which are on the order of 10−6. Reference Kupka and Sienko18,Reference Sienko and Macenness Morehouse19 Thus, the relative magnetic permeability of the present samples was taken to be unity (it can be shown that for a relative permeability of unity, the induced magnetic field B, can be equated to the auxiliary magnetic field H if the units of gauss (10−4 tesla) and oersted are used, respectively Reference Callister and Rethwisch20 ).
The carrier concentration, n, was calculated from the slope of the Hall resistance and the applied magnetic field
 $${R_{XY}} = {B_Z} \times {1 \over {ned}}\quad ,$$
where: R XY is the Hall resistance across the width of the sample that is derived from the current flowing in the X-direction (I X ) and the Hall voltage measured in the Y-direction (V Y ) where the directions, X and Y, are parallel to the axis and width of the sample, respectively. B Z is the applied magnetic field in the Z-direction, which is parallel to the thickness direction. The symbol e denotes the elementary charge and d is the thickness.
III. RESULTS AND DISCUSSION
The electrical conductivities of oxygen-deficient filled SBNs are shown in Fig. 1(a). The trend in electrical conductivity, σ, with temperature, T, is similar to that reported in previous works on highly-reduced unfilled SBN compositions.
Reference Lee, Wilke, Trolier-McKinstry, Zhang and Randall8,Reference Bock, Trolier-McKinstry, Mahan and Randall9,Reference Li, Liu, Hou, Zhang, Zhou, Su, Zhu, Li and Wang15,Reference Dandeneau, Bodick, Bordia and Ohuchi21
In the unfilled compositions, a ${{{\rm{d}}\sigma } \over {{\rm{d}}T}} > 0$
is observed generally between 200 and 650 K before reaching a maximum conductivity, which is then followed by
${{{\rm{d}}\sigma } \over {{\rm{d}}T}} > 0$
is observed generally between 200 and 650 K before reaching a maximum conductivity, which is then followed by ${{{\rm{d}}\sigma } \over {{\rm{d}}T}} \,\lt\, 0$
with increasing temperature. While this behavior is observed in Fig. 1(a), two major differences from the unfilled compositions are apparent. The maximum conductivities for filled SBNs (for a Sr:Ba ratio less than 80:20) are greater by a factor of 2–3, and the room temperature conductivities are greater by one order of magnitude compared to similarly-reduced unfilled SBNs reported in literature. For example, in the work of Bock et al., the 60:40 Sr:Ba composition annealed at 1300 °C, and ∼10−16 atm pO2 had room temperature and maximum electrical conductivities of about 30 S/cm and 275 S/cm, respectively. In contrast, the filled 60:40 in Fig. 1(a) shows values of about 250 S/cm and 575 S/cm, respectively. Similarly, Li et al. reported the room temperature and maximum conductivity of the unfilled 40:60 composition annealed at 1300 °C and ∼10−16 atm pO2 to be 33 S/cm and 120 S/cm, respectively. The filled 40:60 composition, as shown in Fig. 1(a), demonstrates room temperature and maximum conductivities of about 300 S/cm and 500 S/cm, respectively.
${{{\rm{d}}\sigma } \over {{\rm{d}}T}} \,\lt\, 0$
with increasing temperature. While this behavior is observed in Fig. 1(a), two major differences from the unfilled compositions are apparent. The maximum conductivities for filled SBNs (for a Sr:Ba ratio less than 80:20) are greater by a factor of 2–3, and the room temperature conductivities are greater by one order of magnitude compared to similarly-reduced unfilled SBNs reported in literature. For example, in the work of Bock et al., the 60:40 Sr:Ba composition annealed at 1300 °C, and ∼10−16 atm pO2 had room temperature and maximum electrical conductivities of about 30 S/cm and 275 S/cm, respectively. In contrast, the filled 60:40 in Fig. 1(a) shows values of about 250 S/cm and 575 S/cm, respectively. Similarly, Li et al. reported the room temperature and maximum conductivity of the unfilled 40:60 composition annealed at 1300 °C and ∼10−16 atm pO2 to be 33 S/cm and 120 S/cm, respectively. The filled 40:60 composition, as shown in Fig. 1(a), demonstrates room temperature and maximum conductivities of about 300 S/cm and 500 S/cm, respectively.

FIG. 1. Electrical conductivity (a) and absolute Seebeck coefficients (b) of filled oxygen-deficient SBNs.
Despite the difference in magnitude of the conductivities between the filled and unfilled SBNs, the shape of the curves in Fig. 1(a) indicates that the conduction mechanism in the filled SBNs is similar to their unfilled counterparts. A band structure describing conduction in oxygen-deficient unfilled SBN was proposed by Bock et al. Reference Bock, Trolier-McKinstry, Mahan and Randall9 As a consequence of high disorder in these materials, Anderson localization modifies the band structure via the presence of mobility edges. The temperature dependence of the Seebeck coefficients, as shown in Fig. 1(b), also supports this hypothesis.
The Heike formula for hopping conductors models a temperature-independent Seebeck coefficient, which does not fit the experimental data for the filled bronzes over the temperature range shown in Fig. 1(b). The electrical conductivities are in the hundreds of S/cm, which is higher than typical hopping conductors. Reference Cutler and Mott22 In addition, the carrier mobility, as calculated from the Hall measurement for filled 60:40 SBNs, is above the 0.1 cm2/V s threshold for typical hopping conductors. Therefore, hopping conduction can be ruled out within the measured temperature range. Reference Bosman and Van Daal23 The Seebeck coefficients shown in Fig. 1(b) are consistent with the measured electrical conductivities, in that higher absolute values of the Seebeck coefficient are observed in compositions with lower conductivities. The parabolic-like behavior seen in the Sr-rich compositions is also observed in the unfilled SBNs and was attributed to relaxor ferroelectricity. Reference Bock, Trolier-McKinstry, Mahan and Randall9 The idea that relaxor ferroelectricity is also causing this parabolic behavior in the filled SBNs has not yet been verified. Hessen et al. and Kolodiazhnyi et al. reported that BNO and the filled SBNs fit into the centrosymmetric P4/mbm space group through X-ray diffraction, though other techniques to test for centrosymmetry have not yet been conducted for these materials.
As the Sr content is decreased, a left-upward shift can be seen for the electrical conductivities in Fig. 1(a). This is observed in the findings of Bock et al., and Dandeneau et al., in the unfilled counterparts, where the temperature of the maximum conductivity shifted to lower temperatures for more-reduced samples (i.e., larger carrier densities) and for lower Sr contents. Reference Bock, Trolier-McKinstry, Mahan and Randall9,Reference Dandeneau, Bodick, Bordia and Ohuchi21 Compositions with higher Sr were reported to have lower conductivities at lower temperatures and/or showed lower maxima in the conductivity, while greater degrees of reduction led to higher values in maximum conductivity. Reference Bock, Trolier-McKinstry, Mahan and Randall9,Reference Li, Liu, Hou, Zhang, Zhou, Su, Zhu, Li and Wang15,Reference Dandeneau, Bodick, Bordia and Ohuchi21 Bock et al. also showed that the activation energies for conduction increase as the Sr content increases, consistent with the observed left-upward shift. Reference Bock, Trolier-McKinstry, Mahan and Randall9 The higher activation energies were attributed to the effect of relaxor ferroelectricity on electron transport. If the oxygen-deficient filled SBNs are noncentrosymmetric (at least locally), then it is possible that one cause for the left-upward shifts in electrical conductivity shown in Fig. 1(a) is due to relaxor behavior.
The maximum electrical conductivity also increases with decreasing Sr content and invites speculation on how the mobility and the carrier concentration are affected by composition. With regard to the former, Lee et al. and Hessen et al. showed that the c-axis is the high conductivity axis. Reference Lee, Wilke, Trolier-McKinstry, Zhang and Randall8,Reference Hessen, Sunshine, Siegrist, Fiory and Waszczak24 The anisotropy is consistent with the Goodenough model, since Nb–O–Nb bond angles critical for orbital overlap along this direction are closest to 180°. Reference D’yachenko, Istomin, Abakumov and Antipov25 Octahedral tilts in SBN would result in a deviation from the ideal 180°. If the bond angles along the c-axis affect the electrical conductivity, it is assumed to be a result of increased carrier mobility, since octahedral tilting should not generate additional carriers.
Both Jamieson and Trubelja et al. conjecture that the degree of octahedral tilting increases with Sr content in SBN, with larger Ba atoms producing a more “up-right structure”. Reference Jamieson26,Reference Trubelja, Ryba and Smith27 The observation of compositions with higher Sr exhibiting lower conductivities is consistent with this notion. Figure 2 shows electron diffraction patterns of the filled barium end member and the filled 60:40 compositions taken on a Philips EM420 microscope operated at 120 kV (FEI Company, Hillsboro, Oregon). The filled 60:40 composition exhibits commensurate superlattice diffraction along the c-axis and an incommensuration along [110], which has been observed in other tungsten bronzes. Reference Levin, Stennett, Miles, Woodward, West and Reaney28,Reference Randall, Guo, Bhalla and Cross29 Superlattice diffraction spots were not observed in BNO, implying the absence of octahedral tilting in the barium end member. This suggests that there may be a correlation between octahedral tilting and carrier mobility.

FIG. 2. Electron diffraction patterns of filled SBN viewed along [110] zone-axis. BNO exhibits no superlattice diffraction spots, while the 60:40 composition shows the presence of superlattice diffraction spots. Both diffraction patterns were taken at a camera length of 320 mm and an accelerating voltage of 120 kV.
At the same time, it is possible that for a given reduction condition, different compositions (i.e., Sr:Ba ratios and filled versus unfilled) could possess a different carrier density. To determine this, Hall measurements were conducted to quantify the carrier concentration as a function of pO2. Each set of raw data showed a negative slope in Hall resistance versus magnetic field, reflecting a negative Hall coefficient. This agrees with the negative Seebeck coefficients in Fig. 1(b) and the notion that oxygen-deficient SBN is an n-type conductor. The results of the carrier density for filled and unfilled 60:40 SBN ceramics are shown in Fig. 3. At 10−16 atm pO2, the carrier concentrations of SBN 60:40 are ${n_{{\rm{Filled}}}} = 2.32 \times {10^{21}} \pm 3.4 \times {10^{20}}{\rm{carriers\ per\ c}}{{\rm{m}}^{\rm{3}}}$
and
${n_{{\rm{Filled}}}} = 2.32 \times {10^{21}} \pm 3.4 \times {10^{20}}{\rm{carriers\ per\ c}}{{\rm{m}}^{\rm{3}}}$
and ${n_{{\rm{Unfilled}}}} = 2.20 \times {10^{21}} \pm 4.2 \times {10^{20}}{\rm{carriers\ per\ c}}{{\rm{m}}^{\rm{3}}}$
. The quantitative energy dispersive spectroscopy results from Bock et al. showed that the conductivity increased as a function of the amount of NbO2 precipitated, and hence the extent of A-site filling.
Reference Bock, Chan, Tsur, Trolier-McKinstry and Randall11
Annealing at 1300 °C and 10−16 atm pO2 does not precipitate the full amount of NbO2, leaving ∼80% of the final A-sites unfilled. If the model of electronic compensation for A-site filling is correct, then there is a difference of ∼6.3 × 10²⁰ carriers per cm3 between an unfilled and filled 60:40 SBN annealed 10−16 atm pO2 conditions. This difference in carriers is within error of the Hall measurement. However, the carrier concentration alone does not explain the stark difference in maximum conductivity (∼600–650 K) between the filled and unfilled SBNs, which differ by a factor of 5 and 2 at room temperature and at the maxima, respectively (Fig. 4).
${n_{{\rm{Unfilled}}}} = 2.20 \times {10^{21}} \pm 4.2 \times {10^{20}}{\rm{carriers\ per\ c}}{{\rm{m}}^{\rm{3}}}$
. The quantitative energy dispersive spectroscopy results from Bock et al. showed that the conductivity increased as a function of the amount of NbO2 precipitated, and hence the extent of A-site filling.
Reference Bock, Chan, Tsur, Trolier-McKinstry and Randall11
Annealing at 1300 °C and 10−16 atm pO2 does not precipitate the full amount of NbO2, leaving ∼80% of the final A-sites unfilled. If the model of electronic compensation for A-site filling is correct, then there is a difference of ∼6.3 × 10²⁰ carriers per cm3 between an unfilled and filled 60:40 SBN annealed 10−16 atm pO2 conditions. This difference in carriers is within error of the Hall measurement. However, the carrier concentration alone does not explain the stark difference in maximum conductivity (∼600–650 K) between the filled and unfilled SBNs, which differ by a factor of 5 and 2 at room temperature and at the maxima, respectively (Fig. 4).

FIG. 3. Carrier concentration versus annealing condition at 1300 °C between filled and unfilled 60:40 SBN ceramics. Note the double log scale. Result for BNO is indicated by a star-shaped symbol.

FIG. 4. Electrical conductivity: comparison between filled and unfilled 60:40 SBN annealed at 1300 °C for 30 h under 10−16 atm pO2 and 10−14 atm pO2.
Though the presence of NbO2 as a secondary phase may indirectly limit the carriers generated from A-site filling, it is speculated that it may also lower the conductivity by lessening the contribution of the high conductivity c-axis. Reduction of unfilled SBN single crystals showed that NbO2 preferentially forms on the surface perpendicular to the c-axis. Reference Bock30 The electrical conductivity of NbO2 was reported to be 40 S/cm at about 650 K. Reference Janninck and Whitmore10 Since SBN has a higher conductivity along the c-axis, the nucleation of more resistive NbO2 at the c-axis surface could potentially affect the conduction across grain boundaries in ceramic samples. The conductivity of NbO2 as reported by Janninck et al. increases drastically at higher temperatures to ∼250 S/cm at 1000 K and ∼500 S/cm at ∼1300 K. Reference Janninck and Whitmore10 The abrupt increase in conductivity in NbO2 may also explain why the conductivity of unfilled SBN at higher temperatures falls off less slowly than the filled SBN as shown in Fig. 4.
Unlike the unfilled compositions, where hopping conduction was observed between 200 and 290 K, the filled compositions have almost half the carriers activated above the mobility edge. Reference Bock, Trolier-McKinstry, Mahan and Randall9 The result is that band conduction dominates even near room temperatures. This is demonstrated by the high conductivities near room temperature (Fig. 4). Given the similar order of magnitude for the carrier densities, the reason for the lower activation energy for filled relative to the unfilled SBNs, is currently unknown. The maximum in electrical conductivity corresponds to the saturation point, in which all carriers from the impurity band have been excited over the mobility edge and into the Nb 4d conduction band. Additional increases in temperature lower the conductivity as a result of a net decrease in charge carrier mobility due to scattering in the absence of carrier excitation.
At 10−14 atm pO2, the carrier concentration differs by almost two orders of magnitude between the filled and unfilled SBN. The lower carrier concentration is consistent with Fig. 4, in which the electrical conductivities of the filled 60:40 were lower by two orders of magnitude at room temperature and an order of magnitude at 600 K relative to the 10−16 atm pO2 counterparts. Furthermore, the filled SBN does not reach a maximum in electrical conductivity in this temperature range. The reason for the marked difference between filled and unfilled SBN at 10−14 atm pO2 is not yet known, but two plausible cases to be considered are that at higher pO2 of 10−14 atm, filled SBN grain boundaries are more easily oxidized without the presence of NbO2, resulting in an increase in the grain boundary resistance. Another possibility is the ionic compensation of A-site filling through superoxidation, as suggested by Bock et al. Reference Bock, Chan, Tsur, Trolier-McKinstry and Randall11
Though it has been surmised that the high conductivity of the BNO ceramic shown in Fig. 1(a) could be due to the difference in carrier mobility, Fig. 3 also indicates that a higher carrier concentration is seen in BNO. The carrier concentration was found to be greater than the filled 60:40 SBN by a factor of 1.45, where ${n_{{\rm{BNO}} - 16}} = 3.37 \times {10^{21}} \pm 1.0 \times {10^{20}}{\rm{carriers\ per\ c}}{{\rm{m}}^3}$
. Thus, an increase in both carrier mobility and carrier density may be responsible for Ba-rich compositions possessing higher conductivities for the given reduction condition.
${n_{{\rm{BNO}} - 16}} = 3.37 \times {10^{21}} \pm 1.0 \times {10^{20}}{\rm{carriers\ per\ c}}{{\rm{m}}^3}$
. Thus, an increase in both carrier mobility and carrier density may be responsible for Ba-rich compositions possessing higher conductivities for the given reduction condition.
The carrier concentration data in Fig. 3 suggests that SBN does not follow an optimal carrier concentration between $1.0 \times {10^{19}}\;{\rm{and}}\;{10^{20}}{\rm{carriers\ per\ c}}{{\rm{m}}^3}$
, as is typical of most thermoelectrics.
Reference Snyder and Toberer31
In much the same way, the sodium cobaltites have displayed carrier densities on the order of ∼1022 carriers per cm3.
Reference Terasaki, Koumoto and Mori32
It is inferred from Figs. 3 and 4 that SBN with 1021 carriers per cm3 would exhibit better thermoelectric performance than with 1019 carriers per cm3.
$1.0 \times {10^{19}}\;{\rm{and}}\;{10^{20}}{\rm{carriers\ per\ c}}{{\rm{m}}^3}$
, as is typical of most thermoelectrics.
Reference Snyder and Toberer31
In much the same way, the sodium cobaltites have displayed carrier densities on the order of ∼1022 carriers per cm3.
Reference Terasaki, Koumoto and Mori32
It is inferred from Figs. 3 and 4 that SBN with 1021 carriers per cm3 would exhibit better thermoelectric performance than with 1019 carriers per cm3.
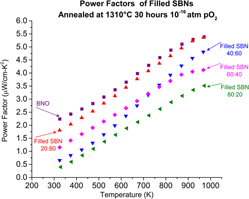
The power factors calculated from Figs. 1(a) and 1(c) are shown in Fig. 5. The power factor as a function of temperature in the filled SBNs follows a similar trend and magnitude to the unfilled SBNs reported by Li et al.: power factors of around 3.0 μW/(cm K2) at 700 K for both the filled and unfilled 60:40 composition. Reference Li, Liu, Hou, Zhang, Zhou, Su, Zhu, Li and Wang15 However, at higher temperatures, the lower Sr compositions of the filled SBNS are higher; at 1000 K, 4.6 μW/(cm K2), compared to 3.45 μW/(cm K2) for filled and unfilled 40:60 composition, respectively. Reference Li, Liu, Hou, Zhang, Zhou, Su, Zhu, Li and Wang15 Despite the large carrier densities, the BNO and 20:80 filled SBNs show higher power factors than any unfilled SBNs or La-doped unfilled SBNs reported in the literature, at temperatures from 300 to 1000 K. Reference Li, Liu, Hou, Zhang, Zhou, Su, Zhu, Li and Wang15,Reference Li, Liu, Zhang, Zhou, Li, Su, Zhai, Wang and Wang33 The current trend shows that power factors continue to increase beyond the measurement range shown here, suggesting that filled SBN may be useful as a high-temperature thermoelectric, provided they are used in low oxygen environments or if they can be effectively protected by a coating.

FIG. 5. Power factors of filled SBNs calculated from Figs. 1(a) and 1(b).
IV. SUMMARY AND CONCLUSIONS
The thermoelectric properties of heavily-reduced filled SBNs were evaluated from ∼350 to 970 K. The conduction mechanism of the filled SBN compositions was found to be band-conduction at higher temperatures. However, filled SBNs, particularly those of Ba-rich compositions, showed higher electrical conductivities than their unfilled counterparts. This is believed to be due to increases in carrier density and carrier mobility. Higher conductivities near room temperature observed in low Sr compositions may be attributed to the onset of relaxor ferroelectricity as the Sr content is increased. The high electrical conductivities shown by the filled SBNs of low Sr composition have produced the highest reported power factors for SBN ceramics. If the thermal conductivities of the partially filled SBNs measured by Li. et al. are used to calculate zT, then the zT for the filled 60:40 composition at ∼970 K is about 0.21. In the context of other well-performing polycrystalline oxide thermoelectrics, the zTs of Na x CoO2, Sr1−x La x TiO3, and Zn0.98Al0.02O are reported to be: 0.80 (950 K), 0.20–0.37 (600–750 K), and 0.65 (1073 K), respectively. Reference Ito, Nagira, Furumoto, Katsuyama and Nagai34–Reference Ohtaki and Hayashi37
ACKNOWLEDGMENTS
This research was funded by the National Science Foundation under grant number DMR-1206518. The author would also like to thank Wei Wei Zhao of the Moses Chan group from The Pennsylvania State University for assistance in the Hall measurements.


