


Top management’s understanding of the firm, its performance, and the relationships with the external environment is important since it affects how the firm is portrayed and how it is managed (Hambrick & Mason, Reference Hambrick and Mason1984). Central to this issue is attribution, which can be defined as a process an observer uses to infer causality between observed outcomes and their perceived causes (origins) (Heider, Reference Heider1944). Causes of observed outcomes can be internal to the actor or the organization, or they can be external, when they lie outside of the actor or the organization. Extant research has examined the tendencies for individuals to exhibit different types of attributional bias. For example, self-serving bias, which attributes positive outcomes to internal causes and negative outcomes to external causes, has been widely observed in the literature, in a variety of different contexts (e.g., Zuckerman, Reference Zuckerman1979; Mezulis, Abramson, Hyde, & Hankin, Reference Mezulis, Abramson, Hyde and Hankin2004; Jam, Donia, Raja, & Ling, Reference Jam, Donia, Raja and Ling2017). Performance attribution is a pervasive phenomenon that takes place in different cultural and national contexts, while the patterns of performance attribution may vary by such contexts (e.g., Hooghiemstra, Reference Hooghiemstra2008; Xu, Reference Xu2011).
Top management performance attribution is an important managerial cognitive process, particularly during challenging times. Top management’s framing of the causes of performance outcomes can set a tone and send signals to organizational stakeholders, including employees and other managers, which can reshape their mind-set, the organizational climate, and the potential course of actions and solutions (if any). Crises at Western Digital in the United States and Panasonic in Japan serve as sobering exemplars. In the case of Western Digital, the CEO, Chuck Haggerty, in his 1998 letter to shareholders, attributed deteriorating operating results to ‘excess capacity, over production and aggressive pricing in the hard drive industry.’ Meanwhile in the case of Panasonic, the president, Kazuhiro Tsuga, and chairman, Fumio Ohtsubo, stated in their 2012 letter to stakeholders: ‘From a results perspective, business conditions for fiscal 2012 were extremely harsh with a variety of factors including the sluggish demand mainly for digital AV products, historical high yen, and the flooding in Thailand. Under such business conditions, the Group’s performance resulted in a sharp deterioration …’ In both cases, management set the tone that the root cause of performance decline was external. While both firms noted they were attempting to restructure or otherwise adjust their businesses to the environment, both of them reported a further decline in performance the following year. These two cases-in-point highlight the prevalence of top management performance attribution and its potential relevance to subsequent organizational outcomes. However, the question of how top management’s attributions relate to subsequent organizational outcomes has not yet been fully examined in the current literature. We therefore set forth in this study to address the research question: ‘do different attribution patterns systematically relate to different subsequent performance outcomes?’
Guided by prior firm performance attribution research, in this study, we perform content analysis of the letters to shareholders in annual reports to examine different patterns of performance attribution and potential subsequent outcomes (Bettman & Weitz, Reference Bettman and Weitz1983; Clapham & Schwenk, Reference Chang1991; Tsang, Reference Tsang2002; Clatworthy & Jones, Reference Clatworthy and Jones2003; Keusch, Bollen, & Hassink, Reference Keusch, Bollen and Hassink2012). Specifically, we examine four patterns of performance attributions: (1) negative performance external attribution (NPEA), (2) positive performance internal attribution (PPIA), (3) negative performance internal attribution (NPIA), and (4) positive performance external attribution (PPEA); and their potential subsequent outcomes in terms of (a) profitability performance (between-firm) and (b) performance improvement trajectory (within-firm). This research design provides us with a more systematic and more complete investigation of this inquiry, which is needed to further the current state of the literature.
In addition, since performance attribution is a pervasive phenomenon across cultural and national contexts (e.g., Hooghiemstra, Reference Hooghiemstra2008; Xu, Reference Xu2011), we use a sample of 100 firms from two diverging national contexts – the United States and Japan. This cross-cultural sample allows us to examine the potential systematic differences arising from national context, while it also gives us much broader generalizability relating to findings which do not vary according to the national context. Given that previous research has largely relied on a single-country sample, particularly from the United States, this study thus broadens the domain of investigation beyond the US context. Altogether, this study’s systematic research design, which examined four specific patterns of attributions concurrently in our two-country sample, advances the current literature both theoretically and methodologically. This research provides a more nuanced understanding of specific attribution patterns and their performance implications, in particular, the significant negative and positive performance effects of NPEA and PPIA, respectively. Thus, these findings offer theoretical relevance to scholars and practical insights to managers.
LITERATURE REVIEW
Attribution
Attribution is a cognitive process in which an individual connects an outcome and its perceived cause (Heider, Reference Heider1944; Kelley, Reference Kelley1973). This relationship becomes infused with meaning by the individual, as the same outcome is often considered quite differently if it is perceived as caused by internal (e.g., a mistake or shortcomings) versus external (e.g., the actions of a malevolent actor or changing circumstances) sources. Individual attributions can also affect the individual’s emotional state, the sense of justice, and the expectations and motivation when faced with similar future challenges (Kovenklioglu & Greenhaus, Reference Kovenklioglu and Greenhaus1978; Weiner, Russell, & Lerman, Reference Weiner, Russell and Lerman1979; Waples, Reference Waples2016). Attribution is particularly important in managing businesses, personnel matters, and various behavioral issues in organizations (e.g., emotion, motivation, unethical behavior), as causes of outcomes, are often ambiguous (e.g., Reed & DeFillippi, Reference Reed and DeFillippi1990; Mosakowski, Reference Mosakowski1997; De Cremer & Vandekerckhove, Reference De Cremer and Vandekerckhove2017). The interpretation of performance outcomes can imply accountability and thus influence the expectations of managers and employees, and future actions taken by the firm.
Extant empirical work has examined tendencies in top management’s attribution patterns. Much of the literature treats tendencies to attribute positive and negative outcomes to internal and external causes, respectively, as attribution biases. However, empirically documenting the existence of bias is difficult, since it requires an objectively accurate attribution for comparison. Therefore, we prefer to use the term ‘attribution patterns’ rather than attribution biases in this study. Generally, studies find that managers tend to attribute disappointing performance to external causes rather than internal ones (e.g., Bowman, Reference Bowman1976; Bettman & Weitz, Reference Bettman and Weitz1983; Staw, McKechnie, & Puffer, Reference Staw, McKechnie and Puffer1983; Tsang, Reference Tsang2002). In a variety of different contexts, individuals have been found to attribute positive outcomes to internal causes as opposed to external ones, consistent with the self-serving bias thesis (e.g., Zuckerman, Reference Zuckerman1979; Salancik & Meindl, Reference Salancik and Meindl1984; Mezulis et al., Reference Mezulis, Abramson, Hyde and Hankin2004).
Attribution and national cultures
Performance attribution is a pervasive phenomenon. Self-serving attribution has been identified across many different national cultures, although it has been found more prevalent in those that are high in individualism than others (Martinko, Harvey, & Douglas, Reference Martinko, Harvey and Douglas2007). Research comparing attribution and evaluation patterns between Japanese and Western counterparts is particularly notable. This research indicates that Japanese tend to exhibit higher degrees of self-criticism (e.g., Heine, Lehman, Markus, & Kitayama, Reference Heine, Lehman, Markus and Kitayama1999; Heine, Takata, & Lehman, Reference Heine, Takata and Lehman2000) or self-depreciation (Muramoto & Yamaguchi, Reference Muramoto and Yamaguchi1997), while Americans tend to exhibit significantly higher degrees of self-esteem (Schmitt & Allik, Reference Schmitt and Allik2005). The explanation for this observation centers on the differences in the national culture. From an early age, Japanese view individuals presenting themselves in self-depreciatory ways more favorably than those presenting themselves in self-enhancing ways (Muramoto, Yamaguchi, & Kim, Reference Muramoto, Yamaguchi and Kim2009).
Muramoto and Yamaguchi (Reference Muramoto and Yamaguchi1997) also observed that Japanese individuals made group-serving attributions, implying very different attribution patterns depending on whether the attribution related to the individual or group level. Hooghiemstra (Reference Hooghiemstra2008) compared the attributions in the annual reports of Japanese and US-based firms and found that the Japanese firms focused more on negative attributions. He, however, did not find a difference between Japanese and Americans’ tendency to take credit for positive outcomes, noting that this finding diverged from prior studies. Similarly, Chang (Reference Charoensukmongkol2014) observed that guanxi between supervisors and subordinates in Taiwan could also lead to attribution biases in the evaluation process. These findings, collectively, suggest that national culture can play an important role in shaping individuals’ attribution patterns.
Attribution and organizational outcomes
Prior research suggests that managerial attribution patterns can influence organizational outcomes. However, empirical research on this topic has been limited, and the available results have been mixed. Studies have found a negative relationship between NPEA and subsequent performance, and have reported mixed findings on the relationship between PPIA and subsequent performance in US samples (Salancik & Meindl, Reference Salancik and Meindl1984; Clapham & Schwenk, Reference Chang1991). Salancik and Meindl (Reference Salancik and Meindl1984) found PPIA was positively related to future profitability for unstable firms, but not for stable ones. Conversely, Clapham and Schwenk (Reference Chang1991) reported a negative relationship between PPIA and future earnings for unstable companies in the analysis from one of two coders. It is possible that small sample sizes of these two studies (18 and 20 firms, respectively) are partially accountable for such mixed findings. These studies also had limited control variables, did not mitigate potential sample selection bias, and did not test the different attribution patterns concurrently. These methodological constraints collectively may account for the inconclusive results.
To examine the attribution and subsequent performance relationship more methodically, research should be based on a larger sample and designed to incorporate adequate control variables and sample selection bias mitigation. In addition, as performance attribution is a pervasive phenomenon and the patterns of attribution can be shaped by national culture, the sample for this line of research should ideally be a multicountry sample. Accordingly, this study adopts a more rigorous research design with a two-country sample: United States and Japan (50 firms each), in tandem with the use of various control variables and the inclusion of sample selection bias/endogeneity test, to examine the relationships between four different performance attribution patterns (i.e., NPEA, NPIA, PPIA, and PPEA) and subsequent firm performance. We develop one hypothesis about the subsequent performance outcomes for each of the attribution patterns below.
HYPOTHESES
After a firm has experienced negative outcomes, such as a decline in sales or profitability performance, its top management can identify the causes of negative performance as being external or internal to the firm. When top management attributes the NPEA, it typically considers the root cause to be beyond the company’s control. This signals that the firm is not to blame (e.g., Keusch, Bollen, & Hassink, Reference Keusch, Bollen and Hassink2012), and therefore, there is no need to change its strategic direction. This NPEA pattern of attribution legitimizes the maintenance of the status quo and the existing course of action (Barker & Barr, Reference Barker and Barr2002). With the perceived causes beyond the company’s control, the organizational responses to the negative performance tend to shift toward increased efficiency and resource conservation rather than innovative change (e.g., Staw, Sandelands, & Dutton, Reference Staw, Sandelands and Dutton1981; Mone, McKinley, & Barker, Reference Mone, McKinley and Barker1998).
Subtle differences in attributional framing can shape the locus of managerial attention in a noticeable way, potentially influencing their subsequent decisions and actions (e.g., Green & Mitchell, Reference Green and Mitchell1979; Martinko, Harvey, & Douglas, Reference Martinko, Harvey and Douglas2007). For example, an attributional statement indicating that profits are down due to increased competition in the industry is quite different from the statement indicating that profits are down due to the firm lacking the needed capability to effectively compete in the industry. The latter attributional framing is arguably more likely to shift managerial attention toward taking actions to improve the internal capability of the firm than the former. In addition, the organizational decline literature suggests that NPEA tends to lead to no substantive corrective actions being taken, while the decline in performance potentially exacerbates the internal dysfunctions within the firm (e.g., Weitzel & Jonsson, Reference Weitzel and Jonsson1989; Mone, McKinley, & Barker, Reference Mone, McKinley and Barker1998). As such, we expect future performance will continue to decrease with NPEA. Consistent with this line of argument, Salancik and Meindl (Reference Salancik and Meindl1984) found the tendency to attribute negative outcomes to external causes was associated with lower future growth and profitability. On the other hand, when the top management of the firm attributes the negative performance to internal causes, it takes the ownership of blame (Salancik & Meindl, Reference Salancik and Meindl1984), and assumes the responsibility for correcting the negative performance. On the individual level, internal attribution of failure leads to guilt and regret (Weiner, Russell, & Lerman, Reference Weiner, Russell and Lerman1979). Given this, the leader may feel increased responsibility, urgency, and sense of commitment to taking corrective actions aimed at ameliorating the situation. This management commitment increases the likelihood that subsequent performance improvement is realized. Based on the line of arguments above, we propose Hypotheses 1 and 2 as follows:
Hypothesis 1: NPEA is negatively related to subsequent firm performance.
Hypothesis 2: NPIA is positively related to subsequent firm performance.
Similarly, when the firm has experienced positive outcomes, such as sales growth or increased profitability, the top management can attribute such positive performance to internal or external causes. In the case of positive performance attributed to internal causes, the firm communicates and reinforces the effectiveness of its current strategy and courses of action (Hambrick, Geletkanycz, & Fredrickson, Reference Hambrick, Geletkanycz and Fredrickson1993). Such positive reinforcement can be an important tool for the top management to communicate the achievements the company has made to its employees and other stakeholders. This also signals that the company is in control of its own destiny. The sense of achievement and control, taken together, can increase morale, motivation, and expectations, thus sustaining the positive momentum of the company. In addition, the literature also suggests that, on the individual level, PPIA is positively related an individual’s feelings of confidence and competence (Weiner, Russell, & Lerman, Reference Weiner, Russell and Lerman1979), healthy physical/mental conditions, as well as work performance (Mezulis et al., Reference Mezulis, Abramson, Hyde and Hankin2004) and the restraint of negative emotions (Charoensukmongkol, Reference Clapham and Schwenk2013). As such, PPIA accentuates the positives within the firm, enhances the heath of the organizational climate, and strengthens the functioning capacity of managers and employees, thus contributing to higher subsequent firm performance (Rogg, Schmidt, Shull, & Schmitt, Reference Rogg, Schmidt, Shull and Schmitt2001; Luthans & Youssef, Reference Luthans and Youssef2007).
As opposed to the case with PPIA, when top management attributes positive performance to external causes, it is essentially sending a signal that the firm was fortunate to be in the right place at the right time. While managers and employees may feel thankful to be in such fortunate situations (Weiner, Russell, & Lerman, Reference Weiner, Russell and Lerman1979), this may, if anything, dampen expectations that positive performance is repeatable (Kovenklioglu & Greenhaus, Reference Kovenklioglu and Greenhaus1978). Accordingly, when management attributes positive performance to external causes, it misses the opportunity to accentuate the positives and build employees’ morale and motivation needed to sustain the firm’s momentum going forward. On balance, PPEA does not appear to have either clear negative consequences to firm performance or clear contributions to performance improvement. Therefore, the above arguments collectively suggest Hypotheses 3 and 4 as follows:
Hypothesis 3: PPIA is positively related to subsequent firm performance.
Hypothesis 4: PPEA is not related to subsequent firm performance.
METHODOLOGY
Suitability of research method
This research performs a content analysis of the letters of shareholders, contained in annual reports. Letters to shareholders are particularly important for many stakeholders (Clatworthy & Jones, Reference Clatworthy and Jones2003) as they provide top management’s account of external events, their perspective on internal operations, and their interpretation of financial results (e.g., Bayle-Cordier, Mirvis, & Moingeon, Reference Bayle-Cordier, Mirvis and Moingeon2015). Content analysis of letters to shareholders is a methodological approach often used in existing empirical studies on attribution and firm performance (e.g., Bettman & Weitz, Reference Bettman and Weitz1983; Staw, McKechnie, & Puffer, Reference Staw, McKechnie and Puffer1983; Tsang, Reference Tsang2002; Billett & Qian, Reference Billett and Qian2008), as well as other psychological constructs, such as attention patterns (e.g., Cho & Hambrick, Reference Cho and Hambrick2006), and values and commitment (e.g., McClelland, Liang, & Barker, Reference McClelland, Liang and Barker2010). It is a well-established methodological technique that enables researchers to systematically examine phenomena of interest in an unobtrusive manner through analyzing existing written communication materials (e.g., Krippendorff, Reference Krippendorff2004; Duriau, Reger, & Pfarrer, Reference Duriau, Reger and Pfarrer2007; Tangpong, Reference Tangpong2011). It is a useful approach in studying managerial attributions and management communication patterns, particularly in situations such as crisis, when management is difficult to directly access. Our methodological approach also mitigates the concerns of common method bias (Conway & Lance, Reference Conway and Lance2010), as our independent variables are measured through content analysis while our dependent variables (DVs) are measured using the firm’s publicly reported financial performance data.
Sample selection
Prior studies have often relied on US-based samples (e.g., Bettman & Weitz, Reference Bettman and Weitz1983; Ingram & Frazier, Reference Ingram and Frazier1983; Staw, McKechnie, & Puffer, Reference Staw, McKechnie and Puffer1983; Salancik & Meindl, Reference Salancik and Meindl1984; D’Aveni & MacMillan, Reference Daniel, Lohrke, Fornaciari and Turner1990; Clatworthy & Jones, Reference Clatworthy and Jones2003; Billett & Qian, Reference Billett and Qian2008). To retain comparability with past studies, we included US firms in our sample. As performance attribution is a pervasive phenomenon, we wanted to increase the generalizability of the study by including companies from a different national context. We decided to study Japan-based firms for two primary reasons. First, institutional and cultural differences between Japanese and Americans have been well documented (e.g., Dore, Reference Dore1973; Yoshimura & Anderson, Reference Yoshimura and Anderson1997; Lehmberg, Reference Lehmberg2017), thus enhancing broader generalizability of the findings. Second, Japan is endowed with a developed economy and regulatory system, which requires publicly traded firms to provide publicly available documentation generally comparable to that required by US-based firms. This facilitates data gathering on sample companies needed for this research. As such, the combined of the United States – Japanese sample firms offer an economical sample with high potential generalizability of the eventual findings.
Since crisis is a context under which a broad set of positive and negative performance attributions are often made, previous attribution studies used firms faced with performance decline or crisis as their sample (e.g., Bettman & Weitz, Reference Bettman and Weitz1983; Staw, McKechnie, & Puffer, Reference Staw, McKechnie and Puffer1983; D’Aveni & MacMillan, Reference Daniel, Lohrke, Fornaciari and Turner1990; Keusch, Bollen, & Hassink, Reference Keusch, Bollen and Hassink2012). Following the same line of reasoning, our study selected sample firms in the midst of economic crisis, following Lehman Brothers’ bankruptcy announcement in September 2008, which negatively affected both US and Japanese firms. This announcement sent a strong worldwide signal of impending degradation of the global economic conditions, as consumer sentiment plummeted in both countries. This economic crisis should provide a broad variety of attributions, making it a suitable context for this study.
While random sampling has many benefits, it was not suitable in our situation for two reasons. First, not all Japanese firms provide English language financial reports with letters to shareholders. Second, at the population level, the make-up of industries of publicly listed firms in the United States and Japan differ greatly. While we can statistically control for industry, the use of US and Japanese sample firms from the comparable set of industries helps further reduce systematic industry related bias in the sample. We therefore decided to use the combination of judgmental and stratified sampling methods (Babbie, Reference Babbie1995) in selecting our sample firms. This combinatory sampling method allowed us to (1) increase the sample representation, (2) mitigate potential sampling bias, and (3) economize research efforts. First, we selected US and Japan-based publicly traded firms in major industry sectors as part of the sampling frame. Second, we screened out the Japanese firms that did not have publicly available documents in English and narrowed down the industry sectors to those who had representative firms from both countries.
The above screening and selection procedure yielded the final sample of 100 firms: 50 US firms and 50 Japanese counterparts from a broad set of industries ranging from Transportation to Heavy Machinery. We also performed a power analysis, which indicated that for the regression models of 12–17 predictors, a 0.25 anticipated effect size, a 0.80 desired statistical power level, and a 0.05 probability level, the sample size with adequate statistical power was 81–94. Therefore, the sample size in this study provides adequate power for statistical testing, which is particularly important given that Hypothesis 4 is a null hypothesis (e.g., Landis, James, Lance, Pierce, & Rogelberg, Reference Landis, James, Lance, Pierce and Rogelberg2014). In addition, we identified two outliers based on the standardized residual approach and then excluded them from further data analyses.
Content analysis procedures
Consistent with the extant literature (e.g., Bettman & Weitz, Reference Bettman and Weitz1983; Clapham & Schwenk, Reference Chang1991; Tsang, Reference Tsang2002; Clatworthy & Jones, Reference Clatworthy and Jones2003; Keusch, Bollen, & Hassink, Reference Keusch, Bollen and Hassink2012), we used letters to shareholders as the primary textual documents for our content analysis study of attribution patterns. To ensure that the content of the English language versions of Japanese firms’ letters to shareholders was equivalent to their Japanese originals, we randomly selected seven of the 50 Japanese firms in our sample, and translated the original Japanese version of their letter to shareholders into English. We then compared the translated content with that of their English language version. This cross-translation check did not identify any major differences in content between the two versions, thus giving us a reasonable ground for using the letters to shareholders publicly available in English of those Japanese firms in our study.
Prior to commencing content analysis efforts, we obtained the letters to shareholders published right after the Lehman Brothers bankruptcy announcement in September 2008 of the sample firms. We next redacted identifying information, including the names of companies, individuals, products, and places, and all graphics in order to reduce potential biases due to company reputations that coders may introduce to the coding process. We then unitized the letter to shareholders into sentences as our recording units. Sentences are preferable to other units in this study since they provide adequate context for accurate interpretation of their meanings, but remain sufficiently small units to facilitate the coding reliability (Krippendorff, Reference Krippendorff2004). Because our level of analysis was the firm, we finally aggregated the sentence-level coding results for each letter to obtain the company-level data.
To enhance coding reliability, we developed a detailed coding protocol to guide the coders in identifying and coding statements related to attribution. We used an iterative process to develop and test the protocol before finalizing it for the full-scale coding efforts (see the Appendix for the coding guidelines). We trained two coders to perform the content analysis tasks. Both coders attained 90.3% intercoder agreement, suggesting a reasonable degree of coding reliability (Lombard, Snyder-Duch, & Bracken, Reference Lombard, Snyder‐Duch and Bracken2002). The coding disputes were then resolved through the discussions between the coders. The coding results after resolving the disputes were then used in operationalizing the patterns of attribution for hypothesis testing purposes in this study.
Variables and measurements
The DVs in this study were (1) subsequent profitability performance, which was measured by Return on Assets (ROA) and Return on Sales (ROS) a year after the crisis, and (2) subsequent performance improvement trajectory, which was measured by the changes in ROA and ROS over the 2-year period after the crisis. The first performance measure allows us to compare profitability across different companies in the sample. The use of our second performance measure helps offset the concern that idiosyncratic differences between firms (e.g., different reporting calendars, various firm-specific features, etc.) might potentially introduce systematic biases since it allows us to compare each firm’s performance improvement over a 2-year period. Both ROA and ROS measures are commonly used measures of firm performance in the management literature (e.g., Daniel, Lohrke, Fornaciari, & Turner, Reference D’Aveni and MacMillan2004; King, Dalton, Daily, & Covin, Reference King, Dalton, Daily and Covin2004). Since ROA and ROS are highly correlated, we used principal component analysis (PCA) to create composite measures for subsequent profitability performance and performance improvement trajectory. The PCA results indicated that ROA and ROS significantly loaded onto one factor with the loading of 0.95 and the extracted variance of 89.85%, while the changes in ROA and ROS (for the trajectory variable) also significantly loaded onto one factor with the loading of 0.97 and the extracted variance of 93.30%. We thus used the resultant PCA factor scores as single-composite measures for both DVs.
The independent variables in this study included the four patterns of attribution: (1) NPEA, (2) NPIA, (3) PPIA, and (4) PPEA. We operationalized these constructs through the content analysis efforts and developed an intensity-based measure for each of them (e.g., Neuendorf, Reference Neuendorf2002). Specifically, for each sample firm, we counted the frequency of each attribution pattern that occurred in the letter to shareholders published directly after September 2008 at the sentence level (i.e., how many sentences that the firm made a specific attribution pattern), and then divided such frequency count by the total number of sentences in the letter. This intensity-based measure represents the proportion of content regarding each performance attribution pattern in the letter, thus suggesting the degree to which such performance attribution pattern is emphasized in the firm’s communication to shareholders, publics, and broader stakeholders. The intensity-based measures for NPEA, NPIA, PPIA, and PPEA were then log-transformed for skewness correction. We also included four additional attribution-related variables tracking the changes in each attribution pattern in our independent variables and those observed in letters to shareholders in the subsequent year’s letter to shareholders (i.e., the differences in the intensity-based measures for each attribution pattern between the crisis year and a year after). These variables were developed using the coding process described above for an additional year of annual reports.
In addition, we included two sets of control variables in this study. The first set of control variables pertained to the firm’s precrisis conditions (1 year prior to crisis), including (1) profitability performance (ROA and ROS measured by a PCA factor score with 0.94 loading and 88.88% extracted variance), (2) precrisis performance trajectory (changes in ROA and ROS during the 2-year period prior to the crisis, measured by a PCA factor score with 0.93 loading and 87.28% extracted variance), (3) firm size (measured by total sale, log-transformed for skewness correction), (4) liquidity (measured by current ratio), (5) R&D intensity (measured by the ratio of R&D expenditures to total sales), (6) the level of leverage (measure by debt-to-asset ratio, log-transformed for skewness correction), and (7) whether there was a CEO change (coded as 1 for a CEO change observed in the fiscal year following the analyzed letter to shareholders, and a 0 for no change observed). This set of control variables help us mitigate the potential spurious effects that may stem from differences in sample firms’ internal baseline conditions that they operated with at the time. The second set of control variables pertained to the firms’ external conditions, including (1) industry sector (coded as 1 for manufacturing, 0 for nonmanufacturing) and (2) national context (coded as 1 for the United States and 0 for Japan). As these external variables can potentially shape firm performance, they should be controlled to further mitigate the potential spurious effects. The use of control variables to control for varying internal and external conditions of sample firms has been commonly used in extant research related to firm performance (e.g., Lahiri & Narayanan, Reference Lahiri and Narayanan2013; Tangpong, Abebe, & Li, Reference Tangpong, Abebe and Li2015).
DATA ANALYSES AND RESULTS
Descriptive statistics and correlation analyses
The results of our correlation analyses, reported in Table 1, indicated the existence of some significant correlations among some of our independent variables and control variables. For example, NPEA was positively correlated with NPIA (p<.01) and industry sector (p<.01), while negatively correlated with PPIA (p<.05) and the national context dummy (p<.01). The precrisis firm size was positively correlated with the national context dummy (p<.001), while negatively correlated with NPEA (p<.10), NPIA (p<.05), and precrisis liquidity (p<.05). Despite these correlations, variance inflation factors did not suggest the existence of multicollinearity problems among them, thus not violating a regression analysis assumption.
Table 1 Correlation matrix

Note. NPEA=negative performance external attribution; NPIA=negative performance internal attribution; PPEA=positive performance external attribution; PPIA=positive performance internal attribution
*p<.05, **p<.01, ***p<.001, †p<.10
Sample selection bias and endogeneity check
To mitigate the concerns for sample selection bias and endogeneity, we used a two-step Heckman correction approach (e.g., Shaver, Reference Shaver1998; Hamilton & Nickerson, Reference Hamilton and Nickerson2003; Bascle, Reference Bascle2008). In the first step, we ran probit regression analyses using CEO tenure (the number of years in the CEO position), CEO duality (coded 1 for duality, 0 otherwise), outsider-versus-insider CEO (coded 1 if the CEO was hired from outside the firm, 0 otherwise), and national context dummy (coded 1 and 0 for the United States and Japan, respectively) as instrumental variables to predict each of the performance attribution patterns (i.e., NPEA, NPIA, PPIA, and PPEA; 1–0 dummy coded). The literature has suggested that these CEO-related variables often shape the CEO’s power and status in the organization (e.g., Hill & Phan, Reference Hill and Phan1991; Finkelstein & D’ Aveni, Reference Finkelstein and D’aveni1994; O’Shannassy, Reference O’Shannassy2010), thus potentially influencing how the performance attributions were made by the top management. Similarly, the previous research has suggested that national culture or context can exert influence over individuals’ attribution tendency (e.g., Bailey, Chen, & Dou, Reference Bailey, Chen and Dou1997; Hooghiemstra, Reference Hooghiemstra2008). Therefore, these variables were included in this analysis. Our analysis results indicated that national context was largely significant in predicting performance attribution patterns, whereas CEO-related variables were not. Specifically, Japanese national context was more associated with NPEA (p<.10) and NPIA (p<.05) than US national context, whereas it was in reverse for PPIA (p<.05), and the national context was not a significant predictor for PPEA. These findings reflect greater focus on negative performance in agreement with Hooghiemstra (Reference Hooghiemstra2008), and particularly the self-criticism amongst Japanese firms (e.g., Bailey, Chen, & Dou, Reference Bailey, Chen and Dou1997; Heine, Takata, & Lehman, Reference Heine, Takata and Lehman2000), whereas American firms exhibit attribution patterns consistent with higher self-esteem (Schmitt & Allik, Reference Schmitt and Allik2005). In the second step of the Heckman correction procedure, we used the predicted values of NPEA, NPIA, PPIA, and PPEA from their probit models to calculate the inverse Mills ratios, which in turn were used as additional control variables in the subsequent regression analyses for hypothesis testing purposes. The results in Tables 2 and 3 indicated that inverse Mills ratios were not significant in all models, suggesting that the selection bias and endogeneity were not significant concerns in this study.
Table 2 Results of regression analyses for hypothesis testing on subsequent profitability performance
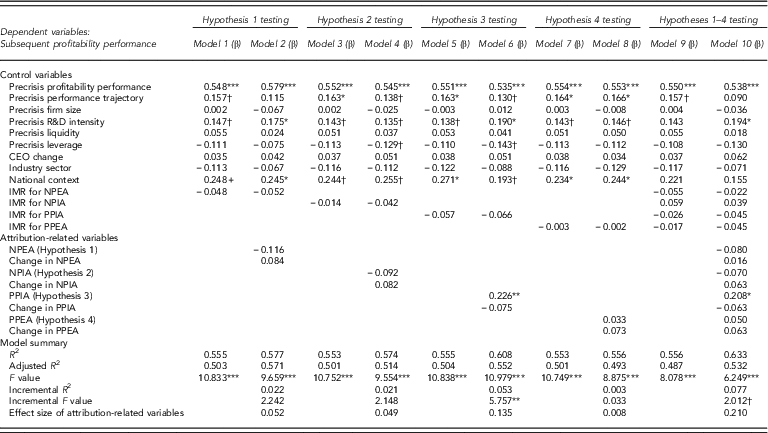
Note. IMR=inverse Mills ratio; NPEA=negative performance external attribution; NPIA=negative performance internal attribution; PPEA=positive performance external attribution; PPIA=positive performance internal attribution
*p<.05, **p<.01, ***p<.001, †p<.10
Table 3 Results of regression analyses for hypothesis testing on performance improvement trajectory
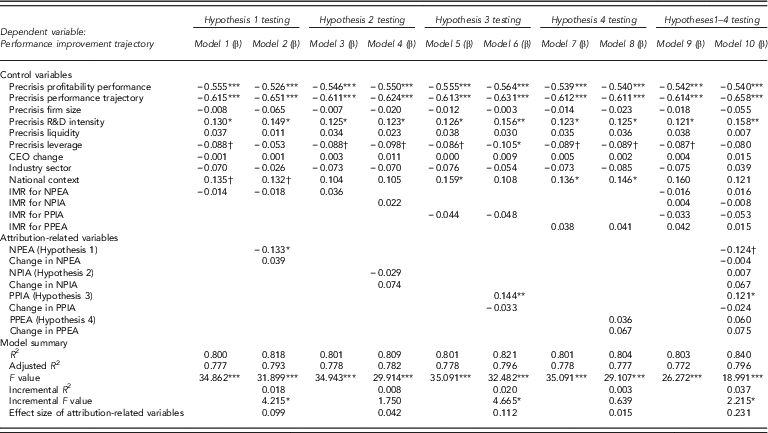
Note. IMR=inverse Mills ratio; NPEA=negative performance external attribution; NPIA=negative performance internal attribution; PPEA=positive performance external attribution; PPIA=positive performance internal attribution
*p<.05, **p<.01, ***p<.001, †p<.10
Hypothesis testing
Tables 2 and 3 report the results of our regression analyses with the subsequent profitability performance and performance improvement trajectory as the DV, respectively. The Model 2 results in both tables, taken together, provide mixed support for Hypothesis 1 regarding the negative effect of NPEA on subsequent firm performance. Specifically, the results indicated that NPEA was not significantly related to subsequent profitability performance but significantly and negatively related to subsequent performance improvement trajectory (β=−0.133, p<.05). This finding suggests that NPEA plays a greater role in explaining subsequent within-firm performance than across-firm performance. In explaining subsequent within-firm performance, the incremental R 2 of Model 2 (with NPEA-related variables) over its reduced model (Model 1) in Table 3 was significant (p<.05). Adding the NPEA-related variables into the model improved the total explained variance in the DV by 1.8% representing the effect size of 0.10, which is considered a small effect size with 0.02 and 0.15 being considered small and medium effect sizes, respectively, by convention (Cohen, Reference Cohen1988). Overall, these results provided partial empirical support for Hypothesis 1.
The Model 4 results in Tables 2 and 3 do not support Hypothesis 2 regarding the positive effect of NPIA on subsequent firm performance. Neither NPIA nor Change in NPIA was significant in Model 4 while the overall model was significant (p<.001) in both tables. The Model 6 results in Tables 2 and 3 yield strong and consistent supports for Hypothesis 3 regarding the positive effect of PPIA on subsequent firm performance. The results in indicated that after taking other variables into the consideration, PPIA was significantly and positively related to subsequent profitability performance as well as performance improvement trajectory (β=0.226 in Table 2 and β=0.144 in Table 3, both p<.01), and the overall model was significant at p<.001 in both cases. The incremental R 2 of Model 6 (with PPIA-related variables) over its reduced model (Model 5) in Table 2 was significant (p<.01), with PPIA-related variables improving the total explained variance in firm profitability performance by 5.3% indicating a small-to-medium effect size of 0.14. In Table 3, the incremental R 2 of Model 6 over its reduced model (Model 5) was significant (p<.05), with PPIA-related variables improving on the total explained variance in firm performance improvement trajectory by 2% representing a small-to-medium effect size of 0.11. Overall, these results are largely consistent with Hypothesis 3.
The Model 8 results in Tables 2 and 3 indicated the null effects of PPEA on subsequent firm performance as postulated in Hypothesis 4. Neither PPEA nor change in PPEA was significant in Model 8 while the overall model was significant (p<.001) in both tables. In addition, the incremental R 2 of Model 8 (with PPEA-related variables) over its reduced model (Model 7) was not significant, and the effect size of PPEA was negligible in both tables. These results overall are consistent with Hypothesis 4.
In testing Hypotheses 1–4 concurrently, the Model 10 results in Tables 2 and 3 yield partial support for Hypothesis 1 (i.e., performance effects of NPEA) while lending consistent support for Hypothesis 3 (i.e., performance effects of PPIA). Specifically, the overall model was significant at p<.001 in both tables, and NPIA was not significantly related to subsequent profitability performance or subsequent performance improvement trajectory. On the other hand, PPIA was positively related to both subsequent profitability performance (β=0.208, p<.05) and performance improvement trajectory (β=0.121, p<.05). These results are largely consistent with those in Models 2 and 6 discussed previously. The incremental R 2 of Model 10 (with all attribution-related variables) over its reduced model (Model 9) in Table 2 was significant (p<.1), with the collective inclusion of attribution-related variables improving the total explained variance in subsequent profitability performance by 7.7% representing a medium effect size of 0.21. In Table 3, the incremental R 2 of Model 10 over its reduced model (Model 9) was also significant (p<.05), with attribution-related variables improving the total explained variance in subsequent performance improvement trajectory by 3.7% suggesting a medium effect size of 0.23. These results suggest that the collective impact of attribution-related variables on subsequent profitability performance and performance improvement trajectory was of a reasonable magnitude and therefore should not be neglected. The overall results thus supported the core thesis of this study.
We performed an additional robustness check to examine the possibility that national context moderated the relationship between attribution pattern and subsequent performance by running additional regression analyses (results available from authors upon request). The literature related to national culture and attribution suggested that the culture may affect the tendencies to make different attributions, as discussed above. Our results, described in the Heckman correction procedure, are in agreement with that notion. While the literature suggests intertwining relationships between culture and leadership (e.g., Schein, Reference Schein2010), it did not provide sufficient guidance to hypothesize if or how culture, or the broader national context to which culture belongs, might specifically affect relationships between attribution pattern and subsequent firm performance. We performed a series of regression analyses to examine the possible moderating effects of national context on the relationship between attribution-related variables and subsequent performance. Our results ruled out this possibility, thus suggesting that the NPEA–performance and PPIA–performance relationships found in this study do not significantly vary between US and Japanese contexts. In other words, these relationships are generalizable across these two countries’ contexts.
DISCUSSION AND CONCLUSION
This study finds that the collective effects of top management’s attributions on subsequent performance are significant and substantive, thus warranting attention from scholars and practitioners. Across the two national contexts, our findings on the nuanced relationships of different attribution patterns and performance also enrich the current literature and deepen our understanding of management attribution and performance implications. Largely consistent with prior research, we find that managers tend to attribute positive outcomes to internal causes and negative outcomes to external causes. Attributions of negative performance to internal causes were more common among Japanese firms than in their US counterparts. Partially supporting Hypothesis 1, our results reveal that NPEA is negatively related to subsequent performance improvement trajectory (within-firm performance measure), which is consistent with Salancik and Meindl’s (Reference Salancik and Meindl1984) observations. However, NPEA is not significantly related to subsequent profitability performance (between-firm performance measure). It is possible that the performance-influencing roles of NPEA are more confined to the within-firm performance measure, which reflects the internal improvement of the firm over time, rather than the between-firm measure, which reflects superior performance to those of other firms.
Contrary to our expectations, our results do not support Hypothesis 2, which states that NPIA is positively related to subsequent performance. After taking several control variables into account, our results reveal that NPIA is not significantly related to either measure of subsequent firm performance. One possible explanation is that when the top management of the firm attributes the negative performance to internal causes, it takes the ownership of blame, which may be a necessary step to improve the situation. However, this is not a sufficient step on its own. Having identified performance problems and their source, top management typically searches for solutions to improve the situation (Cyert & March, Reference Cyert and March1963), and then implement them. It is possible that managers may not identify the correct cause of the problems observed (Lippman & Rumelt, Reference Lippman and Rumelt1982; Mosakowski, Reference Mosakowski1997) or may not implement the correct measures to counter the cause due largely to their cognitive limits and bounded rationality (Simon, Reference Simon1957). In addition, from the attention-based perspective (Ocasio, Reference Ocasio1997), it is also possible that NPIA, although making the top management appear honest, can shift their attention away from leveraging the organization’s strengths and exploiting opportunities to focusing on weaknesses and problems. This shift in managerial attention can potentially suboptimize the performance outcomes of the firms, as well documented in the practice-oriented business and management literature (e.g., Porter, Reference Porter1985; Drucker, Reference Drucker2008). These findings are particularly important given the tendency for Japanese managers toward NPIA.
In addition, consistent with Hypothesis 3, our results indicate that PPIA is positively related to subsequent performance (for both within-firm and between-firm measures), even after taking into account several control variables including prior performance. The results supporting the performance-influencing effects of PPIA are quite robust and remain significant even in tests for the potential moderating effect of national context. With this possible alternative explanation being ruled out, our findings suggest that there is a portion of performance variance that is uniquely captured by PPIA, which is a psychological and cognitive phenomenon. Attributing positive performance to internal causes can thus be a potentially important instrument that the top management can use to accentuate the positives, strengthen motivation, enhance organizational health, and maintain positive climate (Mezulis et al., Reference Mezulis, Abramson, Hyde and Hankin2004), thus reinforcing the firm’s current momentum and sustaining its positive outcomes. Given that past research has reported mixed results on the PPIA–performance relationship, we feel that our finding contributes strongly to our understanding of this relationship. With the research design incorporating a relatively large sample of firms in two national contexts, sample selection bias mitigation, within- and between-firm performance measures, and various control variables, the findings on the PPIA–performance relationship in this study are relatively robust, compared to those of previous research.
Finally, consistent with Hypothesis 4, our results find no relationship between PPEA and subsequent performance, using either measure. When the firm experienced positive performance, particularly in a challenging environment, and the top management attributed such performance to external factors, the top management did not take advantage of the opportunity to galvanize and energize the firm from these positive outcomes. Even if this attribution may have been motivated by honesty, nonetheless this is a missed opportunity. Instead, taking credit for positive performance could have allowed it to be seen as a small win that could lead to the next, thus potentially increasing employees’ morale and motivation and enhancing organizational climate. However, attributing it to external causes would limit those potential benefits. In other words, PPEA represents a missed opportunity that the top management could have capitalized on toward building and sustaining positive momentum for future improvement.
Overall, this study contributes to the attribution and performance literature by (a) further substantiating the importance of managerial attributions on subsequent performance, (b) unveiling finer-grained relationships between four specific patterns of attribution and subsequent performance, and (c) testing the robustness of attribution–performance relationships across national borders. Our findings further substantiate the NPEA–performance relationship observed in prior studies and expanded the horizon of this literature stream with the robust finding of the PPIA–performance relationship.
Managerial implications
As a whole, our study suggests that managers should be careful and deliberate about how they attribute performance outcomes, as these attributions can be a galvanizing or a deterring force of a subsequent performance. We find that positive internal attribution can lead to subsequent performance improvement. Accordingly, when managers have reason to believe that positive outcomes are due to internal causes, they should intentionally emphasize the positive in their communications to broader stakeholders. This positive internal attribution is potentially instrumental to the managers’ capacity to depict that their firm is in control of the situation. Such statements help the managers to reaffirm their stakeholders’ confidence in the firm and project a hygienic image of the firm’s stability and security supportive of employees’ basic needs and motivation, thus collectively sustaining the momentum toward greater performance outcomes in the future. On the other hand, when the managers are not sure whether the positive outcomes are due to internal or external causes, given their cognitive limits, it may be more prudent for them not to make performance attribution statements at all since attributing such positive performance to external factors could derail their firm’s momentum toward future improvement.
Likewise, how should managers discuss the negative outcomes and their potential causes? Consistent with prior studies, we observed a greater frequency of attributions of negative outcomes to external than to internal causes among our sample firms. While managers have reasons to blame external factors instead of blaming themselves, our findings suggest that doing so could put the firm’s future performance at greater risk. On the other hand, while NPIA may be an important step toward management taking responsibility and showing it is accountable, NPIA can also potentially shift the managerial attention (Ocasio, Reference Ocasio1997) to the negative. Taken together, these observations suggest that focusing on the negatives may not be a desirable course of action, particularly during a crisis. Instead, it may be more advisable for top management not to publicly make performance attributions regarding the negative outcomes in these situations. A better course of action for management may be to simply acknowledge negative performance without communicating its cause. This approach may allow the firm to switch from a backward-looking problem-focus to a more forward-looking and positive solution-focus.
We also find that attribution patterns vary by national culture with Japanese managers engaging in NPIA to a greater extent than American counterparts. We have a concern that the cultural force toward self-criticism may trap Japanese managers in the NPIA practice, which does not necessarily help toward the future improvement efforts according to our findings. For Japanese managers and others in a similar cultural context, our findings suggest that it may be a better practice for them to resist their tendency to self-criticize. Acknowledging negative performance without publicly placing the blame on any factor or anyone including themselves may be a more constructive starting point of the path in search for future improvement.
Limitations and future research directions
Despite its contributions, this study is not without limitations. First, this study identified the significant relationships between performance attribution patterns (i.e., NPEA and PPIA) and subsequent performance, and provided the rationale behind such relationships. However, the empirical data in this study do not reveal the detailed mechanisms underlying these relationships. Future research can build on this study by investigating the specific mechanisms underlying these relationships. Another limitation is that the data used to test hypotheses in this study are context-specific. In other words, this study was conducted in the context of (a) large, publicly traded firms headquartered in established, industrialized nations and (b) facing an economic crisis. Future research may test the relationships postulated in this study in broader contexts including private companies, firms headquartered in other countries, and under noncrisis economic conditions, to better understand the generalizability to these contexts.
Conclusions
This study contributed to the attribution literature by providing a nuanced understanding of the relationship between four patterns of top management attributions and subsequent firm performance. We examined the role of national context in this study. While culture is related to the tendency of making different patterns of performance attributions, we did not find evidence that national context (including but not limited to national culture) moderated the relationships between attribution pattern and subsequent performance. Overall, our results suggest that top managers may be able to positively influence future performance by attributing positive performance outcomes to internal causes, and by avoiding blaming external causes for negative performance outcomes.
ACKNOWLEDGMENTS
The authors would like to thank two anonymous reviewers for their feedback and guidance on earlier versions of this manuscript.
APPENDIX: CODING GUIDELINES
In the letters to shareholders, top management discusses how the firm has performed (outcomes), and may provide reasons why the firm performed as it had. Performance outcomes can be positive (e.g., the firm is performing well) or negative (e.g., the firm is performing poorly), and may include measures such as changes in market share, revenue, profitability, share price, achieving or failing to meet targets, etc. The reasons for the performance can relate to causes lying outside of the firm (external attribution) or inside the firm (internal attribution). There are four types of attributions (NPEA, NPIA, PPIA, PPEA), which are considered in the coding process. Coders content analyzed the letters to shareholders at the sentence level, recording the frequency of observations of each attribution type. Below, these four types are described, together with content samples from the
Table A1 Attribution pattern descriptions provided to coders and examples of attribution content

letters.


