

Introduction
Income security in case of sickness, disability and other social risks is a goal for all welfare states. Income security can be defined as a relatively stable income situation, sufficient for sustaining a given – or at least a decent – material standard of living (ILO, 2018; also Clasen, Reference Clasen2017). The purpose of this study is to assess how this goal was achieved in the mid-2000s in Denmark, Finland, Norway and Sweden for those who died in late middle age, i.e. when aged 55–69 years. At this life stage, the majority in these Nordic countries will either be employed or in an early phase of retirement (Nordic Statistics, 2018a). Those we analyse in this paper met with a relatively premature death. Prior to that unhappy demise, many will have experienced mounting health problems. Their economic situation might deteriorate – but did that happen, or were they able to preserve their customary material standard of living? This question is analysed with data on equivalized disposable income during the last 12 years prior to death. We ask whether the analysed category had to endure a declining material standard of living towards the end of life; we estimate how incomes deviated from the incomes of comparable others who did not die during the observation period; and we analyse educational inequalities in the income trajectories of these men and women.
Income security is often studied by an institutional and social rights approach, focusing on benefits from welfare programmes and social insurance (e.g. Hinrichs & Lynch, Reference Hinrichs, Lynch, Castles, Leibfried, Lewis, Obinger and Pierson2010; Reference NelsonNelson, 2013; Reference Sjoberg, Palme, Carroll, Castles, Leibfried, Lewis, Obinger and PiersonSjoberg, Palme, & Carroll, 2010). By analysing equivalized disposable incomes, i.e. household post-tax income adjusted for household composition, attention is shifted towards the aggregate outcome of income maintenance mechanisms operating in the context. A reason for this approach is that, when facing social risks, the crucial issue for the individual (and a major welfare policy issue) is hardly what specific mechanisms that influence income, but rather whether the accustomed material standard of living can be maintained. Another feature of the present study is its comparative design. We analyse how a similar destiny (i.e. death age 55–69) affects income trajectories prior to death in four Nordic countries. The analysed countries are all varieties of the Nordic welfare state model (Reference Esping-AndersenEsping-Andersen, 1990), but whether income security when hit by severe health difficulties is similar or differs between these countries, is not well known, and this study sheds light on this question.
Below, we discuss how the analysed outcome – equivalized disposable income – will be generated by the combined effects of different income maintenance mechanisms, and we review some relevant previous studies. Thereafter, more details about the design and research questions are given, before we proceed to the empirical analyses.
Sources of income maintenance
Cancers, cardiovascular conditions, and (to a lesser degree) respiratory disease are the major causes of death during late middle age (NOMESCO, 2015), constituting, for example, more than 70 per cent of the deaths in the Norwegian sample analysed in this study. Some deaths are sudden (e.g. acute myocardial infarction, violent death), but most deaths will occur after a disease history varying from a few months to many years (Reference Kaplan, Baltrus and RaghunathanKaplan, Baltrus, & Raghunathan, 2007).
Many of the individuals analysed here will therefore experience increasing health problems and functional limitations during their last years alive. For those who were retired or pensioners already before the onset of disease, incomes may be relatively unaffected. Among those who were employed before falling ill, income may decline, but this will not always happen. One income maintenance ‘line of defence’ is whether the employed keeps his or her work income in spite of health difficulties. This depends, inter alia, on legal regulations, work tasks, and informal norms. Employment protection legislation may hinder or postpone dismissal of employees who are less productive because of illness (ILO, 2015). Similar constraint may arise from collective agreements between employers and trade unions, or from tradition and established practices. To what extent ill health limits possibilities for managing work tasks, depends on job characteristics, and occupations differ in requirements for physical strength, endurance and necessity of being present. Employers may also choose to keep employees on the payroll even when sick because of valuable competence or personal obligations.
If work income nevertheless declines, reductions in overall income can be curbed by cash benefits from public welfare programmes and social insurance, or from private insurance (Reference ClasenClasen, 2017). Many such programmes exist in Nordic countries: sickness benefits, disability benefits, job-retraining benefits, old-age pensions, preretirement pensions, unemployment benefits, housing benefits, child allowances, social assistance, and some other minor public programmes, as well as some types of employment-based or purely private social insurance (NOSOSCO, 2005). Information on income protection schemes in a number of countries is found in the Social Policy Indicators database (SPIN, 2017) and the Comparative Welfare Entitlements Dataset (Reference Scruggs, Jahn and KuittoScruggs, Jahn, & Kuitto, 2014). Typically, studies of social citizenship rights in Nordic countries paint a comparatively favourable picture (Reference ScruggsScruggs, 2006), as these countries seem to provide wide coverage and relatively generous levels of sickness benefits and disability pensions (Böheim & Leoni, Reference Böheim and Leoni2018; Reference Kangas, Castles, Leibfried, Lewis, Obinger and PiersonKangas, 2010; OECD, 2010).
However, analyses of the legal stipulations and formal rules of these welfare programmes will only give approximate information about how incomes are affected. Social insurance replacement rates, i.e. the ratio between cash benefits when out of work and wages and salaries when working (Reference ScruggsScruggs, 2006), have been characterised as ‘theoretical’ (Reference Peeters, Verschraegen and DebelsPeeters, Verschraegen, & Debels, 2014) and ‘fictious’ (Knoef et al., Reference Knoef, Been, Alessie, Caminada, Goudswaard and Kalwij2016), as they only indicate what certain types of persons with specific sets of characteristics would receive in benefits from specific programmes, if eligible, applying, and rules are followed (see also Reference Smith and ZhangSmith & Zhang, 2011; Reference WhitefordWhiteford, 1995). The impact on the total income situation of those in need will also be difficult to estimate because a recipient may obtain benefits from several welfare programmes at the same time, and it cannot be taken for granted that potential recipients always receive what they are entitled to.
Moreover, taxation will influence how consumption opportunities are maintained. Progressive taxation implies that a reduction in pre-tax income will lead to less reduction in post-tax, i.e. disposable, income. The previous material standard of living may therefore be upheld even when gross income declines, if progression is relatively steep. Tax exemptions and tax deductions for people with particular needs (e.g. deductions for medical expenses) or particular statuses (pensioners, unemployed, disabled) may play a similar role.
Lastly, opportunities for maintaining economic wellbeing when illness and disease occur will be affected by family situation. Individuals living alone may be more likely to experience a deteriorated material standard, since they will often have to rely only on the formal institutions of the welfare state, with less or no access to family resources. Reduced income for the affected person may be countered by spouses’ incomes, and a partner may increase his or her paid employment in order to maintain the material standard of the household.
Thus, the economic welfare prior to death will be influenced by a number of circumstances: health and disease trajectories, whether the affected individual was employed or retired, and the impact of labour protection legislation, employers’ behaviours, welfare programmes, social insurance, taxation policies and family situation. The outcome analysed in this paper – equivalized disposable income – indicates the combined effect of these mechanisms and income maintenance sources.
Previous research
The difficulty in assessing income security among unemployed, sick, disabled and other vulnerable population categories only by analysing welfare programmes and social insurance has been recognised for a long time (Reference WhitefordWhiteford, 1995). Accordingly, previous research has also addressed the actual economic situation of such population categories, using indicators such as income level, poverty or reported financial difficulties. In particular, the situation of the elderly has been investigated. Studies have examined how pensioners’ incomes are influenced by the interaction between life trajectories, family history, and pension systems (Been, Caminada, Goudswaard, & van Vliet, Reference Been, Caminada, Goudswaard and van Vliet2017; Peeters & de Tavernier, Reference Peeters and de Tavernier2015). Findings from Nordic countries suggest that poverty among the elderly is relatively low and has declined in recent decades (Fritzell, Bäckman, & Ritakallio, Reference Fritzell, Bäckman, Ritakallio, Kvist, Fritzell, Hvinden and Kangas2012). Referring to the mid-2000s, OECD found that average disposable income in Nordic countries among those aged 65 and more, relative to the population average, ranged from 72 per cent in Denmark to 82 per cent in Sweden (OECD, 2011).
For the present study, investigations of effects of morbidity and functional limitations on income are particularly relevant. An OECD report showed that in the mid-2000s, average equivalized disposable income among people with disabilities, compared to the average of the working-age population, varied from 88 per cent in Denmark to 94 per cent in Sweden (OECD, 2010, p. 54). A Swedish panel study found that respondents with limiting long-standing illness reported more financial difficulties when interviewed after eight years; this was especially marked among those with lower socioeconomic positions (Reference Lindholm, Burstrom and DiderichsenLindholm, Burstrom, & Diderichsen, 2002). Hospitalisation in Denmark for serious disease, age 43–60 years, tended to be followed by a loss of annual income the next year corresponding to one decile in the income distribution (Reference Rayce, Christensen, Hougaard and DiderichsenRayce, Christensen, Hougaard, & Diderichsen, 2008).
Income effects of disease have in particular been investigated for cancer survivors, with studies from Norway (Reference Benth, Dahl, Luras and DahlBenth, Dahl, Luras, & Dahl, 2014; Hauglann, Benth, Fossa, Tveit, & Dahl, Reference Hauglann, Benth, Fossa, Tveit and Dahl2014; Reference Syse and TonnessenSyse & Tonnessen, 2012), Denmark (Andersen, Kolodziejczyk, Thielen, Heinesen, & Diderichsen, Reference Andersen, Kolodziejczyk, Thielen, Heinesen and Diderichsen2015; Jensen et al., Reference Jensen, Overgaard, Boggild, Garne, Lund, Overvad and Fonager2017) and Sweden (e.g. Eaker et al., Reference Eaker, Wigertz, Lambert, Bergkvist, Ahlgren and Lambe2011). Mostly, average reduction in overall individual income in the first years after diagnosis seems to be moderate (three to seven per cent). Overall incomes declined less than work incomes, due to the compensating effects of welfare benefits. The negative effects on income seemed to be temporary, however. Only small differences in income developments between cancer survivors and analysed control groups could be observed 10–13 years after diagnosis, but income effects were often unfavourable among those with low education (Reference Syse and TonnessenSyse & Tonnessen, 2012). The reason for relatively moderate long-term income effects of a cancer diagnosis could be that those who survive cancer may in many cases regain previous health. In contrast, large negative income effects have been found in studies among patients with multiple sclerosis (Wiberg et al., Reference Wiberg, Friberg, Stenbeck, Alexanderson, Norlund, Hillert and Tinghog2015) and non-affective psychosis (Falk et al., Reference Falk, Burstrom, Dalman, Jorgensen, Bruce and Nylen2016), and among individuals who died of alcohol-attributable causes (Reference Tarkiainen, Rehnberg, Martikainen and FritzellTarkiainen, Rehnberg, Martikainen, & Fritzell, 2018).
Thus, Nordic research has provided considerable information about income among cancer survivors and among disabled working-age people, and a few studies have examined income effects of other severe conditions. Otherwise, knowledge seems scattered, and only a few comparisons between Nordic countries have been undertaken.
Design and research questions
Income security is analysed in this study using a design that differs in several ways from most previous research. The focus is on those who died during late middle age. Such deaths occurred sufficiently often during the mid-2000s to be interesting for income security analyses. Life tables for the year 2000 indicate that among Finnish men who were alive at age 40, 17.9 per cent would die before their 66th birthday (HMD, 2016). Corresponding figures for Danish, Norwegian, and Swedish men were 17.0, 13.2, and 12.0 per cent, respectively. Female death risk was lower, but in Denmark, one in nine women alive at age 40 would have passed away by the age of 66.
Typically, previous studies have selected individuals who were diagnosed with a certain disease or had experienced another significant health event (e.g. hospitalisation), and analysed their incomes during the following years. By using death as the criterion for being included in the study, less known aspects of income security emerge. Since previous studies have primarily focused on survivors, those afflicted by fatal diseases will be less examined, while there will be many such severe disease trajectories in the samples we have analysed. Unfortunately, health information during the 12 observation years was unavailable in our data, but the distribution of causes of death in the relevant age categories (NOMESCO, 2015) indicates that a large proportion in the samples suffered from serious and finally lethal diseases. However, there were certainly many individual variations in the health trajectories prior to their death.
The present study is moreover designed to enhance comparisons between the four analysed countries. Although commonly considered as representing the same Nordic welfare state model (Reference Esping-AndersenEsping-Andersen, 1990; Reference Kautto, Castles, Leibfried, Lewis, Obinger and PiersonKautto, 2010), various differences in welfare programmes exist (NOSOSCO, 2005), for instance as regards benefit levels (e.g. especially high sickness payments in Norway), organisation of social benefits (unemployment insurance was voluntary in Sweden), the relative importance of different types of benefits (housing benefits were more widespread in Sweden than in the other countries), and taxation rules. By using the same inclusion criterion (those who passed away when aged 55–69), a harmonised outcome (equivalized disposable income) and the same length of the observation period (12 years), a comparison of income security in Nordic countries is facilitated.
Three questions are central in the following analyses. First, we examine to what extent the initial level of equivalized disposable income in the samples was maintained during the observation years. We assume that the approaching death and its related circumstances will have had little influence on income at the start of the 12 years study period. Second, we ask whether income developments deviated from what they would have been, hypothetically, if they had avoided their untimely death. Thus, the counterfactual question ‘what would the income have been for those who died, if they had not died?’ is raised (Reference Morgan and WinshipMorgan & Winship, 2007). Third, we address a social equity issue (Reference Kvist, Fritzell, Hvinden, Kangas, Kvist, Fritzell, Hvinden and KangasKvist, Fritzell, Hvinden, & Kangas, 2012) by studying whether income trajectories before death differed by educational level. In the Results section, main findings as regards these three questions are reported. In the subsequent Discussion section, supplementary analyses are used in order to assess possible interpretations.
Data and methods
The study uses information from administrative registers provided by the national statistical offices in the four countries. Individual-level information from different registers has been linked by the unique identification number assigned to all residents. Individuals who died when aged 55–69 years in 2008 (Denmark, Norway, Sweden) or 2007 (this year had to be chosen for Finland, due to data availability) were selected, i.e. birth years 1939–1953 and 1938–1952, respectively. The analysed samples cover in practice all deaths among registered inhabitants in the selected death year and age categories in Denmark, Norway and Sweden. The Finnish data came from register information on an 80 per cent random sample of all deaths in 2007. Missing values on relevant variables were very few in all country samples. In the Norwegian registers, for instance, only 0.1 per cent of the 1939–1953 birth cohort residing in Norway at the start of 2008 lacked educational information, and 98.8 per cent had usable information on income and household composition for the years 1996–2007. Those few without necessary information on required variables were removed from the analyses.
Equivalized disposable income, indicating the individual's opportunity for consumption, was estimated as the sum of post-tax personal income for all household members divided by a household consumption burden weight calculated by the modified OECD scale (Eurostat, 2017): the first adult in the household counts as 1.0, other adults aged 14+ = 0.5, and each child = 0.3. Uncertainty exists as to the accuracy of the register information on household composition, but such errors are unlikely to distort main results. Real changes in consumption opportunities were assessed by adjusting incomes in each observation year to the country's consumer price index that year, relative to 2007 in Denmark, Norway and Sweden, and to 2006 in the Finnish sample. Income information was available in national currencies; the analyses required no conversion into Purchasing Power Parities.
The analyses report median values of equivalized, price-adjusted, disposable income (income for short). Median income, compared to mean income, has the advantage of indicating the typical without being sensitive to extremely high or very low (even negative) incomes. In order to make figures more readable, formal tests of significance are not included – such tests can be deemed less necessary since the data material approximates total population coverage.
The three-level educational classification was based on country-specific versions of ISCED (International Standard Classification of Education): low education (basic/compulsory or lower, ISCED levels 0–2); medium education (ISCED levels 3–4); and higher education (tertiary, college, university, ISCED levels 5–8). To simplify the presentation of results, median incomes are only displayed for the higher and lower educational category; in all four countries, median income for the medium educational category was in-between. The country samples are described in Table 1.

The second research question asked how income trajectories would have been, hypothetically, if death and its related circumstances had not occurred. Comparison samples intended to represent counterfactuals, i.e. estimated income trajectories for those who died if they had avoided their unfortunate death, were constructed by using register data on all individuals in the register data in the same birth cohorts as those who died (i.e. 1939–1953, or 1938–1952 in Finland). Propensity scores, i.e. the estimated conditional probability of dying, were estimated by logistic regression models (Reference Morgan and WinshipMorgan & Winship, 2007, p. 98; Reference AustinAustin, 2011; see Wiberg et al., Reference Wiberg, Friberg, Stenbeck, Alexanderson, Norlund, Hillert and Tinghog2015, for an example). In these models, the outcome was death in 2008 (Finland: 2007) versus living beyond this year, while age, gender, education, marital status, and receiving disability pension 12 years before death (when the samples were aged 43–57 years old) were used as predictors; in the Swedish sample, information on disability pension was unavailable and having no work income was used as a substitute. Survivors living beyond the last year in the observation period were weighted by the estimated propensity scores. As this procedure removed large parts of the differences in distributions on background variables between those who died and the weighted samples of survivors (see Appendix table for Finland; similar tables for the other countries are available on request), observed income developments in the weighted samples of survivors will approximate what would have happened among those who died, given that their unhappy destiny had been avoided.
Results
Figure 1 shows median equivalized disposable income (adjusted for consumer price changes) among those who died during their last 12 years prior to death. The lines indicate percentage deviations for each observation year from the median income in the baseline year (i.e. 1996 in Denmark, Norway and Sweden; 1995 in Finland). This initial baseline median income is represented by the value of 100 in the figure.
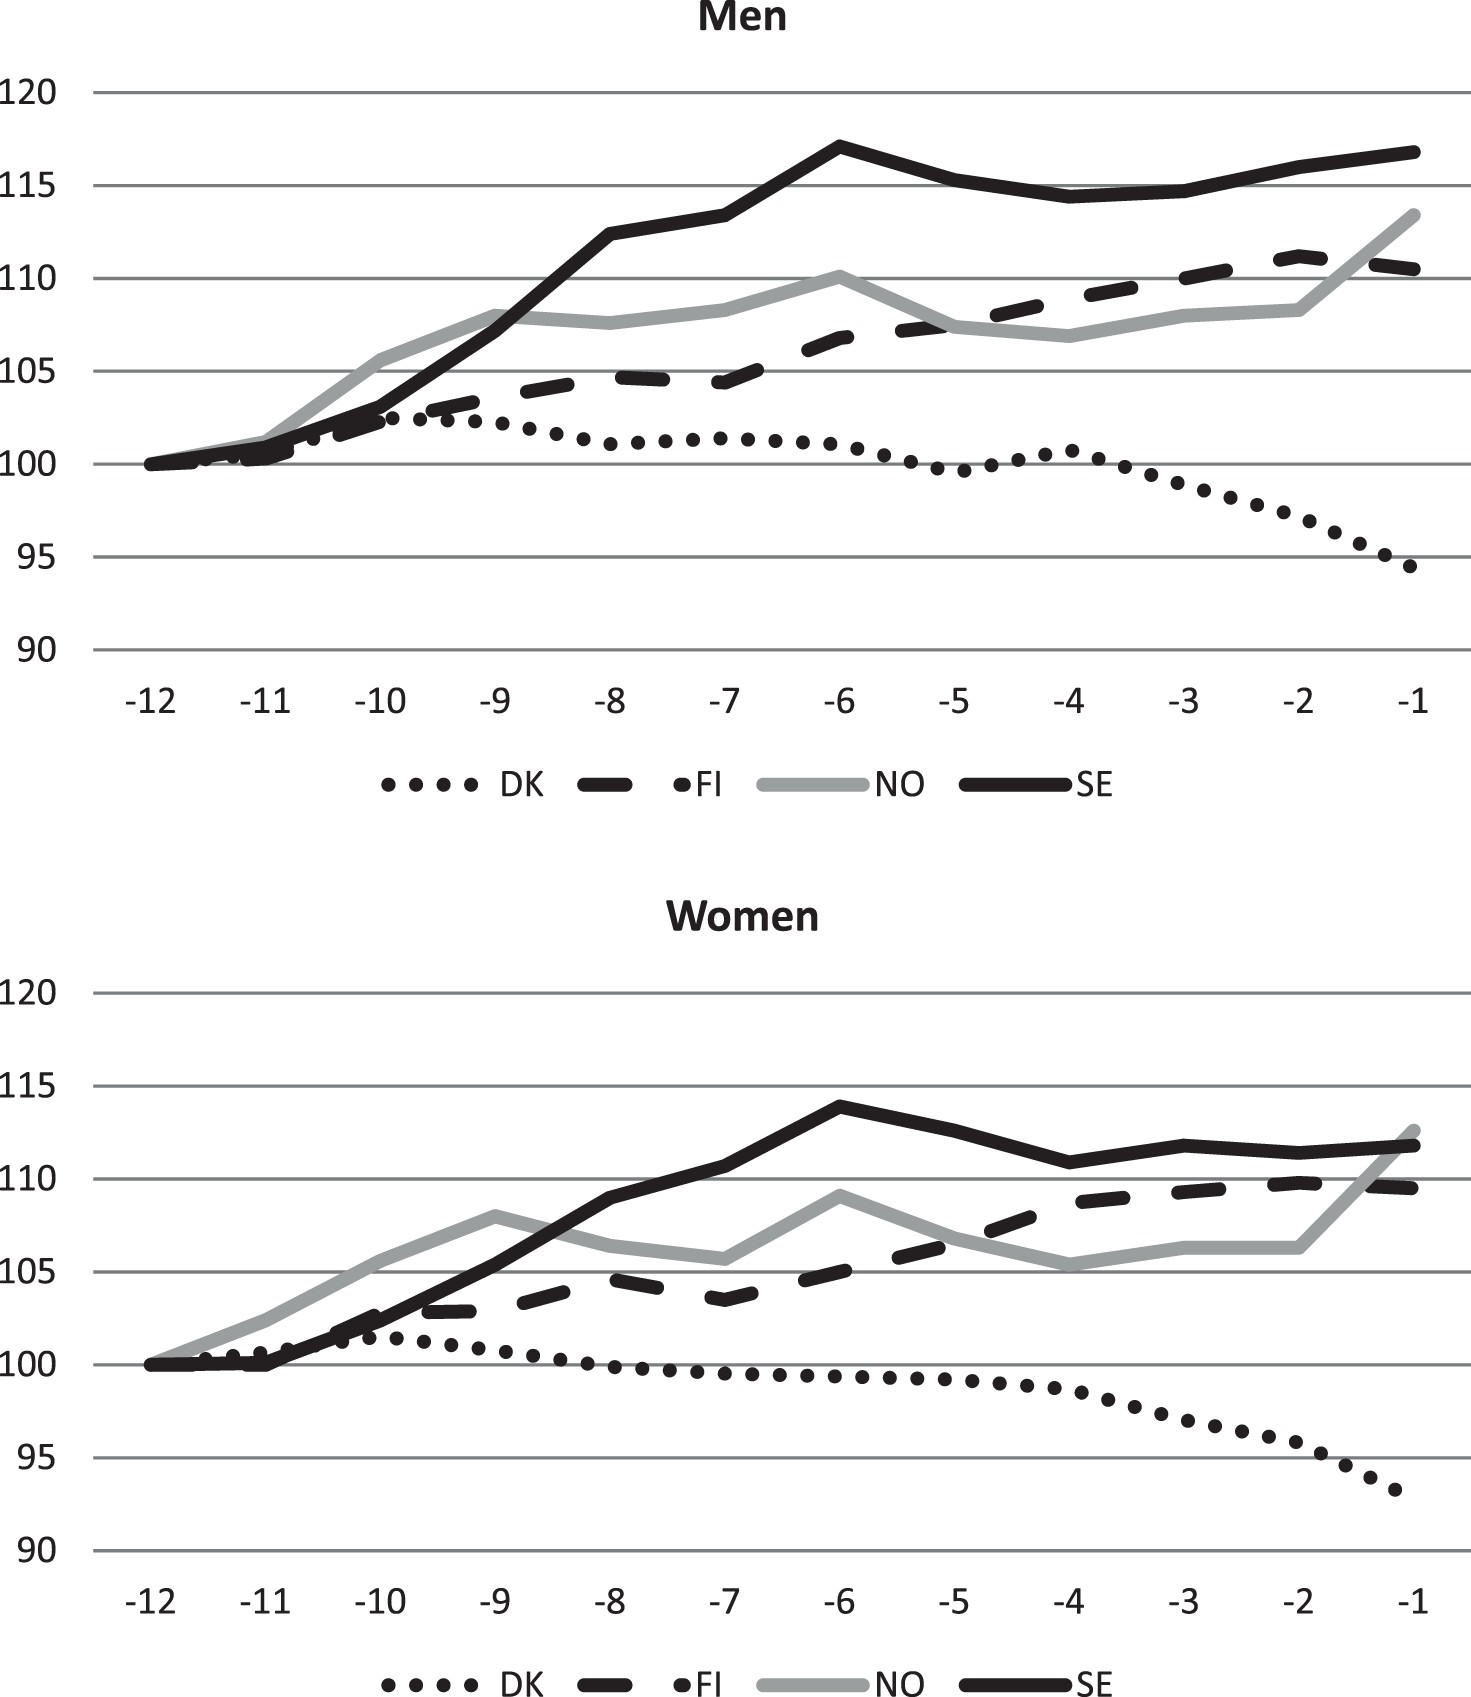
Figure 1. Median household-adjusted, price-adjusted, disposable incomes during the last 12 years alive, relative (percentage points) to 12 years before death (= 100 per cent). Men and women who died when aged 55–69 years. Horizontal axis = number of years before death. DK = Denmark, FI = Finland, NO = Norway, SE = Sweden.
In Finland, Norway and Sweden, median income increased. For men, median income in the last year alive was 10.5 per cent higher in Finland, 13.4 per cent in Norway, and 16.8 per cent in Sweden, than 12 years earlier. Similar, although slightly lower, increase was observed for women. Income growth was steady in Finland, while in Norway and Sweden the marked increase during the first years was followed by a more stable level during the last five to six years prior to death. A different picture is seen in Denmark, however, where median income increased the first years, but declined afterwards, and median income the last year alive, relative to 12 years earlier, had sunk to 94.4 per cent for men and 92.8 per cent for women.
Figure 2 indicates how income trajectories among those who died deviated from what could be expected, given that they had avoided their untimely death and its related circumstances. The figure shows median income among those who died as a percentage of the corresponding estimated median income in the weighted comparison samples of survivors, for each of the 12 years prior to the year of death.

Figure 2. Median income during 12 years prior to death, in per cent of median values in weighted comparison samples.
Developments were fairly similar in the four countries. Already at the start of the observation period, those who eventually died had slightly lower median income than the estimated median income in the comparison samples, indicating that the propensity score matching method did not remove all relevant differences between those who died and the weighted samples of survivors. The gap at the start of the observation period was modest, however, varying from 1.3 per cent (Swedish women) to 5.0 per cent (Danish and Norwegian men).
As the year of death came closer, the gap widened in all countries, however only by about three percentage points among Danish and Norwegian women. During the last year alive, the gap was relatively large among Swedish men (about 14 per cent below the median of survivors) and relatively small (six to seven per cent) for Danish, Finnish, and Norwegian women. Thus, although typical consumption opportunities increased for those who died (exception: Denmark), the estimated increase for similar individuals who survived beyond the last year of the observation period was clearly larger. In this sense, there was an ‘economic penalty’ of dying, especially among men; during the last year alive, median incomes among men who died were some 6–10 per cent lower than they would have been, hypothetically, if not struck by the circumstances of their death.
The third research issue is addressed by Figure 3 which shows, for those who died, the median values for the low educated in per cent of median values for those with higher education. At the start of the study period, median income among low educated men was 26–29 per cent lower than among men with high education; among women, the gap varied from about 16 per cent lower in Denmark to about 30 per cent in Norway. As death approached, developments in median income were less favourable among those with low education. During the last years before death, incomes among men were about 36–38 per cent lower for low educated than for high educated; among women, the gap was about 32–35 per cent. An anomaly occurred in Norway, however, as the educational gap in median incomes decreased the very last year prior to death.

Figure 3. Median income among low educated in per cent of median income among high educated, during the last 12 years alive.
Discussion
Overall patterns and the Danish discrepancy
Considerable similarities between the four Nordic countries emerged in the analyses, but there was one striking exception. In Finland, Norway and Sweden, those who died did not only preserve, but even improved, their price-adjusted level of equivalized disposable income during the years preceding death. In Denmark, however, decline was observed after a few years. Since all the four analysed countries are varieties of a Nordic, ‘social-democratic’, welfare model, and all of them experienced substantial overall economic growth from the mid-1990s to the mid-2000s (Nordic Statistics, 2018b), the discrepancy is somewhat surprising. One may also ask why consumption opportunities increased in three of the countries, since it could be expected that work income would decline as death came nearer, and welfare programmes, even when generous, would not replace all work income loss. A detailed report on social protection in Nordic countries in the early 2000s (NOSOSCO, 2005) found that replacement rates net of taxes (‘compensation levels’) for most types of work-related benefits were in the 60–80 per cent range. Thus, some decline in consumption opportunities would not be unlikely – but why did that not happen?
To understand this, the heterogeneity of health trajectories and employment situation in the analysed samples should be considered. Unfortunately, data did not allow for any detailed description of the life courses of the samples, but possible interpretations can be suggested. For some parts of the samples, incomes would hardly be influenced by the approaching deaths, for instance among those who had a ‘normal’ work career up to the time point when death occurred either suddenly or after a very short disease period. Also, among those who had retired already at the start of the observation period, or became pensioners during the study years before experiencing substantial health problems, the coming death and its related circumstances would probably have little income impact. In the Finnish and Norwegian samples, for instance, around 20 per cent were disability pensioners when the observation period started. The risk of income decline would mostly occur among those who were employed before the onset of a prolonged disease which impaired work capacity. They were probably a quite significant proportion of the samples, but exactly how large is uncertain.
Thus, one reason for the improvement in median consumption opportunities (in Finland, Norway and Sweden) was that not a few in the samples had a life situation and income sources which implied that the coming death would have little impact on incomes. Among them, income developments would be more or less parallel to general trends, which in the Nordic macro-economic context during these years meant real growth both in wages, salaries and income-related pensions and benefits. In addition, the particular life phases of the analysed samples did also play a role. At the start of the observation period, when aged 43–57 years, quite a few would have adolescent children living at home. Twelve years later, many children will have left. Both in the Finnish and in the Norwegian sample, average household size was about 2.5 at the start of the observation period, but had decreased to 1.8 in the last year before death. When the household's consumption burden decreased, equivalized incomes could increase even if household incomes were stable or even slightly decreasing.
These general considerations do not explain the particular Danish pattern, however, which was probably related to retirement particularities. The typical income drop on transition to pension has been estimated to be generally larger in Denmark than in the three other countries in 2003 (NOSOSCO, 2005, p. 124, 139). Analyses by OECD, referring to the early 2000s, have estimated that ‘net replacement rates’ for average earners when retiring (voluntary pension schemes excluded) were 54.1 per cent in Denmark, 65.1 per cent in Norway, 68.1 per cent in Sweden and 78.8 per cent in Finland (OECD, 2005, p. 52). In addition, typical age when retiring during the 2000s was lower in Denmark (and in Finland) than in Norway and Sweden (Finnish Centre for Pensions, 2008, pp. 23–24; Statistics Sweden, 2013, p. 29). This suggests that the decreasing median incomes observed in Denmark as death approached (Figure 1) were probably due to relatively many transitions to pensions in combination with more income drops after retirement than in the other three countries.
Figure 4 suggests the likelihood of this interpretation. This figure is a replica of Figure 1, but includes only those who died when aged 55–64. Those who died when aged 65–69 years have been excluded, i.e. the parts of the analysed samples where retirement certainly was particularly widespread. Figure 4 shows, in line with the interpretation proposed above, that in these reduced samples, median income increased also in Denmark, both for men and women, although not as much as in the other countries. It can be added that separate analyses in the Danish sample, including only those who died when aged 55–59 years, indicated an even larger income growth during the 12 observation years (table not showed, available on request).

Figure 4. Median incomes during the last 12 years alive, relative to 12 years before death (= 100 per cent); men and women who died when aged 55–64 years.
Thus, it may be that many underlying income maintenance mechanisms were rather similar in the four countries, but a tendency to earlier transitions to retirement in combination with somewhat larger income decrease when retiring implied that an income decline in the analysed Danish samples occurred. However, typical retirement age was also relatively low in Finland (Finnish Centre for Pensions, 2008, pp. 23–24); the reason that no income decline was observed in the Finnish sample was probably that income drops after retirement were less marked than in Denmark (OECD, 2005, p. 52).
The educational inequalities
Social equity is a proclaimed ideal of the Nordic welfare states (Kvist et al., Reference Kvist, Fritzell, Hvinden, Kangas, Kvist, Fritzell, Hvinden and Kangas2012), and social benefits in the Nordic countries are often considered redistributive since they compensate work income to a higher degree for low-income employees than for higher salaried (Reference Hinrichs, Lynch, Castles, Leibfried, Lewis, Obinger and PiersonHinrichs & Lynch, 2010, p. 358; NOSOSCO, 2005). One might therefore expect that the possible economic burden of dying prematurely would not differ with social status. The analyses (Figure 3) showed, however, that in each of the four countries, the higher educated experienced on average a more advantageous income development during the years prior to death than the low educated.
Better social networks, more family resources and better social insurance could be contributing to this pattern. However, access to work income is also likely to be very important. This is indicated in Figure 5, which shows median work income during the study period for men with lower and higher education (this information was only available for Denmark, Norway and Sweden). Among those with low education, median work income started to drop around 10 years before death and was reduced to zero during the last four years alive. In contrast, those with higher education experienced in general no drop in median work income until about six years before death, and even during the last year alive, median work income was above zero. As those who were able to stay employed would generally have better incomes than those who left employment, differences in access to work income did certainly contribute to the overall better income developments for the higher educated than for the low educated.

Figure 5. Median pre-tax work income prior to death among men who died when aged 55–69 years, low and high educated, per cent of median income the first year of 12 years observation period.
Differences in work participation could be due to different placement in the occupational structure. Employers might be more inclined to keep high educated on the work staff even when afflicted by disease, and those with higher education will typically have occupations where functional limitations more often will be compatible with usual work tasks – such limitations may mean less for a designer or researcher than for a bus driver or a plumber (Reference Lutfey and FreeseLutfey & Freese, 2005; Reference Syse and TonnessenSyse & Tonnessen, 2012).
Since both high and low educated in these samples died, at approximately the same age, it might be that average disease severity during the last years alive did not differ in any major way between educational levels. If so, higher work participation among high educated was not due to less disease severity, but rather to educational differences in possibilities for continued employment even when impaired by disease. Whether disease severity and accompanying functional limitations were similar or varied with educational levels in the analysed samples is uncertain, however. The analysed deaths will differ – many were certainly due to protracted chronic disease, while others would be relatively rapid outcomes of non-external causes (e.g. stroke, aggressive cancer types), and still others would be sudden deaths due to accidents or other external causes. As typical life expectancy is lower among low educated, it may be that disease onset will typically occur at a lower age among them. Data available for the present study did not allow for a closer scrutiny of possible educational differences in health and disease trajectories during the years before death.
When interpreting the educational inequalities in income trajectories prior to death, one should also take into consideration more general trends in income inequality. Figure 6 shows income inequalities between high and low educated during the observation years – not for those who died, as in Figure 3, but in the weighted comparison sample of survivors, i.e. those with similar characteristics, belonging to the same birth cohorts, who lived beyond the last year of the observation period. Figure 6 indicates that also among the survivors, the gap in median income between high and low educated increased considerably during the observation years – by and large in the same way as among those who died. This suggests that the increasing income inequalities between educational levels was not specific for those who died when aged 55–69 years old, but a general feature of developments in income inequalities during the analysed time period.

Figure 6. Median income among low educated in per cent of median income among high educated, in the weighted comparison samples.
Limitations
The present study used high-quality register data in samples where attrition was practically negligible, but information on specific income sources, retirement transitions, and health trajectories during the observation period was mostly unavailable. This limited the possibilities for testing specific explanations. Since the participating researchers were not allowed to export the national individual-level data files to a pooled data file, because of data security regulations, data had to be analysed separately in each country. Thus, a possible role of compositional differences between the country samples for contry differences in income security could not be rigorously examined. The design of this study has advantageous aspects, but an even more ideal design would be to follow samples diagnosed with fatal disease prospectively for a long period of time, with more specific and continuous observations on health, work and income. Whether the results reported in this study are generalisable to other age categories or to other time periods, is of course uncertain. Some welfare programmes have changed in the analysed countries during recent years (NOSOSCO, 2015). This study has focussed on equivalized disposable income, which does not capture how free or heavily subsidised public services contribute to economic welfare. This will hardly mean much for inter-Nordic comparisons, however, since public services were mostly funded in similar ways in these countries during the time period under study.
Conclusion
Income security is a major objective of welfare states, and this study has examined the topic in four Nordic welfare states by investigating price-adjusted equivalized disposable income during the 12 last years alive among men and women who died when aged 55–69 years. Some deaths will have occurred suddenly, but mounting disease problems during the years prior to death will have plagued many in the analysed samples. In spite of that, median equivalized disposable incomes were some 10–15 per cent higher the last year alive in Finland, Norway and Sweden, compared to 12 years earlier. Several circumstances could have contributed to this positive development. Macro-economic trends from the mid-1990s to the mid-2000s were favourable in all the analysed countries, implying real growth in work incomes and income-related pensions and benefits. For those who had to leave work because of health difficulties, loss of work income would often be partly compensated by social benefits, and progressive taxation and family resources would contribute to hinder decline in equivalized disposable income. Besides, among those who were retired before disease onset and among those who died suddenly, the approaching death and its related circumstances would hardly affect incomes. In Denmark, however, median incomes decreased, apparently because of more early transitions to retirement, in combination with larger drops in income after retirement, compared to the other three countries. Otherwise, income trajectories for those who died were fairly similar in the four countries, suggesting many underlying similarities in welfare systems and income maintenance mechanisms. However, income developments were estimated to be more positive in weighted comparison samples, matched on age and socio-economic characteristics, who survived beyond the study period. This indicates how the unfortunate destinies analysed in this study had negative economic implications. Moreover, among those who died, but also in the weighted comparison samples who did not die, the higher educated had more favourable income developments than the low educated. An important contributor to this seems to be that the high educated were able to stay employed during the years prior to death to a higher degree than low educated.
Acknowledgement
The authors thank for critical comments to a previous draft and very helpful recommendations from three anonymous reviewers.
Disclosure statement
No potential conflict of interest was reported by the authors.
Appendix table
Distributions in three Finnish samples: born 1938–1952 and died 2007; born 1938–1952 and survived 2007; weighted sample of survivors.


 Open access