


1. Introduction
Substantial effort has been devoted to the study of pressure fluctuations in incompressible wall turbulence using theoretical approaches (Panton & Linebarger Reference Panton and Linebarger1974), direct numerical simulation (DNS) (Kim Reference Kim1989) and experiments in wind tunnels (Tsuji et al. Reference Tsuji, Fransson, Alfredsson and Johansson2007) or in the atmospheric boundary-layer (Klewicki, Priyadarshana & Metzger Reference Klewicki, Priyadarshana and Metzger2008). DNS is still limited in the high-Reynolds-number range by available computer resources, the highest reported friction Reynolds number being  $Re_{\tau _w}=10{\,}045$ (Hoyas et al. Reference Hoyas, Oberlack, Alcántara-Ávila, Kraheberger and Laux2022), whereas experiments are confronted with the difficult problem of filtering out parasite wind-tunnel noise (Tsuji et al. Reference Tsuji, Imayama, Schlatter, Alfredsson, Johansson, Hutchins and Monty2012) and the frequency response of the transducers (Tsuji et al. Reference Tsuji, Fransson, Alfredsson and Johansson2007). Regarding the scaling of the wall fluctuation level $(\overline {p'p'})^+_w$ in incompressible flow, Panton, Lee & Moser (Reference Panton, Lee and Moser2017) used inner/outer matched asymptotic expansions to justify ( $\ln Re_{\tau _w}$)-scaling which suggests unbounded growth of inner-scaled $[p'_{rms}]_w^+$ with $Re_{\tau _w}$, but a finite limit when using mixed scaling $\rho u_\tau \bar {u}_{{CL}}=\bar {\tau }_w\sqrt {2/c_f}$ for $p'$ instead. However, recent work by Chen & Sreenivasan (Reference Chen and Sreenivasan2022) argues that a $Re_{\tau _w}^{-1/4}$-scaling (yielding a finite limit in wall-units as $Re_{\tau _w}\to \infty$) is more consistent with data, in line with the matched asymptotic analysis of Monkewitz (Reference Monkewitz2022) for the streamwise velocity covariance $\overline {u'^2}$. Standard notation (Smits & Dussauge Reference Smits and Dussauge2006, pp. 61–65), $({\cdot })=\overline {({\cdot })}+({\cdot })'=\widetilde {({\cdot })}+({\cdot })''$, for Reynolds or Favre averages and fluctuations, is used throughout the paper.
Incompressible flow data, both for channels (Lee & Moser Reference Lee and Moser2015) and zero-pressure- gradient (ZPG) boundary layers (Schlatter et al. Reference Schlatter, Li, Brethouwer, Johansson and Henningson2010), reveal (Panton et al. Reference Panton, Lee and Moser2017) a reasonably robust inner law (near-wall behaviour) for the  $p'^+_{rms}(y^+)$ profiles, with a peak (local maximum) $[p'_{rms}]^+_{PEAK}$ around $28\lessapprox y^+_{p'_{PEAK}}\lessapprox 32$ (depending on $Re_{\tau _w}$), and a lower level $[p'_{rms}]^+_w$ at the wall ( $p'_{rms}$ is nearly constant very near the wall, for $y^+\lessapprox 5$). It is believed (Kim & Hussain Reference Kim and Hussain1993) that very near the wall ( $y^+\lessapprox 5$) turbulent perturbations essentially propagate with $y$-independent velocity, and frozen-wave estimates (del Álamo & Jiménez Reference del Álamo and Jiménez2009) in compressible turbulent boundary layers (TBLs) (Zhang, Duan & Choudhari Reference Zhang, Duan and Choudhari2017) suggest that this is also the case in compressible wall turbulence.
The detailed investigation by Bernardini & Pirozzoli (Reference Bernardini and Pirozzoli2011) of  $2\leqslant M_\infty \leqslant 4$ ZPG TBLs over an adiabatic wall (more precisely an isothermal wall at the adiabatic-wall recovery temperature $T_w = T_r$) does not indicate substantial changes in the near-wall $p'^+_{rms}(y^+)$ profiles. Nonetheless, careful examination of the data indicates that small changes do occur, both $[p'_{rms}]^+_w$ and $[p'_{rms}]^+_{PEAK}$ slightly increasing with $\bar {M}_{\delta _x}$. This very-near-wall behaviour is also observed in compressible turbulent plane channel (TPC) flow, already at much lower $\bar {M}_{{CL}_x}$ (Gerolymos & Vallet Reference Gerolymos and Vallet2014; Modesti & Pirozzoli Reference Modesti and Pirozzoli2016; Tang et al. Reference Tang, Zhao, Wan and Liu2020). At $(Re_{\tau ^\star },\bar {M}_{{CL}_x}) = (113,2.49)$, $[p'_{rms}]^+_w$ is already higher than $[p'_{rms}]^+_{PEAK}$ (Gerolymos & Vallet Reference Gerolymos and Vallet2014; Tang et al. Reference Tang, Zhao, Wan and Liu2020). In contrary to adiabatic-wall ZPG TBL studies (Bernardini & Pirozzoli Reference Bernardini and Pirozzoli2011) the wall is increasingly colder with increasing $\bar {M}_{{CL}_x}$ in TPC flows (Coleman, Kim & Moser Reference Coleman, Kim and Moser1995; Gerolymos & Vallet Reference Gerolymos and Vallet2014), resulting in lower sound-speed near the wall compared with the centreline, and consequently to higher $\bar {M}_x/\bar {M}_{{CL}_x}$ near the wall compared with adiabatic-wall ZPG TBLs. This effect of wall temperature was demonstrated by Zhang et al. (Reference Zhang, Duan and Choudhari2017) who studied the effect of $\bar {T}_w/T_r\in \{1,0.76,0.25\}$ in a $M_\infty = 5.86$ ZPG TBL. As $\bar {T}_w/T_r$ decreases (colder wall) the wall-to-peak ratio $[p'_{rms}]_w/[p'_{rms}]_{PEAK}$ increases to reach ${\sim }\tfrac {3}{2}$ at $\bar {T}_w/T_r = 0.25$ (Zhang et al. Reference Zhang, Duan and Choudhari2017). The major influence of $\bar {T}_w/T_r$ at constant $\bar {M}_{{CL}_x}$ has also been demonstrated for TPC flow by Yu & Xu (Reference Yu and Xu2021) who added an artificial sink term (cooling) in the energy equation (Yu, Xu & Pirozzoli Reference Yu, Xu and Pirozzoli2020), thus controlling the ratio $\bar {T}_w/T_r$, following the approach used by Coleman et al. (Reference Coleman, Kim and Moser1995) to create an equivalent artificial flow without temperature stratification.
These important changes of the  $p'_{rms}(y)$ profiles very near the wall, with increasing Mach number ( $\bar {M}_{{CL}_x}$ or $\bar {M}_{\delta _x}$) and/or decreasing $\bar {T}_w/T_r$ (colder wall) are obviously the footprint of changes in the very-near-wall turbulence structure. Coleman et al. (Reference Coleman, Kim and Moser1995) who were the first to study the canonical compressible TPC flow, observed increased streamwise coherence of the near-wall streaks with increasing $\bar {M}_{{CL}_x}$, inducing increased mean shear $\partial _y\bar u$ because of stronger $\{\rho,T\}$-stratification of the near-wall region (demonstrated by simulating an artificial flow without the viscous heating term $\overline {\tau _{ij}S_{ij}}$ in the static temperature equation thus recovering the incompressible flow spanwise coherence and changing the near-wall sign of correlation coefficient $c_{\rho 'T'} < 0$ back to $c_{\rho 'T'} > 0$). They also discussed the possibility to consider the (high/low)-speed regions of the near-wall flow as ‘variable density mixing layer(s) at the edge of a cold low-speed streak $\dots$ governed by the same dynamics responsible for the reduced spreading rate of compressible mixing layers (Papamoschou & Roshko Reference Papamoschou and Roshko1988) $\dots$ for convective Mach number $M_c>0.5$’. Coleman et al. (Reference Coleman, Kim and Moser1995) considered that observed $M_c$ were too weak to induce such compressibility effects, without however detailing how $M_c$ is defined with respect to the observed coherent structures and the wall proximity.
Tang et al. (Reference Tang, Zhao, Wan and Liu2020) compared two TPC flows, at  $(Re_{\tau ^\star },\bar {M}_{{CL}_x})\in \{(110,2.39),(340,1.50)\}$, to investigate compressibility effects on $p'$. Following Sarkar (Reference Sarkar1992) they used the compressible Poisson equation for $p'$ (Sarkar Reference Sarkar1992; Foysi, Sarkar & Friedrich Reference Foysi, Sarkar and Friedrich2004; Gerolymos, Sénéchal & Vallet Reference Gerolymos, Sénéchal and Vallet2013) to split $p' = p'_{(r)} + p'_{(s)} + p'_{(\tau ){inc}} + p'_{(c)}$ into slow ( $p'_{(s)}$), rapid ( $p'_{(r)}$), incompressible Stokes ( $p'_{(\tau ){inc}}$) and the remainder identified as the compressible contribution ${p'_{(c)}}$ (Sarkar Reference Sarkar1992). In compressible flow the source term for the Stokes term $Q'_{(\tau )} \neq 0$ (Foysi et al. Reference Foysi, Sarkar and Friedrich2004; Gerolymos et al. Reference Gerolymos, Sénéchal and Vallet2013), in contrast to the calculated $p'_{(\tau ){inc}}$. There was therefore a part of Stokes $p'_{(\tau )}$ included in the compressible
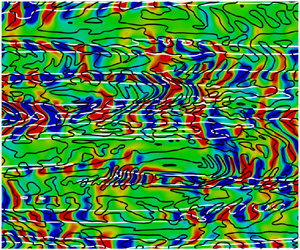
  $p'_{(c)}$. The instantaneous $p'$-fields revealed fundamental changes between the $\bar {M}_{{CL}_x} = 1.50$ case and the higher $\bar {M}_{{CL}_x} = 2.39$ flow, with the appearance at $\bar {M}_{{CL}_x} = 2.39$ of alternating $( + / - )$- $p'$ structures, essentially located inside the low-speed streaks. These $( + / - )$- $p'$ structures were further identified (Tang et al. Reference Tang, Zhao, Wan and Liu2020) in linearised mode analyses, were associated to the observed differences (with increasing $\bar {M}_{{CL}_x}$) in wavenumber and frequency spectra, and were shown to be the result of the compressible mechanism $p'_{(c)}$ which increased substantially compared with the other mechanisms (Tang et al. Reference Tang, Zhao, Wan and Liu2020). These $( + / - )$- $p'$ structures are related with the significant dilatational perturbations focused along the cold slow-sound-velocity low-speed streaks possibly acting as acoustic waveguides (Coleman et al. Reference Coleman, Kim and Moser1995).
Yu, Xu & Pirozzoli (Reference Yu, Xu and Pirozzoli2019) opted for the kinematic decomposition of the velocity field  $u_i = u_{\omega _i} + u_{\varTheta _i}$, into a solenoidal part induced by the instantaneous vorticity distribution $\omega _i := \epsilon _{ijk}\partial _{x_j}u_k$ and an irrotational part induced by the instantaneous dilatation distribution $\varTheta := \partial _{x_k}u_k$ (Batchelor Reference Batchelor1967, pp. 84–87), to study the effects of $0 < \bar {M}_{{CL}_x} \leqslant 6.97$ (including an incompressible DNS) and of the wall-to-recovery temperature ratio $\bar {T}_w/T_r$, where $T_r$ is the adiabatic wall recovery temperature (van Driest Reference van Driest1951). The ratio $\bar {T}_w/T_r$ was adjusted (Yu et al. Reference Yu, Xu and Pirozzoli2019) by an artificial sink term (cooling) in the energy equation, in line with the study on temperature stratification effects in Coleman et al. (Reference Coleman, Kim and Moser1995). Instantaneous X-rays, at $y^+ = 15$, of the fluctuating velocity fields, at $(\bar {M}_{{CL}_x},Re_{\tau _w},\bar {T}_w/T_r) \approxeq (3.48,494,0.5)$, revealed the presence of alternating $( + / - )$- $u_\varTheta ''$ patterns along the near-wall streaks, ‘probably interpretable as traveling wave packets’ (Yu et al. Reference Yu, Xu and Pirozzoli2019). Yu et al. (Reference Yu, Xu and Pirozzoli2020) combined the $p' = p'_{(r)} + p'_{(s)} + p'_{(\tau )} + p'_{(c)}$ splitting (using the compressible $Q'_{(\tau )}\neq 0$) with the $u_i = u_{\omega _i} + u_{\varTheta _i}$ splitting of the velocity field, showing that the increase in $p'_{rms}$ near the wall is associated with similar increases in $[p'_{(c)}]_{rms}$ and $[p'_{(\tau )}]_{rms}$, whereas the rapid $[p'_{(r)}]_{rms}$ and slow $[p'_{(s)}]_{rms}$ profiles remained practically unaffected by compressiblity effects.
These studies (Tang et al. Reference Tang, Zhao, Wan and Liu2020; Yu et al. Reference Yu, Xu and Pirozzoli2019, Reference Yu, Xu and Pirozzoli2020; Yu & Xu Reference Yu and Xu2021) clearly correlate the modification, under the synergetic effect of increasing  $\bar {M}_{{CL}_x}$ ( $\bar {M}_{\delta _x}$) and decreasing $\bar {T}_w/T_r$, of the near-wall $p'_{rms}$ profile, to the increase of $p'_{(c)}$. Another indication of the inception of compressibility effects in the near-wall region is the breakdown (or rather the increasing approximation error) of the linear approximations of thermodynamic correlations obtained by truncating the exact expressions implied by the fluctuating equation-of-state (EoS) (Gerolymos & Vallet Reference Gerolymos and Vallet2018).
In previous work (Gerolymos & Vallet Reference Gerolymos and Vallet2014, Reference Gerolymos and Vallet2018) the simultaneous variation of both  $(Re_{\tau ^\star },\bar {M}_{{CL}_x})$ in the database hindered the unambiguous identification of the effect of each parameter. For this reason we constructed a $(Re_{\tau ^\star },\bar {M}_{{CL}_x})$-matrix database. The other important parameter in wall turbulence, namely $\bar {T}_w/T_r$, is not controlled in the present simulations of canonical compressible TPC flow (Coleman et al. Reference Coleman, Kim and Moser1995), but depends on $(Re_{\tau ^\star },\bar {M}_{{CL}_x})$, because there is no artificial source term in the energy equation. The wall gets increasingly colder with increasing $\bar {M}_{{CL}_x}$. Although closer-to-adiabatic wall-temperature conditions are relevant in practical high-Mach-number applications (Zhang et al. Reference Zhang, Duan and Choudhari2017) TPC flow data are particularly useful for the study of thermodynamic turbulence structure (Gerolymos & Vallet Reference Gerolymos and Vallet2018) and the transport of thermodynamic quantities in the inner layer (Gerolymos & Vallet Reference Gerolymos and Vallet2014) including temperature (Bowersox Reference Bowersox2009), especially as the exact streamwise invariance of the flow allows, via streamwise averaging, for much larger statistical samples in a given observation time.
The purpose of the paper is to study the effects of  $(Re_{\tau ^\star },\bar {M}_{{CL}_x})$ on the fluctuating pressure field $p'$, and to identify similarities and differences with incompressible flow data. We use the term compressible in a generic sense, making no distinction between mean flow stratification effects (Morkovin Reference Morkovin1962) or compressible turbulence effects directly related to the fluctuating density $\rho '$ (Gerolymos & Vallet Reference Gerolymos and Vallet2014, Reference Gerolymos and Vallet2018) either via the compressible terms in the Poisson equation for fluctuating pressure $p'$ (Pantano & Sarkar Reference Pantano and Sarkar2002; Foysi et al. Reference Foysi, Sarkar and Friedrich2004; Tang et al. Reference Tang, Zhao, Wan and Liu2020) or identified in relation to the dilatation-induced velocity (Yu et al. Reference Yu, Xu and Pirozzoli2019). In § 2, we briefly describe the construction of the database, summarize available data and introduce the three systems of units (defining the non-dimensionalisation scales) used in the paper. In § 3, we study the root-mean-square (r.m.s.) level of the fluctuating pressure, $p'_{rms} := \surd (\overline {p'p'})$ and pressure–velocity correlation coefficient $\{c_{p'u'},c_{p'v'}\}$, clearly identifying the near-wall region (roughly $y^\star \lessapprox 15$) as the principal location of strong $(\bar {M}_{{CL}_x} \gtrapprox 2)$ effects. We also determine an empirical correlation highlighting the dependence of $[p'_{rms}]_w$ on the three parameters $(Re_{\tau ^\ddagger },\bar {M}_{{CL}_x},T_r/\bar {T}_w)$. In § 4, we investigate coherent structures in the near-wall region, focussing first (§ 4.1) on the $\bar {M}_{{CL}_x}$-scaling of the average spanwise distance between streaks (more precisely of its surrogate defined by the spanwise correlations of the streamwise velocity), leading to the choice of the appropriate non-dimensionalisation. These new length-units correct the deficiency of HCB-length-units near the wall and are nearly identical to HCB-length-units further away from the wall. In § 4.2, we use the in-plane Laplacian $\nabla ^2_{xz}p'$ to identify ( $+ / -$)- $p'$ fronts ( $\nabla ^2_{xz}p' = 0$) and in § 4.3, we discuss the collocation of these fronts with the extrema of wall-normal velocity fluctuation $v'$ (or, equivalently, of wall-normal Mach number $M'_y := (v/a)'$) and the structural modifications observed, with increasing $\bar {M}_{{CL}_x}$, in the joint probability density functions (p.d.f.s) of $p'$ versus the fluctuating velocity components $u_i'$ (which explain the very strong near-wall $\bar {M}_{{CL}_x}$ effect on the correlation coefficient $c_{p'v'}$). Finally, in § 5, we present the conclusions of the present work and discuss directions for future research.
2.  $(Re_{\tau ^\star },\bar {M}_{{CL}_x})$-scalings and database

Compressible TPC flow between two isothermal walls (Coleman et al. Reference Coleman, Kim and Moser1995) is characterised by mean temperature stratification, which strongly increases with increasing Mach number (figure 1), because of viscous heating  $\overline {S_{ij}\tau _{ij}}$, especially near the wall (Coleman et al. Reference Coleman, Kim and Moser1995). Mean pressure $\bar {p}(y) = \bar {p}_w - \overline {\rho v''v''}$ (under the condition of streamwise invariance in the mean of plane compressible turbulent channel flow) varies little across the channel (increasingly so with increasing $\bar {M}_{{CL}_x}$, but never exceeding $3\,\%$; figure 1). Therefore, because of the perfect gas EoS $p = \rho R_gT \implies \bar {p} = \bar {\rho } R_g\tilde {T}$, density $\bar {\rho }(y)$ varies almost inversely proportionally to temperature $\tilde {T}(y)$. Finally, dynamic viscosity $\bar {\mu }(y)$, being a function of temperature (Gerolymos & Vallet Reference Gerolymos and Vallet2014, (2.1), p. 706), varies in the same way as $\tilde {T}(y)$ but with a lower exponent (figure 1).

Figure 1. Wall-normal variation of mean thermodynamic variables  $\{\bar {p},\bar {\rho },\tilde {T},\bar {\mu }\}$ with respect to their wall values, plotted against the HCB-scaled non-dimensional distance from the wall $y^\star$ (2.1b), for varying centreline Mach number (2.4) $0.32 \leqslant \bar {M}_{{CL}_x} \leqslant 2.49$ ( $\bar {M}_{{CL}_x}$-based line types are used for $\bar {p}(y)$) and HCB friction Reynolds number (2.1b) $73 \leqslant Re_{\tau ^\star } \leqslant 983$ ( $Re_{\tau ^\star }$-based line types are used for $\{\bar {\rho }(y),\tilde {T}(y),\bar {\mu }(y)\}$), from the present database (table 1).
2.1. Wall-units and mixed scalings
Because of this  $\{\bar {\rho },\tilde {T}, \bar {\mu }\}$-stratification (figure 1), Huang, Coleman & Bradshaw (Reference Huang, Coleman and Bradshaw1995) realised that the standard wall-units inherited by incompressible flow analyses
 \begin{equation} (\cdot)^+\ \text{units: } \{\bar{\tau}_w,\bar{\mu}_w,\bar{\rho}_w\}\implies y^+:=\dfrac{\bar{\rho}_w} {\bar{\mu}_w}\sqrt{\dfrac{\bar{\tau}_w}{\bar{\rho}_w}}(y-y_w);\quad Re_{\tau_w}:=\delta^+ \end{equation}
fail to correctly represent the major part of the flow, and suggested an alternative  $y$-variable scaling which replaces $\{\bar {\mu }_w,\bar {\rho }_w\}$ by their local values
 \begin{equation} (\cdot)^\star\ \text{units: } \{\bar{\tau}_w,\bar{\mu}(y),\bar{\rho}(y)\}\implies y^\star:=\dfrac{\bar{\rho}(y)}{\bar{\mu}(y)}\sqrt{\dfrac{\bar{\tau}_w}{\bar{\rho}(y)}}(y-y_w);\quad Re_{\tau^\star}:=\delta^\star. \end{equation}
This HCB friction Reynolds number  $Re_{\tau ^\star }$ (2.1b) is the appropriate parameter determining the peak value of the shear Reynolds stress $-\overline {\rho u''v''}$ (Huang et al. Reference Huang, Coleman and Bradshaw1995) and is generally accepted as the representative Reynolds number for compressible TPC flow (Trettel & Larsson Reference Trettel and Larsson2016). However, both scalings (2.1a), (2.1b) become identical at the wall and, in general, neither is well adapted in the near-wall region $y^\star \lessapprox 10$. In that region, $(\cdot )^\star$-units vary rapidly in the wall-normal direction because of the strong temperature gradient (figure 1). The drawback of this rapid variation was particularly felt in the present work while studying the near-wall pressure field in relation with the near-wall low-speed streaks (§ 4.1). It is shown that, for a given flow defined by the couple $(Re_{\tau ^\star },\bar {M}_{{CL}_x})$, the average spanwise distance between streaks $\varLambda _{S}^{ ( z )}$ is practically $y$-independent in the near-wall region $y^\star \lessapprox 10$, so that studying the velocity and pressure fields in $(x^\star,z^\star )$ planes would misleadingly suggest strong $y$-normal variations in $(\cdot )^\star$-units (2.1b). On the other hand, it was also found that standard $(\cdot )^+$-units (2.1a) are completely inadequate in comparing results for different $\bar {M}_{{CL}_x}$ at constant $Re_{\tau ^\star }$. Noting that the strong variation of mean-flow properties essentially occurs in the region $y^\star \lessapprox 15$, we found that an alternative $y$-constant scaling which uses centreline thermodynamic properties $\{\bar {\mu }_{CL},\rho _{CL}\}$ everywhere performed better. In the TPC case, $\max _y \bar {T} = \bar {T}_{CL}$ occurs at the centreline, with monotonic decrease towards the wall (figure 1). On the other hand, in the case of adiabatic-wall ZPG TBLs, where $\max _y\bar {T} = \bar {T}_w$ occurs at the wall, with monotonic decrease towards the boundary-layer edge, standard wall-units (2.1a) perform quite well (Bernardini & Pirozzoli Reference Bernardini and Pirozzoli2011; Zhang et al. Reference Zhang, Duan and Choudhari2017). Both these choices can be accommodated, for the entire cold-wall range $\bar {T}_w/T_r\leqslant 1$, by
 \begin{equation} (\cdot)^\ddagger\ \text{units: } \left\{\bar{\tau}_w,\max_y\bar{\mu},\min_y\bar{\rho}\right\} \implies y^\ddagger:=\dfrac{\min_y\bar{\rho}}{\max_y\bar{\mu}}\sqrt{\dfrac{\bar{\tau}_w}{\min_y\bar{\rho}}}(y-y_w);\quad Re_{\tau^\ddagger}:=\delta^\ddagger. \end{equation}
Obviously, for TPC (2.2a) or adiabatic-wall conditions (2.2b)
 $$\begin{gather} \left(\max_y\bar{\mu},\min_y\bar{\rho}\right)=(\bar{\mu}_{CL},\bar{\rho}_{CL}) \stackrel{(2.1b),~(2.1c)}{\implies} \quad \delta^\ddagger = \delta^\star\iff Re_{\tau^\ddagger}= Re_{\tau^\star}, \end{gather}$$
 $$\begin{gather}\left(\max_y\bar{\mu},\min_y\bar{\rho}\right)=(\bar{\mu}_w ,\bar{\rho}_w) \stackrel{(2.1a),~(2.1c)}{\implies} \quad \delta^\ddagger = \delta^+ \iff Re_{\tau^\ddagger}= Re_{\tau_w}. \end{gather}$$
Therefore, this  $y$-independent system of mixed (friction/thermodynamics) scaling (2.1c) $(\cdot )^\ddagger$-units retains $(Re_{\tau ^\star },\bar {M}_{{CL}_x})$ as global flow parameters in canonical compressible TPC flow (2.2a). This point is discussed further in (§ 4).
Note that the unit for  $p$ is $\bar {\tau }_w$ in all of these systems (2.1), i.e.
 \begin{equation} (\mbox{2.1})\implies p^\ddagger \equiv p^\star \equiv p^+:=\dfrac{p}{\bar{\tau}_w}{.} \end{equation}
2.2. Computational method and statistics
The computations were run using a very-high-order  $O(\Delta \ell ^{17})$ upwind-biased scheme (Gerolymos, Sénéchal & Vallet Reference Gerolymos, Sénéchal and Vallet2009), implemented in a DNS solver (Gerolymos, Sénéchal & Vallet Reference Gerolymos, Sénéchal and Vallet2010) which has been validated extensively in previous compressible (Gerolymos & Vallet Reference Gerolymos and Vallet2014, Reference Gerolymos and Vallet2018) and low- $\bar {M}_{{CL}_x}$ (Gerolymos et al. Reference Gerolymos, Sénéchal and Vallet2013; Gerolymos & Vallet Reference Gerolymos and Vallet2016, Reference Gerolymos and Vallet2019) work, by comparison with standard DNS data (Coleman et al. Reference Coleman, Kim and Moser1995; Moser, Kim & Mansour Reference Moser, Kim and Mansour1999; Foysi et al. Reference Foysi, Sarkar and Friedrich2004; Vreman & Kuerten Reference Vreman and Kuerten2014), including spectra (Gerolymos et al. Reference Gerolymos, Sénéchal and Vallet2010) and higher-order-derivatives dissipation statistics (Gerolymos & Vallet Reference Gerolymos and Vallet2016).
The computational box was  $L_x=8{\rm \pi} \delta$ long in the streamwise direction and $L_z=4{\rm \pi} \delta$ wide in the spanwise direction ( $\delta$ is the channel half-height), which is in the upper range of DNS computational domains for channel flow both compressible (Modesti & Pirozzoli Reference Modesti and Pirozzoli2016; Trettel & Larsson Reference Trettel and Larsson2016; Tang et al. Reference Tang, Zhao, Wan and Liu2020; Yu et al. Reference Yu, Xu and Pirozzoli2019, Reference Yu, Xu and Pirozzoli2020; Yu & Xu Reference Yu and Xu2021) and incompressible (Kim, Moin & Moser Reference Kim, Moin and Moser1987; Moser et al. Reference Moser, Kim and Mansour1999; Hu & Sandham Reference Hu and Sandham2001; Hoyas & Jiménez Reference Hoyas and Jiménez2006; Lee & Moser Reference Lee and Moser2015; Hoyas et al. Reference Hoyas, Oberlack, Alcántara-Ávila, Kraheberger and Laux2022). Computational resolution in wall-units (table 1) is typical of compressible TPC flow DNS computations, in line with grid-resolution studies (Gerolymos et al. Reference Gerolymos, Sénéchal and Vallet2010; Modesti & Pirozzoli Reference Modesti and Pirozzoli2016; Trettel & Larsson Reference Trettel and Larsson2016).
Table 1. Parameters of the DNS computations:  $L_x$, $L_y$, $L_z$ ( $N_x$, $N_y$, $N_z$) are the dimensions (number of grid points) of the computational domain ( $x=$ homogeneous streamwise, $y=$ wall-normal, $z=$ homogeneous spanwise direction); $u$,
$u$,  $v$,
$v$,  $w$ are the velocity components along $x$,
$x$,  $y$,
$y$,  $z$;
$z$;  $\delta$ is the channel half-height; $\Delta x^+$, $\Delta y_w^+$, $\Delta y_{CL}^+$, $\Delta z^+$ are the mesh sizes in wall-units (2.1a); $(\cdot )_w$ denotes wall and $(\cdot )_{CL}$ centreline values; $N_{y^+\leqslant 10}$ is the number of grid points between the wall and $y^+=10$; $Re_{\tau ^\star }$ is the friction Reynolds number in HCB scaling (2.1b); $\bar {M}_{{CL}_x}$ is the centreline Mach number (2.4); $Re_{\tau _w}$ is the friction Reynolds number (2.1a); $M_{{B}_w}$ is the bulk Mach number at wall sound speed (§ 2.3); $\varDelta t^+$ is the computational time step in wall-units; $t_{OBS}^+$ is the observation interval in wall-units over which single-point statistics were computed; $\Delta t_s^+$ is the sampling time step for the single-point statistics in wall-units.

Some early computations in the database (Gerolymos & Vallet Reference Gerolymos and Vallet2014, Reference Gerolymos and Vallet2018) were initialised following the procedure described in Gerolymos et al. (Reference Gerolymos, Sénéchal and Vallet2010, (44), p. 790). However, most of the computations were initialised by thermodynamic rescaling and linear interpolation of an instantaneous turbulent flow field at different  $(Re_{\tau ^\star },\bar {M}_{{CL}_x})$-conditions.
Computational experience shows that  $p'_{rms}$ reaches statistical convergence much slower than velocity covariances and other statistics. For this reason we were particularly careful to allow for a sufficiently long transient $t_{CNVRG}$. Upon reaching a statistically converged state, after the initial transient, single-point statistics were acquired at each time step and sampled over several thousands of time wall-units (table 1). For the $(Re_{\tau ^\star },\bar {M}_{{CL}_x}) = (965,1.50)$ flow, initialised from a statistically converged coarse-grid flow field, after a transient of $t^+_{CNVRG} = 9853$ ( $t_{CNVRG}\tilde u_{CL}/\delta = 180$), statistics were acquired for an additional $t^+_{OBS} = 5346$ ( $t_{OBS}\tilde u_{CL}/\delta = 98$).
Air thermodynamics were approximated by a perfect gas EoS with Sutherland laws for viscosity and heat conductivity (Gerolymos & Vallet Reference Gerolymos and Vallet2014, (2.1), p. 706). van Driest (Reference van Driest1951, figure 17, p. 157) highlights the overestimation of dynamic viscosity at high temperatures when using a power law in lieu of the more accurate Sutherland's law. Since temperature stratification is induced by viscous heating  $\overline {S_{ij}\tau _{ij}}$ (Coleman et al. Reference Coleman, Kim and Moser1995) there are small differences at high $\bar {M}_{{CL}_x}$ in centreline-to-wall temperature ratio $\tilde {T}_{CL}/T_w$ and in the $M_{{B}_w}(Re_{\tau ^\star },\bar {M}_{{CL}_x})$ relation between DNS data using different laws for viscosity. This observation not withstanding, the present results using Sutherland's law are in very good agreement with the $p'_{rms}$ data of Modesti & Pirozzoli (Reference Modesti and Pirozzoli2016) who used a power law, for flows at similar $(Re_{\tau ^\star },\bar {M}_{{CL}_x})$ conditions.
2.3. Database
The target during the construction of the database was to obtain a matrix of  $(Re_{\tau ^\star },\bar {M}_{{CL}_x})$ values, where $Re_{\tau ^\star }$ is the HCB friction Reynolds number (2.1b) and
 \begin{equation} \bar{M}_{{CL}_x}:=\overline{\left(\dfrac{u_{CL}}{a_{CL}}\right)} \end{equation}
is the average streamwise centreline Mach number. Note that the often used approximations  $\bar {M}_{CL} \approxeq \bar {M}_{{CL}_x} \approxeq \tilde {u}_{CL}/a(\tilde {T}_{CL})$ are confirmed by the data with good accuracy because $v_{CL} \ll u_{CL} \gg w_{CL}$ and $(T'_{rms}/\bar {T})_{CL} \lll 1$. We use the exact average (2.4) in our work.
In general,  $Re_{\tau ^\star }$ is adopted by workers in the field (§ 2.1), because it is the proper parameter for the scaling of the Reynolds shear stress $-\overline {\rho u''v''}$ and, hence, controls the mean velocity $\tilde u$ profile (Trettel & Larsson Reference Trettel and Larsson2016). We chose the centreline Mach number $\bar {M}_{{CL}_x}$ for the matrix construction because it allows comparison with boundary-layer data which are always referenced to the external flow Mach number, and because its physical significance is clear. Furthermore the coefficients of variation ${CV}_{({\cdot })'} := ({\cdot })'_{rms}/\overline {({\cdot })}$ of the thermodynamic fluctuations $\{p',\rho ',T',s'\}$ scale with $\bar {M}_{{CL}_x}^2$ (Gerolymos & Vallet Reference Gerolymos and Vallet2014, Reference Gerolymos and Vallet2018).
Neither  $Re_{\tau ^\star }$ nor $\bar {M}_{{CL}_x}$ are fixed in the computations, the flow conditions being determined by the set $\{\rho _{B}, \dot {m}_{B}, \bar {T}_w\}$ (Gerolymos et al. Reference Gerolymos, Sénéchal and Vallet2010), where $\rho _{B} := \bar {\rho }^{xyzt}$ is the bulk density, $\dot {m}_{B} := L_yL_z\rho _{B} u_{B} := L_yL_z\overline {\rho u}^{xyzt}$ is the mass flow, and $T_w = {\rm const.}$ is the wall temperature (as a consequence the bulk-wall Mach number $M_{{B}_w} := u_{B}/\bar {a}_w$ is fixed).
However, we took particular care in the construction of the database to obtain the closest possible target  $\bar {M}_{{CL}_x}\in \{0.33,0.80,1.50,2.00\}$ and $Re_{\tau ^\star }\in \{75,100,110,250,340,1000\}$ (table 1). The cost of the computations strongly increases with $\bar {M}_{{CL}_x}$ if nearly constant resolution in standard wall-units is sought (this is the most stringent resolution assessment), as a result of the rapid increase of the ratio $Re_{\tau _w}/Re_{\tau ^\star }$ with increasing $\bar {M}_{{CL}_x}$. This new database (table 1) extends available data at $\bar {M}_{{CL}_x} \in \{0.8,1.5\}$ to higher $Re_{\tau ^\star } \approxeq 1000$, which to the best of the authors' knowledge is the highest reported $Re_{\tau ^\star }$ for compressible TPC flow.
3. ${p'^+_{rms}}$ scaling

It is well established that  $[p'_{rms}]_w^+ := \surd (\overline {p'p'})^+_w$ increases with $Re_{\tau _w}$ both for incompressible (Panton et al. Reference Panton, Lee and Moser2017; Chen & Sreenivasan Reference Chen and Sreenivasan2022) and supersonic (Bernardini & Pirozzoli Reference Bernardini and Pirozzoli2011) wall turbulence. On the other hand, at constant $Re_{\tau ^\star }$, the coefficient of variation $({CV}_{p'})_w := (p'_{rms}/\bar p)_w$ scales approximately with $\bar {M}^2_{{CL}_x}$ in compressible TPC flow (Gerolymos & Vallet Reference Gerolymos and Vallet2014, Reference Gerolymos and Vallet2018). We concentrate in § 3 on the combined $(Re_{\tau ^\star },\bar {M}_{{CL}_x})$ effect on $p'$, and in § 3.4 we attempt to identify independently the relative importance of Mach number $\bar {M}_{{CL}_x}$ and wall cooling $T_r/\bar {T}_w$.
3.1. Wall-pressure-fluctuation amplitude
When plotting (figure 2) the compressible data vs  $Re_{\tau _w}$ (2.1a) we observe similar curves for different $\bar {M}_{{CL}_x}$, shifted towards lower levels of $[p'_{rms}]_w^+$ with increasing $\bar {M}_{{CL}_x}$, highlighting a distinct $\bar {M}_{{CL}_x}$-dependence. Using instead the HCB friction Reynolds number $Re_{\tau ^\star }$ (2.1b) clusters the data much closer together (figure 2). Nonetheless, careful observation shows that there remains a weak $\bar {M}_{{CL}_x}$-dependence, which appears clearly when plotting the data for different nearly constant $Re_{\tau ^\star }$ versus $\bar {M}_{{CL}_x}$ (figure 2). At constant $Re_{\tau ^\star }$, $[p'_{rms}]_w^+$ slightly increases with increasing $\bar {M}_{{CL}_x}$, relative to the incompressible flow limit ( $\bar {M}_{{CL}_x}\to 0$) level (figure 2).

Figure 2. Wall pressure fluctuation r.m.s.  $[p'_{rms}]_w^+$, in wall-units (2.3), plotted against the friction Reynolds numbers $Re_{\tau _w}$ (2.1a) and $Re_{\tau ^\star }$ (2.1b), for varying Mach numbers $0.32 \leqslant \bar {M}_{{CL}_x} \leqslant 2.49$, and against the centreline Mach number $\bar {M}_{{CL}_x}$ (2.4), for varying Reynolds numbers $66 \leqslant Re_{\tau ^\star } \leqslant 983$, from the present database (table 1); also included are incompressible DNS data (Kim et al. Reference Kim, Moin and Moser1987; Moser et al. Reference Moser, Kim and Mansour1999; Hu & Sandham Reference Hu and Sandham2001; Hoyas & Jiménez Reference Hoyas and Jiménez2006; Lee & Moser Reference Lee and Moser2015; Hoyas et al. Reference Hoyas, Oberlack, Alcántara-Ávila, Kraheberger and Laux2022) and incompressible-flow correlation (Chen & Sreenivasan Reference Chen and Sreenivasan2022) using $Re_{\tau ^\star }$ (CS, 2022).
Carefully choosing the appropriate Reynolds and Mach number definitions, can only diminish the influence of one of the two parameters, but not altogether remove it: compressible TPC flow is biparametric.
3.2. ${p'}^+_{rms}$ profiles

The profiles of  $p'_{rms}$ at nearly constant $\bar {M}_{{CL}_x} \in \{0.33,0.80,1.50,2.00\}$ (figure 3) show an increase in the level of $p'$ with increasing $Re_{\tau ^\star }$, quite similar to the incompressible flow behaviour (Panton et al. Reference Panton, Lee and Moser2017; Chen & Sreenivasan Reference Chen and Sreenivasan2022). However, considering the effect of $\bar {M}_{{CL}_x}$ at nearly constant $Re_{\tau ^\star } \in \{100,110,250,340\}$ shows that in the near-wall region, which can be defined as $y^\star \lessapprox 15$, the level of $p'$ is strongly dependent on the Mach number.

Figure 3. Profiles of pressure-fluctuation r.m.s.  $p'_{rms}$, in wall-units (2.3), plotted against the HCB-scaled (2.1b) non-dimensional distance from the wall $y^\star$ (logscale), for varying $73 \leqslant Re_{\tau ^\star } \leqslant 965$ at nearly constant $\bar {M}_{{CL}_x} \in \{0.33,0.80,1.50, 2.00\}$ and for varying $0.32 \leqslant \bar {M}_{{CL}_x} \leqslant 2.49$ at nearly constant $Re_{\tau ^\star } \in \{100,110,250,340\}$ (also scaled by its peak value, $[p'_{rms}]_{PEAK}$ (3.1), for the different nearly constant $Re_{\tau ^\star }$), from the present DNS database (table 1).
At the incompressible flow limit, the maximal value of  $p'_{rms}$ is located in the range $29 \lessapprox y^\star \lessapprox 32$ (depending on the Reynolds number). We can define this peak value as a local maximum of the $p'_{rms}$ profile
 \begin{equation} [p'_{rms}]_{PEAK}^+:=\mathrm{local}\max_{y>0}{{p'}^+_{rms}}. \end{equation}
With increasing  $\bar {M}_{{CL}_x}$ the wall level $[p'_{rms}]_w$ increases relative to the peak $[p'_{rms}]_{PEAK}$. The data for $Re_{\tau ^\star } \approxeq 100$ show (figure 3) that at $\bar {M}_{{CL}_x} \approxeq 1.9$ the decrease from $[p'_{rms}]_{PEAK}$ to the wall ceases to be monotonic, but instead the profile forms a local minimum before increasing again towards the wall. This increase becomes more pronounced with increasing $\bar {M}_{{CL}_x}$ and, at $\bar {M}_{{CL}_x} \gtrapprox 2.3$, $[p'_{rms}]_w$ rises slightly higher than $[p'_{rms}]_{PEAK}$ (figure 3). For the case $(Re_{\tau ^\star },\bar {M}_{{CL}_x}) = (113,2.49)$ (figure 3) the wall level is clearly higher than the local maximum $[p'_{rms}]_{PEAK}$ (3.1). This $\bar {M}_{{CL}_x}$ effect is confirmed by the higher $Re_{\tau ^\star } \in \{250,341\}$ data (figure 3) which follow the same trend. The $p'_{rms}$ profiles are better understood by non-dimensionalising by the peak value $[p'_{rms}]_{PEAK}$ (3.1), thereby correcting for the slight scatter imparted to the data by the small variations of $Re_{\tau ^\star }$ around the nominal target values of $\{100,110,250,341\}$ (figure 3).
Note that the centreline region (figure 3) shows a consistent  $\bar {M}_{{CL}_x}$-effect, the centreline level $[p'_{rms}]_{CL}^+$ increasing with increasing $\bar {M}_{{CL}_x}$, at constant $Re_{\tau ^\star }$.
3.3. ${p'_{rms}}$ peak

The data for  $[p'_{rms}]_{PEAK}^+$ (figure 4), with varying $Re_{\tau ^\star }$ at different $\bar {M}_{{CL}_x}$, are quite close to the incompressible DNS data (indeed closer compared with $[p'_{rms}]_w^+$; figure 2). There is, at constant $Re_{\tau ^\star }$, a small decrease with $\bar {M}_{{CL}_x}$ (figure 4), but notably smaller than the $\bar {M}_{{CL}_x}$-dependence of the wall value $[p'_{rms}]_w^+$ (figure 2).

Figure 4. Peak value of pressure-fluctuation r.m.s.  $[p'_{rms}]_{PEAK}^+$ (3.1), in wall-units (2.3), plotted against $Re_{\tau ^\star }$ (2.1b), for varying $0.32 \leqslant \bar {M}_{{CL}_x} \leqslant 2.49$, and against $\bar {M}_{{CL}_x}$ (2.4), for varying $66 \leqslant Re_{\tau ^\star } \leqslant 983$, from the present database (table 1); also included are incompressible DNS data (Kim et al. Reference Kim, Moin and Moser1987; Moser et al. Reference Moser, Kim and Mansour1999; Hu & Sandham Reference Hu and Sandham2001; Hoyas & Jiménez Reference Hoyas and Jiménez2006; Lee & Moser Reference Lee and Moser2015) and incompressible-flow correlation (Chen & Sreenivasan Reference Chen and Sreenivasan2022) using $Re_{\tau ^\star }$ (CS, 2022).
The location of the peak
 \begin{equation} y^\star_{p'_{PEAK}}:=y^\star\big|_{[p'_{rms}]_{PEAK}} \end{equation}
was obtained by interpolating the discrete on-grid data by a degree-four polynomial in the neighbourhood of the discrete maximum, to avoid grid-dependent scatter ( $[p'_{rms}]_{PEAK}^+$ is the value of the interpolating polynomial at $y^\star _{p'{PEAK}}$).
The location of the peak  $y^\star _{p'{PEAK}}$ (3.2) varies both with $Re_{\tau ^\star }$ and $\bar {M}_{{CL}_x}$ (figure 5). The dependence on $Re_{\tau ^\star }$ is similar to that observed in the incompressible flow data (figure 5). In the transitional flow range $Re_{\tau ^\star } \lessapprox 100$ the peak moves away from the wall with increasing $Re_{\tau ^\star }$, reaching a local maximum around $100 \lessapprox Re_{\tau ^\star } \lessapprox 110$, i.e. at the $Re_{\tau ^\star }$-range which marks the end of transition. At higher $Re_{\tau ^\star }$, $y^\star _{p'{PEAK}}$ initially decreases towards a local minimum around $Re_{\tau ^\star } \approxeq 400$, to slowly increase again, possibly towards an asymptotic value (figure 5). The variation of $y^\star _{p'{PEAK}}$ vs $Re_{\tau ^\star }$ appears to be quite similar for different $\bar {M}_{{CL}_x}$ but shifted towards higher values with increasing $\bar {M}_{{CL}_x}$ (figure 5). The location of the peak $y^\star _{p'{PEAK}}$ (3.2) is much more sensitive to variations of $\bar {M}_{{CL}_x}$ than of $Re_{\tau ^\star }$ (figure 5). Note, however, that the $p'_{rms}$ profiles are quite flat in the neighbourhood of the peak (figure 3).

Figure 5. HCB-scaled (2.1b) non-dimensional distance from the wall of the  $p'_{rms}$ peak (3.1) location, $y^\star _{p'{PEAK}}$ (3.2), plotted against $Re_{\tau ^\star }$ (2.1b), for varying Mach numbers $0.32 \leqslant \bar {M}_{{CL}_x} \leqslant 2.49$ and against $\bar {M}_{{CL}_x}$ (2.4), for varying $66 \leqslant Re_{\tau ^\star } \leqslant 983$, from the present database (table 1); also included are incompressible DNS data (Kim et al. Reference Kim, Moin and Moser1987; Moser et al. Reference Moser, Kim and Mansour1999; Hu & Sandham Reference Hu and Sandham2001; Hoyas & Jiménez Reference Hoyas and Jiménez2006; Lee & Moser Reference Lee and Moser2015).
3.4. Relative importance of $T_r/\bar {T}_w$ and $\bar {M}_{{CL}_x}$ on the near-wall field


The data for the  $\bar {M}_{{CL}_x}$-dependance of $[p'_{rms}]_w^+$ (figure 2) reflect the combined influence of increasing Mach number $\bar {M}_{{CL}_x}$ and wall cooling $T_r/\bar {T}_w$, which increases very rapidly with $\bar {M}_{{CL}_x}$ in TPC where frictional heating can only be evacuated through the walls (figure 6). The data of Yu et al. (Reference Yu, Xu and Pirozzoli2020) with an artificial sink term in the energy equation extend the $\bar {M}_{{CL}_x}$ range with weakly cooled walls (figure 6).

Figure 6. Variation of wall-cooling ratio  $1< T_r/\bar {T}_w \lessapprox 7.35$ ( $0.136\lessapprox \bar {T}_w/T_r<1$) and centreline Mach number $0.32\lessapprox \bar {M}_{{CL}_x}\lessapprox 6.97$ for the present data (table 1) and for the Yu et al. (Reference Yu, Xu and Pirozzoli2019, Reference Yu, Xu and Pirozzoli2020) DNS data (YXP, 2020), for varying $66 \leqslant Re_{\tau ^\ddagger } \leqslant 983$.
A working correlation should be a function of the three parameters  $\{Re_{\tau ^\ddagger },\bar {M}_{{CL}_x},T_r/\bar {T}_w\}$. The correlation (figure 7)
 \begin{equation} [p'_{rms}]_w^+ = \underbrace{\left(4.4-10.5Re_{\tau^\ddagger}^{-{1}/{4}}\right)}_{[p'_{rms}]_{w, {INC}}^+(Re_{\tau^\ddagger})} \underbrace{\left(\dfrac{1+0.020\bar{M}_{{CL}_x}^2}{1+0.011\bar{M}_{{CL}_x}^2}\right)\left(1+ 0.020\left(\dfrac{T_r}{\bar{T}_w}-1\right)\right)}_{g_{p'_w}(\bar{M}_{{CL}_x},T_r/\bar{T}_w)} \end{equation}
scales the incompressible-flow correlation of Chen & Sreenivasan (Reference Chen and Sreenivasan2022)  $[p'_{rms}]_{w,{INC}}^+(Re_{\tau ^\ddagger })$ with a separable function $g_{p'_w}(\bar {M}_{{CL}_x},T_r/\bar {T}_w)=g_{M,p'_w}(\bar {M}_{{CL}_x})g_{T,p'_w}(T_r/\bar {T}_w)$. The choice of $Re_{\tau ^\ddagger }$ (2.1c) is made to bridge the present very-cold-wall TPC data with the mildly-cold-wall data of Yu et al. (Reference Yu, Xu and Pirozzoli2020), $\max _y \bar {T}$ progressively moving from the centreline towards the wall as adiabatic conditions are approached. The pure Mach-number effect $g_{M,p'_w}(\bar {M}_{{CL}_x})$ cannot be isolated from the available TPC data, and was instead evaluated from adiabatic TBL data (Bernardini & Pirozzoli Reference Bernardini and Pirozzoli2011), the rational function ensuring $\bar {M}_{{CL}_x}^2$-dependence at low-Mach conditions while avoiding unbounded increase at high-Mach conditions. Dividing the TPC data by $g_{M,p'_w}(\bar {M}_{{CL}_x})$ indicated a nearly linear trend with increasing wall cooling (with $\pm 5\,\%$ scatter), suggesting the form of $g_{T,p'_w}(T_r/\bar {T}_w)$. The final correlation (3.3) fits the available data reasonably well (figure 7). Although available data are limited regarding the independent effects of Mach number and wall cooling, the satisfactory collapse of the compressible data on the incompressible correlation supports the view that both effects are important, and both tend to increase $[p'_{rms}]_w^+$ relative to its incompressible-isothermal level at the same $Re_{\tau ^\ddagger }$.

Figure 7. Wall-pressure-fluctuation r.m.s.  $[p'_{rms}]_w^+$, in wall-units (2.3) and scaled by $g_{p'_w}(\bar {M}_{{CL}_x},T_r/\bar {T}_w)$ (3.3), plotted against the modified friction Reynolds number $66 \leqslant Re_{\tau ^\star } \leqslant 983$ (2.1c), for varying Mach numbers $0.32 \leqslant \bar {M}_{{CL}_x} \leqslant 6.97$ and wall-cooling ratio $1< T_r/\bar {T}_w \lessapprox 7.35$ ( $0.136\lessapprox \bar {T}_w/T_r<1$), from the present database (table 1) and for the Yu et al. (Reference Yu, Xu and Pirozzoli2019, Reference Yu, Xu and Pirozzoli2020) DNS data (YXP, 2020); also included is incompressible-flow correlation (Chen & Sreenivasan Reference Chen and Sreenivasan2022) using $Re_{\tau ^\ddagger }$ (CS, 2022).
Regarding the data of Yu et al. (Reference Yu, Xu and Pirozzoli2020) the actual  $T_r:=\bar {T}_{CL}(1+r_f(({\gamma -1})/{2})\bar {M}_{{CL}_x}^2)$ of the statistically converged flow was used (the tabulated data refer to $T_r$ of a virtual flow used for the initialisation and boundary conditions).
3.5. Pressure–velocity correlations
Modifications of near-wall turbulence structure (Bradshaw Reference Bradshaw1977) associated with these  $\bar {M}_{{CL}_x}$-effects on $p'_{rms}$ (§ 3) can be assessed by considering correlation coefficients between fluctuating pressure and velocity components
 \begin{equation} c_{p'u'}:=\dfrac{\overline{p'u'}}{\sqrt{\overline{p'^2}}\sqrt{\overline{u'^2}}} \equiv\dfrac{\overline{p'u'}}{p'_{rms}u'_{rms}};\quad c_{p'v'}:=\dfrac{\overline{p'v'}}{\sqrt{\overline{p'^2}}\sqrt{\overline{v'^2}}}\equiv\dfrac{\overline{p'v'}}{p'_{rms}v'_{rms}}. \end{equation}
 In general, for all of the  $(Re_{\tau ^\star },\bar {M}_{{CL}_x})$ flow conditions in the database (table 1), $c_{p'u'} > 0$ for all $y^\star \in ]0,\delta ^\star ]$ (figure 8), whereas $c_{p'v'} < 0$ for all $y^\star \in ]0,\delta ^\star [$ (figure 9), with $[c_{p'v'}]_{CL} = 0$ because of symmetry.

Figure 8. Profiles of correlation coefficient  $c_{p'u'}$ of streamwise pressure transport (3.4a,b), plotted against the HCB-scaled non-dimensional distance from the wall $y^\star$ (logscale and linear wall-zoom), for varying HCB Reynolds numbers $73 \leqslant Re_{\tau ^\star } \leqslant 983$ at constant centreline Mach numbers $\bar {M}_{{CL}_x} \in \{0.33,0.80,1.50, 2.00\}$, and for varying centreline Mach numbers $0.32 \leqslant \bar {M}_{{CL}_x} \leqslant 2.49$ at constant HCB Reynolds numbers $Re_{\tau ^\star } \in \{100,110,250,340\}$, from the present DNS database (table 1).

Figure 9. Profiles of correlation coefficient  $c_{p'v'}$ of wall-normal pressure transport (3.4a,b), plotted against the HCB-scaled non-dimensional distance from the wall $y^\star$ (logscale and linear wall-zoom), for varying HCB Reynolds numbers $73 \leqslant Re_{\tau ^\star } \leqslant 983$ at constant centreline Mach-numbers $\bar {M}_{{CL}_x} \in \{0.33,0.80,1.50, 2.00\}$, and for varying centreline Mach numbers $0.32 \leqslant \bar {M}_{{CL}_x} \leqslant 2.49$ at constant HCB Reynolds numbers $Re_{\tau ^\star } \in \{100,110,250,340\}$, from the present DNS database (table 1).
In the near-wall region ( $y^\star \lessapprox 15$) $c_{p'u'}$, at constant $\bar {M}_{{CL}_x}$, shows weak dependence on $Re_{\tau ^\star }$ (figure 8). On the other hand, as $\bar {M}_{{CL}_x}$ increases above $0.8$, at constant $Re_{\tau ^\star }$, the near-wall level of $c_{p'u'}$ also increases indicating that compressibility effects enhance the positive correlation of $p'$ with the streamwise velocity fluctuation $u'$ near the wall (figure 8). This region ( $y^\star \lessapprox 15$) corresponds precisely to the region where an increase of ${p'}^+_{rms}$ was observed with increasing $\bar {M}_{{CL}_x}$ (figure 3).
Regarding  $c_{p'v'}$ (figure 9) we observe near the wall ( $y^\star \lessapprox 15$) a very marked influence of $\bar {M}_{{CL}_x}$, at constant $Re_{\tau ^\star }$, both in level and slope. For all of the $(Re_{\tau ^\star },\bar {M}_{{CL}_x})$ flow conditions in the database (table 1) we have roughly $c_{p'v'}(y^\star \approxeq y^\star _{p'{PEAK}}) \approxeq -0.05$, which progressively develops to a plateau with increasing $Re_{\tau ^\star }$. At low $\bar {M}_{{CL}_x} \approxeq 0.33$, $c_{p'v'}$ decreases monotonically for $y^\star \lessapprox y^\star _{p'{PEAK}}$ towards the wall where it reaches a high negative value $-[c_{p'v'}]_w \approxeq 0.4$ (depending on $Re_{\tau ^\star }$), in line with incompressible flow data (Hoyas & Jiménez Reference Hoyas and Jiménez2006; Lee & Moser Reference Lee and Moser2015). At the incompressible flow limit, which is quite well represented by the $\bar {M}_{{CL}_x}\approxeq 0.33$ data (Gerolymos et al. Reference Gerolymos, Sénéchal and Vallet2013; Gerolymos & Vallet Reference Gerolymos and Vallet2016), the region $y^\star \lessapprox y^\star _{p'{PEAK}}$ is dominated by $(p',v')$ events of opposite sign (figure 9), the more so as the wall is approached. The data at $\bar {M}_{{CL}_x} \approxeq 0.8$ indicate similar behaviour, up to the deep viscous sublayer, where we observe a very slight decrease of the negative correlation $-c_{p'v'} = \left \lvert c _{p'v'}\right \rvert$, for $y^\star \lessapprox \tfrac {1}{2}$, at $Re_{\tau ^\star } \lessapprox 340$ (figure 9). This decrease of $-c_{p'v'}$ with increasing $\bar {M}_{{CL}_x}$ is an important trend, as confirmed by the data for $\bar {M}_{{CL}_x} \approxeq 1.5$ (figure 9), where it starts at $y^\star \lessapprox 1.5$ reaching wall-values of $-[c_{p'v'}]_w \lessapprox 0.1$, nearly four times less than at $\bar {M}_{{CL}_x} \approxeq 0.33$. Note also that the $\bar {M}_{{CL}_x} \approxeq 1.5$ data at constant $Re_{\tau ^\star }$ deviate from the lower $\bar {M}_{{CL}_x} \approxeq 0.8$ data already at $y^\star \lessapprox 15$. For $\bar {M}_{{CL}_x} \approxeq 2$ this deviation is larger and the negative peak (NP) of $c_{p'v'}$ occurs at $y^\star \approxeq 2.5$, with a very strong positive slope nearer to the wall, where near-zero values are observed (figure 9). This compressibility effect becomes more pronounced at higher $\bar {M}_{{CL}_x}$ as shown by the $Re_{\tau ^\star } \approxeq 100$ data at progressively increasing $\bar {M}_{{CL}_x} \in \{1.5,1.8,1.9,2.0,2.1,2.2\}$ (figure 9). For the case $(Re_{\tau ^\star },\bar {M}_{{CL}_x}) = (113,2.49)$ there is a monotonic increase of $c_{p'v'}$ towards $[c_{p'v'}]_w \lessapprox 0$ in the entire region $y^\star \lessapprox 15$ (figure 9).
There is, nonetheless, a  $Re_{\tau ^\star }$-effect as well, the decrease of $-c_{p'v'}$ becoming weaker and occurring closer to the wall with increasing $Re_{\tau ^\star }$ (figure 9).
This substantial modification in the pressure–velocity correlations suggests a noticeable modification of the near-wall pressure field by compressibility. With increasing  $\bar {M}_{{CL}_x}$, both the extent of the near-wall region impacted by the compressibility effects and the difference from the incompressible behaviour increase significantly (figures 8, 9). Note that the region $y^\star \lessapprox 10$ is also the region where both wall-echo effects and the Stokes term in the $\nabla ^2p'$ splitting are important (Gerolymos et al. Reference Gerolymos, Sénéchal and Vallet2013).
Regarding the outer part of the flow, note that  $c_{p'v'}$ profiles (figure 9) have little $\bar {M}_{{CL}_x}$ influence, whereas there is a weak $\bar {M}_{{CL}_x}$ effect on $c_{p'u'}$ (figure 8).
4. Near-wall streaks and pressure field
To understand the physical mechanisms behind these near-wall effects we can use equations (e.g. for  $\nabla ^2p'$ or for $D_t\overline {p'^2}$) and/or examine the coherent structures in this region. In the present paper, we concentrate on the coherent structures, in an effort to identify structural changes in the flow.
In the following, we present results at nearly constant  $Re_{\tau ^\star } \approxeq 110$ for which the widest range $0.32 \leqslant \bar {M}_{{CL}_x} \leqslant 2.49$ is available (table 1). These are confirmed at higher $Re_{\tau ^\star } \in \{250,340\}$ and lower $Re_{\tau ^\star } \approxeq 102$, which are not reported, for conciseness. Note also that the $(Re_{\tau ^\star },\bar {M}_{{CL}_x}) = (113,2.49)$ flow (Gerolymos & Vallet Reference Gerolymos and Vallet2014, Reference Gerolymos and Vallet2018) corresponds to the same conditions as the flow analysed by Tang et al. (Reference Tang, Zhao, Wan and Liu2020) to identify near-wall compressibility effects.
The previous analysis (§ 3) of  $p'$ variance and correlations highlights the important effects of varying $\bar {M}_{{CL}_x}$ at constant $Re_{\tau ^\star }$ on the near-wall ( $y^\star \lessapprox 15$) $p'$-field. This is in line with previous work (Yu et al. Reference Yu, Xu and Pirozzoli2019; Tang et al. Reference Tang, Zhao, Wan and Liu2020), but the availability of the present $(Re_{\tau ^\star },\bar {M}_{{CL}_x})$-matrix database (table 1) allows us to evaluate the influence of each of the two parameters separately. Far more than the differences in $p'_{rms}$ (figure 3), the large (with increasing $\bar {M}_{{CL}_x}$) modifications in the pressure–velocity correlation coefficients $c_{p'u'}$ and $c_{p'v'}$ near the wall (figures 8, 9) are structural modifications (Bradshaw Reference Bradshaw1977) suggesting significant differences in the flow field near the wall.
This region ( $y^\star \lessapprox 15$) where $p'$-statistics are strongly $\bar {M}_{{CL}_x}$-dependent is precisely the region where flow structure and dynamics are dominated by the near-wall streaks (Chernyshenko & Baig Reference Chernyshenko and Baig2005a,Reference Chernyshenko and Baigb; Wang, Pan & Wang Reference Wang, Pan and Wang2019) characteristic of buffer-layer turbulence (Panton Reference Panton2001; Adrian Reference Adrian2007; Bernard Reference Bernard2019), but which actually extend also into the viscous sublayer, practically down to the wall. As $y \to y_w$ approaching the wall
 \begin{equation} y^+\to0\implies\begin{array}{c}\bar{\rho}(y)\to\bar{\rho}_w\\ \bar{\mu}(y)\to\bar{\mu}_w\\\end{array}\stackrel{(2.1a),~(2.1c)}{\implies} \begin{array}{c}x^\star\to x^+\\ y^\star\to y^+\\ z^\star\to z^+ \end{array} . \end{equation}
 Hence, for increasing  $\bar {M}_{{CL}_x}$, because of the strong mean-temperature stratification (figure 1), the wall-normal gradient of the HCB length-unit $\partial _y \ell _{UNIT}^\star$ becomes increasingly strong. Therefore, any near-wall phenomenon ( $y^\star \lessapprox 15$) whose length scale is almost constant or slowly varying in the wall-normal direction cannot be correctly represented in HCB-scaled spatial coordinates.
It turns out that the spanwise distance between streaks is precisely such a flow feature. As we are interested in comparing flow fields near the wall, we need to determine what is the appropriate length-unit for  $\{x,y,z\}$.
4.1. Scaling of the spanwise distance between streaks
A good surrogate for this distance in an average sense can be defined via the spanwise two-point correlation coefficient of the streamwise velocity (Chernyshenko & Baig Reference Chernyshenko and Baig2005b)
 \begin{equation} C^{(z)}_{u'u'}(y,\xi_z):=\dfrac{\overline{u'(x,y,z,t)\,u'(x,y,z+\xi_z,t)}}{\overline{u'^2}(y)}, \end{equation}
where the footprint of the streaks is the appearance of a strong ( $\sim-0.2$) negative peak (NP) before the correlation increases again towards $0$ (figure 10). This NP is attributed to the negative correlation between low velocities ( $u'<0$) inside the streaks with the high velocities ( $u'>0$) in the adjoining region. It ‘may be used to assign a length scale to the turbulence’ (Tritton Reference Tritton1988, p. 307), namely, the distance of the first NP from the origin of $\xi _z$ (4.2a)
 \begin{equation} \varLambda_{u'}^{(z;{NP})}:=\min\left\lvert\xi_z\right\rvert\left|\begin{matrix}\partial_{\xi_z} C^{(z)}_{u'u'}(y,\xi_z)=0,\\[3pt] C^{(z)}_{u'u'}(y,\xi_z)<0. \end{matrix}\right. \end{equation}
Chernyshenko & Baig (Reference Chernyshenko and Baig2005b) suggest that twice this length scale is a good estimate for the average distance between streaks
 \begin{equation} \varLambda_{S}^{(z)}:=2\varLambda_{u'}^{(z;{NP})}. \end{equation}
Of course there are much more advanced techniques for identifying the streaks as coherent structures, either on each  $(xz)$-plane (Wang et al. Reference Wang, Pan and Wang2019) or as three-dimensional structures (Bernard Reference Bernard2019; Bae & Lee Reference Bae and Lee2021), allowing a more accurate statistical determination of an average distance between streaks, but the surrogate (4.2c) is sufficient for the purposes of the present work.

Figure 10. Two-point spanwise correlation coefficient of streamwise velocity fluctuations  $C_{u'u'}^{(z)}(y;\xi _z)$ (4.2a), at different HCB-scaled non-dimensional distances from the wall $y^\star \in \{1,5,10,15,20\}$, plotted against different non-dimensionalisations (2.1) of the distance between the two points $\{\xi _z^+,\xi _z^\star,\xi _z^\ddagger \}$, for varying centreline Mach numbers $0.32 \leqslant \bar {M}_{{CL}_x} \leqslant 2.49$ at nearly constant $Re_{\tau ^\star } \approxeq 110$ (table 2); the average distance between streaks surrogate $\varLambda _{S}^{ ( z )\ddagger }$ (4.2b), (4.2c) is indicated at $y^\star \approxeq 20$.
Plotting the correlation coefficient  $C^{(z)}_{u'u'}(y,\xi _z)$ (4.2a) against $\xi _z^+$ in standard wall-units (2.1a) at different wall-normal stations $y^\star \in \{1,5,10,15,20\}$ (figure 10) clearly shows little variation with wall distance for given flow conditions $(Re_{\tau ^\star },\bar {M}_{{CL}_x})$. As in standard wall-units, the length-unit does not depend on wall distance, this suggests that the spanwise spacing of the streaks, for given flow conditions $(Re_{\tau ^\star },\bar {M}_{{CL}_x})$, varies little with $y$ in the near-wall region ( $y^\star \lessapprox 15$). On the other hand, expectedly, standard wall-units (2.1a) scaling of $\xi _z^+$ shows very important differences with increasing $\bar {M}_{{CL}_x}$ at nearly constant $Re_{\tau ^\star }$, exactly analogous to the strong $\bar {M}_{{CL}_x}$-dependence of the ratio $Re_{\tau _w}/Re_{\tau ^\star }$ (table 1).
Plotting the correlation coefficient  $C^{(z)}_{u'u'}(y,\xi _z)$ (4.2a) against $\xi _z^\star$ in HCB-scaled units (2.1b) illustrates both the successes and shortcomings of this scaling. Sufficiently away from the wall ( $y^\star \approxeq 20$) the two-point correlation coefficients $C^{(z)}_{u'u'}$ for different $\bar {M}_{{CL}_x}$ at nearly constant $Re_{\tau ^\star }$ practically collapse on a single curve when plotted against $\xi _x^\star$ (figure 10). However, closer to the wall, as progressively $y \to 0\implies \xi _z^\star \to \xi _z^+$ (4.1), the substantial differences between different $\bar {M}_{{CL}_x}$ are recovered, e.g. at $C^{(z)}_{u'u'}(y^\star \approxeq 1,\xi _z^+) \approxeq C^{(z)}_{u'u'}(y^\star \approxeq 1,\xi _z^\star )$ (figure 10).
This behaviour is better understood by considering the profiles (against  $y^\star$) of the distance between streaks (4.2c) in the two scalings, $\varLambda _{S}^{ ( z )+}$ and $\varLambda _{S}^{ ( z )\star }$, in the entire buffer region (figure 11). Data at $Re_{\tau ^\star } \approxeq 110$ for different $\bar {M}_{{CL}_x} \in \{0.32,0.79,1.51,2.02,2.49\}$ show that the HCB-scaled $\varLambda _{S}^{ ( z )\star }$ is not particularly sensitive to $\bar {M}_{{CL}_x}$ for $y^\star \gtrapprox 15$, but also reveal increasingly large differences (with increasing $\bar {M}_{{CL}_x}$) when approaching the wall (figure 11), in line with (4.1). Note, in particular, how, for $(Re_{\tau ^\star },\bar {M}_{{CL}_x}) = (113,249)$, $\varLambda _{S}^{ ( z )\star }(y^\star \to 0)$ increases sharply towards values approaching $\varLambda _{S}^{ ( z )+}$ at the wall which are outside of the plot range (figure 11).

Figure 11. Different non-dimensionalisations (2.1)  $\{\varLambda _{{S}}^{ ( z )+},\varLambda _{{S}}^{ ( z )\star },\varLambda _{{S}}^{ ( z )\ddagger }\}$ of the surrogate for the average spanwise distance (4.2b), (4.2c), plotted against the HCB-scaled non-dimensional distance from the wall $y^\star$ (2.1b), at nearly constant $Re_{\tau ^\star }\in\{110\pm 5,341\pm 1\}$ for different $\bar {M}_{{CL}_x}\in \{0.32,0.79,1.51, 2.00\pm 0.02,2.49\}$ (table 2); enlarged view of the region $y^{\star } \leq 50$.
As we are interested in examining flow fields in the near-wall region, we need a length unit that does not vary in the wall-normal direction, to conform with the fact that in physical space the spanwise distance between streaks (which is a physically relevant length scale) varies little wall-normal-wise (figures 10, 11). On the other hand, this length-unit should approach  $\ell _{UNIT}^\star$ for $y^\star \gtrapprox 15$ where HCB scaling is successful in accounting for $\bar {M}_{{CL}_x}$ effects. One possible, but rather difficult to use in practice, choice would be to use $\ell _{UNIT}^\star (y)$ for all $y^\star \geqslant y^\star _{p'{PEAK}}$, and use a constant $\ell _{UNIT}^\star (y_{p'{PEAK}})$ for all $y^\star \leqslant y^\star _{p'{PEAK}}$ from the $p'_{rms}$ peak (3.2) down to the wall. However, this complexity is not necessary. The $y$-dependence of $\ell _{UNIT}^\star (y)$ (2.1b) stems essentially from the mean-temperature stratification of the flow (figure 1) which induces the variations of $\bar {\mu }(y)$ and $\bar {\rho }(y)$ (§ 2.1). Closer observation of the $\tilde {T}(y)$ profiles (figure 1) reveals that strong temperature variations actually occur only in the near-wall region ( $y^\star \lessapprox 20$), for a given $(Re_{\tau ^\star },\bar {M}_{{CL}_x})$ flow, whereas in the outer region ( $y^\star \gtrapprox 20$) temperature variations are much smaller ( $\tilde {T}_{CL}-\tilde {T}(y) \ll \tilde {T}_{CL}-\tilde {T}_w\;\forall y^\star \gtrapprox 20$). Therefore, a system of units based on $\bar {\tau }_w$, which was found to be an appropriate scale for $p'$ (§ 3), and centreline thermodynamic quantities $\{\bar {\rho }_{CL},\bar {\mu }_{CL}\}$ should be very close to $(\cdot )^\star$ units for $y^\star \gtrapprox 15$, while being $y$-independent. For TPC flow (2.2b), these are precisely the $(\cdot )^\ddagger$ units (2.1c) introduced in § 2.1, which retain with a very good accuracy the advantages of the HCB scaling in the outer part of the flow, while respecting the very small $y$ variation of the $(xz)$ organisation of the flow very near the wall. Furthermore, in TPC flow, this system of units also maintains $Re_{\tau ^\star } = Re_{\tau ^\ddagger }$ (2.2a) as the relevant Reynolds number.
Plotting the correlation coefficient  $C^{(z)}_{u'u'}(y,\xi _z)$ (4.2a) against $\xi _z^\ddagger$ practically collapses the curves for the different $\bar {M}_{{CL}_x} \in \{1.51, 2.02,2.49\}$ at $Re_{\tau ^\star } \approxeq 110$, for all $y^\star \in \{1,5,10,15,20\}$ (figure 10). The applicability of the $(\cdot )^\ddagger$ units (2.1c) is further confirmed by the profiles of $\varLambda _{S}^{ ( z )\ddagger }(y)$ (figure 11) which are clustered closely together for the different $\bar {M}_{{CL}_x} \in \{0.32,0.79,1.51, 2.00\pm 0.02 ,2.49\}$ at $Re_{\tau ^\star } \approxeq 110$. These profiles of $\varLambda _{S}^{ ( z )\ddagger }(y)$ are very similar with those obtained in incompressible flow (Chernyshenko & Baig Reference Chernyshenko and Baig2005b, figure 1, p. 1100).
The scaling of the streamwise two-point correlation
 \begin{equation} C^{(x)}_{u'u'}(y,\xi_x):=\dfrac{\overline{u'(x,y,z,t)\,u'(x+\xi_x,y,z,t)}}{\overline{u'^2}(y)} \end{equation}
with  $\xi _x^\ddagger$ (2.1c) is also quite satisfactory, compared with $\xi _x^+$ (2.1a) or $\xi _x^\star$ (2.1b), in that it very efficiently clusters together the curves for different $\bar {M}_{{CL}_x}$ at nearly constant $Re_{\tau ^\star }$ (figure 10). Nonetheless, there remains, expectedly, a small $\bar {M}_{{CL}_x}$-dependence which slightly increases as $y$ decreases towards the wall (figure 10). This observation highlights the fact that both $(\cdot )^\star$ units (2.1b) and $(\cdot )^\ddagger$ units (2.1c) may show $\bar {M}_{{CL}_x}$-dependence very near the wall, but the latter are less $\bar {M}_{{CL}_x}$-sensitive and have the advantage of being $y$-independent and of not tending to $(\cdot )^+$ units (2.1a) at the wall.
4.2. Appearance of organised pressure waves with increasing $\bar {M}_{{CL}_x}$

The low-speed streaks in the near-wall region can be identified (figure 13) using the conditional average (truncated distribution)
 \begin{equation} \overline{M_x|_{M_x'<0}}:=\dfrac{\displaystyle\int\nolimits_{M_{x_{min}}}^{\bar{M}_x} M_x\,f_{M_x}(M_x)\,dM_x} {\displaystyle\int\nolimits_{M_{x_{min}}}^{\bar{M}_x} \ f_{M_x}(M_x)\,dM_x} , \end{equation}
where  $M_{x_{min}}$ is the minimum observed $M_x$ and $f_{M_x}$ the corresponding p.d.f. This simple parameter-free choice (only requiring sampling the p.d.f. of $M_x$) performs quite well (figure 13), thus avoiding user-defined thresholds (Wang et al. Reference Wang, Pan and Wang2019) or percolation techniques (Bae & Lee Reference Bae and Lee2021). Note that the spanwise distance between the instantaneous streaks in the $(x^\ddagger,z^\ddagger )$-plane (figure 13) varies little with $\bar {M}_{{CL}_x}$, in line with the previous analysis (§ 4.1) which resulted in the introduction of $(\cdot )^\ddagger$ units (2.1c).

Figure 12. Two-point streamwise correlation coefficient of streamwise velocity fluctuations  $C_{u'u'}^{(x)}(y;\xi _x)$ (4.2d), at different HCB-scaled non-dimensional distances from the wall $y^\star \in \{1,5,10,15,20\}$, plotted against different non-dimensionalisations (2.1) of the distance between the two points $\{\xi _x^+,\xi _x^\star,\xi _x^\ddagger \}$, for varying centreline Mach numbers $0.32 \leqslant \bar {M}_{{CL}_x} \leqslant 2.49$ at nearly constant $Re_{\tau ^\star } \approxeq 110$ (table 2).

Figure 13. Instantaneous fluctuating streamwise Mach number  $M_x'$ (colourmap $-2M'_{x_{rms}} \leqslant M_x' \leqslant +2M'_{x_{rms}}$), on $(x^\ddagger,z^\ddagger )$ planes very near the wall ( $y^\star \approxeq 1$), for different $\bar {M}_{{CL}_x} \in \{1.51, 2.02,2.49\}$ at nearly constant $Re_{\tau ^\star } \approxeq 110$ and approximate streak boundaries (black contours $M_x = \overline {M_x|_{M_{x}^{'}<0}}$); also included is the surrogate of the average spanwise distance between streaks $\varLambda _{S}^{ ( z )\ddagger }$ (4.2b), (4.2c).
It is not easy to identify structures by simply visualising instantaneous  $p'$-fields (figure 14). For the higher $\bar {M}_{{CL}_x} = 2.49$ case, the ( $+ / -$)- $p'$ regions, which were identified and analysed for the same flow conditions by Tang et al. (Reference Tang, Zhao, Wan and Liu2020), are visible inside the streaks (figure 14). Note also that we can sometimes discern bow-like ( $+ / -$)- $p'$ regions connecting corresponding regions between neighbouring streaks. At $\bar {M}_{{CL}_x} = 2.02$ the same pattern is observed (figure 14), but with lower spatial density (probability of occurrence), and at lower $\bar {M}_{{CL}_x} = 1.51$, ( $+ / -$)- $p'$ regions are visible essentially at the boundaries of the streaks, with much less and weaker streamwise events or connecting bow structures (figure 14).

Figure 14. Instantaneous fluctuating pressure field  $p'$ (X-ray colourmap $-3p'_{rms} \leqslant p'\leqslant +3p'_{rms}$), on $(x^\ddagger,z^\ddagger )$ planes very near the wall ( $y^\star \approxeq 1$), for different $\bar {M}_{{CL}_x} \in \{1.51, 2.02,2.49\}$ at nearly constant $Re_{\tau ^\star } \approxeq 110$ and approximate streak boundaries (cyan contours $M_x = \overline {M_x|_{M_{x}^{'}<0}}$); also included is the surrogate of the average spanwise distance between streaks $\varLambda _{S}^{ ( z )\ddagger }$ (4.2b), (4.2c).
To better identify the  $p'$-structures it is preferable to use gradients or Laplacians similarly to standard optical visualisation techniques (Liepmann & Roshko Reference Liepmann and Roshko1957, pp. 157–163). After testing different options it appeared that the in-plane Laplacian
 \begin{equation} \nabla^2_{xz}p':=\dfrac{\partial^2 p'}{\partial x^2}+\dfrac{\partial^2 p'}{\partial z^2} \end{equation}
is a very good choice. Note that for the present  $xz$-invariant-in-the-mean flow, $\nabla ^2_{xz}p'=\nabla ^2_{xz}p$, so that (4.4) can be evaluated without the knowledge of $\bar p(y)$. Furthermore, $\nabla ^2_{xz}p'$ only requires in-plane data which allows $y$-subsampling in data extraction. Following the previous analysis (§ 4.1) of the two-point correlation coefficients $C_{u'u'}^{(z)}(z;\xi _z)$ (figure 10) and $C_{u'u'}^{(x)}(y;\xi _x)$ (figure 12), and of the surrogate distance between streaks $\varLambda _{S}^{ ( z )\ddagger }(y)$ (figure 11), we used $(\cdot )^\ddagger$ units (2.1c) to non-dimensionalise $(\nabla ^2_{xz}p')^\ddagger$. Recall that the unit for $p$ is $\bar {\tau }_w$ in all systems (2.3).
By analogy with harmonic waves, we may identify very approximately the high negative values of  $(\nabla ^2_{xz}p')^\ddagger$ with $p'$-maxima and the high positive values with $p'$-minima. The wavefronts can actually be identified to the contours corresponding to $(\nabla ^2_{xz}p')^\ddagger = 0$ which separate the ( $+ / -$)- $p'$ regions. The waves, which are very clearly visible for the higher $\bar {M}_{{CL}_x}\in \{2.02,2.49\}$ (figure 15), are essentially in the streamwise direction ( $x$-wise), but the fronts (essentially $z$-wise for $x$-wise waves) seem to be faster in the high- $M_x$ regions between steaks and slower within the low- $M_x$ streaks, taking a bow shape in the high- $M_x$ regions. More importantly, these bow fronts cross the streaks and seem to have spanwise extent over several streaks (figure 15). A more detailed time-dependent analysis would be necessary to identify precisely the nature and statistics of these coherent structures, but this is beyond the scope of the paper and should be the subject of future research. It does seem plausible however that these cross-streak $p'$ bow waves are related with the previously observed effects of $\bar {M}_{{CL}_x}$ on $p'$-statistics and correlations with the velocity field near the wall.

Figure 15. Instantaneous in-plane Laplacian of fluctuating pressure in mixed inner/outer scaling (2.1c)  $(\boldsymbol {\nabla }_{xz}p')^\ddagger$ (X-ray colourmap $-\tfrac {1}{100} \leqslant (\boldsymbol {\nabla }_{xz}p')^\ddagger \leqslant +\tfrac {1}{100}$), on $(x^\ddagger,z^\ddagger )$ planes very near the wall ( $y^\star \approxeq 1$), for different $\bar {M}_{{CL}_x} \in \{1.51, 2.02,2.49\}$ at nearly constant $Re_{\tau ^\star } \approxeq 110$ and approximate streak boundaries (cyan contours $M_x = \overline {M_x|_{M_{x}^{'}<0}}$); also included is the surrogate of the average spanwise distance between streaks $\varLambda _{S}^{ ( z )\ddagger }$ (4.2b), (4.2c).
Note that these bow waves are precisely connected to the ( $+ / -$)- $p'$ structures inside the streaks (figure 14) which were identified and analysed by Tang et al. (Reference Tang, Zhao, Wan and Liu2020). However, using $(\nabla ^2_{xz}p')^\ddagger$ has definite advantages in identifying the spanwise extent and spanwise coherence of these $p'$-waves, which is not as obvious by simply considering $p'$ X-rays (figure 14) or $p'$-level plots (Tang et al. Reference Tang, Zhao, Wan and Liu2020). The ( $+ / -$)- $p'$ regions inside the streaks are possibly the effect of the interaction of these pressure waves with the three-dimensional vortical structures responsible for the appearance of the streaks. In three dimensions the streaks are identified by pairs of counter-rotating structures of wall-normal vorticity $\omega _y$ which induce highly negative $u' < 0$ in the centre region of the streaks (Adrian Reference Adrian2007; Bernard Reference Bernard2019). Therefore the spanwise cross-streak coherence of the bow waves observed by studying $(\nabla ^2_{xz}p')^\ddagger$ (figure 15) is a feature of the near-wall $p'$ field which requires further study. Note that with the hindsight of the detection of the wavefronts using $(\nabla ^2_{xz}p')^\ddagger$ (figure 15), the spanwise persistence of the waves between streaks is observable in the $p'$-field as well, especially with increasing $\bar {M}_{{CL}_x}$ (figure 14).
These waves are essentially present in the near-wall region ( $y^\star \lessapprox 15$), and have substantial amplitude with increasing $\bar {M}_{{CL}_x}$, so at the higher $\bar {M}_{{CL}_x} \in \{2.02,2.49\}$ they are the dominant feature in the $(\nabla ^2_{xz}p')^\ddagger$ X-rays (figure 15). At $\bar {M}_{{CL}_x} = 1.51$ they no longer dominate the very-near-wall $p'$-field (figure 15), although a few weak streamwise events (spanwise fronts) are discernible. However, the fronts between ( $+ / -$)- $p'$ regions have become mostly parallel to the streaks, implying that with decreasing $\bar {M}_{{CL}_x}$ the amplitude of streamwise waves decreases, so that they no longer dominate the background $p'$-field at the wall, which becomes essentially associated with (induced by) the vortical structures responsible for the streaks. This is also the case at lower $\bar {M}_{{CL}_x} \in \{0.32,0.79\}$. Although not shown, for conciseness, $(\nabla ^2_{xz}p')^\ddagger$ X-rays at different distances from the wall $y^\star \in \{3,5,10,15,20,y^\star _{p'_{PEAK}}\}$ indicate that the density and intensity of the cross-streak streamwise bow waves, at constant high $\bar {M}_{{CL}_x} \in \{2.02,2.49\}$ diminishes with increasing distance from the wall, and at $y^\star \approxeq 20$ they are hardly discernible even for the highest $\bar {M}_{{CL}_x} = 2.49$. It is therefore plausible to associate this major modification of the $p'$-field, which is strengthened with increasing $M_{{CL}_x}$ and with decreasing distance from the wall, to near-wall compressibility effects, precisely in the region where differences were observed in $p'_{rms}$ (figure 3) and in the correlation coefficients $\{c_{p'u'},c_{p'v'}\}$ (figures 8 and 9).
4.3. Pressure–velocity correlations near the wall
With the hindsight of the results above (§ 4.2) regarding the effect of  $\bar {M}_{{CL}_x}$ on the near-wall $p'$-field we reexamine the pressure–velocity correlations $c_{p'u'}$ and $c_{p'v'}$ (figures 8 and 9), by studying (figure 16) the integrands in the evaluation of $\{c_{p'u'},c_{p'v'}\}$ (3.4a,b) from the joint p.d.f.s $\{f_{p'u'}f_{p'v'}\}$ (table 2)
 $$\begin{gather} c_{p'u'}\stackrel{(3.4a,b)}= \int_{p'_{min}}^{p'_{max}} \int_{u'_{min}}^{u'_{max}} p'u'\,f_{p'u'}(p',u')\,d\left(\dfrac{p'}{p'_{rms}}\right) d\left(\dfrac{u'}{u'_{rms}}\right),\end{gather}$$
 $$\begin{gather}c_{p'v'}\stackrel{(3.4a,b)}= \int_{p'_{min}}^{p'_{max}} \int_{v'_{min}}^{v'_{max}} p'v'\,f_{p'v'}(p',v')\,d\left(\dfrac{p'}{p'_{rms}}\right)d\left(\dfrac{v'}{v'_{rms}}\right) ,\end{gather}$$
integrated with respect to the standardised variables
 \begin{equation} p'_{STD}:=p'/p'_{rms};\quad u'_{STD}:=u'/u'_{rms};\quad v'_{STD}:=v'/v'_{rms}. \end{equation}
Figure 16. Integrands in the calculation of the correlation coefficients  $c_{p'u'}$ (4.5a) and $c_{p'v'}$ (4.5b) from the corresponding joint p.d.f.s, plotted against the standardised variables $\{p'/p'_{rms},u'/u'_{rms},v'/v'_{rms}\}$, very near the wall ( $y^\star \approxeq 1$), at nearly constant $Re_{\tau ^\star } \approxeq 110$ for different $\bar {M}_{{CL}_x} \in \{0.32,0.79,1.51, 2.02,2.49\}$.
Table 2. Sampling parameters for p.d.f.s, joint p.d.f.s and two-point correlations:  $Re_{\tau ^\star }$ is the friction Reynolds number in HCB-scaling (2.1b); $\bar {M}_{{CL}_z}$ is the centreline Mach number (2.4); $\Delta t$ is the computational time step (table 1); $\Delta t_{s_q}$, $\varDelta t_{s_{2q}}$, $\varDelta t_{s_{R2}}$ are the sampling time steps for p.d.f.s, joint p.d.f.s and two-point correlations; $t_{{OBS}_q}$, $t_{{OBS}_{2q}}$, $t_{{OBS}_{R2}}$ are the sampling observation intervals for p.d.f.s, joint p.d.f.s and two-point correlations; $N_{{bins}_q}$, $N_{{bins}_{2q}}$ are the sampling bins for the calculation of p.d.f.s and joint p.d.f.s; $N_{s_q}$, $N_{s_{2q}}$ is the number of samples involved in the calculation of p.d.f.s and joint p.d.f.s; $(\cdot )^+$ denotes wall-units (2.1a).

Near the wall, the streamwise correlation  $c_{p'u'}$ (figure 16) is dominated by $u' < 0$ events, essentially inside the streaks. The positive/negative correlation peaks occur at $u' \approxeq -u'_{rms}$ (figure 16), which is located approximately on or inside the streaks boundaries determined by $M_x = \overline {M_x|_{M_{x}^{'}<0}}$. At the lower $\bar {M}_{{CL}_x} \in \{0.32,0.79,1.51\}$ the integral of the positive $p'u' > 0$ quadrant $Q_3$ ( $u_{STD}' < 0 > p_{STD}'$) is slightly higher than the integral of the negative $p'u' < 0$ quadrant $Q_4$ ( $u_{STD}' < 0 < p_{STD}'$). With increasing $\bar {M}_{{CL}_x}$, the $Q_3$ contribution increases with respect to $Q_4$, enhanced by $p' < 0$ events well inside the streaks ( $u_{STD}' < -1 > p_{STD}'$). These statistical results suggest that the increase of $c_{p'u'}$ with increasing $\bar {M}_{{CL}_x}$ in the near-wall region (figure 8) is probably the result of the interaction of the cross-streak pressure waves with the vortical structures inside the streaks, with little contribution from the high-speed regions between streaks.
Regarding the wall-normal correlation  $c_{p'v'}$, the effect of $\bar {M}_{{CL}_x}$ is more pronounced (figure 16), confirming that the decrease towards $0$ of $-c_{p'v'} > 0$ with increasing $\bar {M}_{{CL}_x}$ in the near-wall region (figure 9) is the result of structural changes in the flow. The positive $p'v' > 0$ quadrants $Q_1$ ( $v_{STD}' > 0 < p_{STD}'$) and $Q_3$ ( $v_{STD}' < 0 > p_{STD}'$) are nearly symmetric around the origin. With increasing $\bar {M}_{{CL}_x}$ their weight increases relative to the negative quadrants $Q_2$ ( $v_{STD}' > 0 > p_{STD}'$) and $Q_4$ ( $v_{STD}' < 0 < p_{STD}'$), so that at the higher $\bar {M}_{{CL}_x} \in \{2.02,2.49\}$ the integral approaches $0$. This is in complete contrast with the lower $\bar {M}_{{CL}_x} \in \{0.32,0.79,1.51\}$ where the negative quadrants are clearly dominant (figure 16), the more so with decreasing $\bar {M}_{{CL}_x}$, with the maximum of $Q_4$ ( $v_{STD}' < 0 < p_{STD}'$) being higher than that of $Q_2$ ( $v_{STD}' > 0 > p_{STD}'$). Note also that there are increasing contributions from the positive quadrants ( $Q_1$ and $Q_3$) with increasing $\bar {M}_{{CL}_x}$. At the higher $\bar {M}_{{CL}_x} = 2.49$ the integrands of $c_{p'v'}$ have become practically antisymmetric with respect to the zero axes (figure 16), explaining by cancellation the very low value of $-c_{p'v'}$ (figure 9).
The instantaneous contours  $\nabla ^2_{xz}p' = 0$ are also the boundaries (fronts) between ( $+ / -$)- $p'$ events, whereas the instantaneous contours $M_x = \overline {M_x|_{M_{x}^{'}<0}}$ highlight the low- $u$ streaks (generally the statistics of $M_x$ and $u$ are very similar). The correlation of this $\{p',u'\}$-fields organisation with the wall-normal velocity $v'$ can be visualised by superposing the instantaneous $p'$-fronts and the low-speed streaks boundaries with the instantaneous $M_y'$-field (figure 17). At the higher $M_{{CL}_x} = 2.49$, high-intensity ( $+ / -$)- $M_y'$ events occur invariably on the $p'$-fronts ( $\nabla ^2_{xz}p' = 0$ contours), and have precisely the same spanwise coherence and organization as the cross-streak $p'$-bow-waves (figure 17). At $\bar {M}_{{CL}_x} = 2.02$, in the regions where cross-streak $p'$-bow-fronts are present, the ( $+ / -$)- $M_y'$ events coincide with the fronts (figure 17). However, in the regions where the $p'$-fronts have started to align themselves with the streaks the ( $+ / -$)- $M_y'$ events appear elongated in the streamwise direction, and no longer coincide with the location of the fronts (figure 17). At $M_{{CL}_x} = 1.51$, the majority of $p'$-fronts are aligned with the streamwise direction, and ( $+ / -$)- $M_y'$ events are elongated in the streamwise direction and no longer coincide with the $p'$-fronts (figure 17).

Figure 17. Instantaneous wall-normal Mach number fluctuation  $M_y'$ (colourmap $-M'_{y_{rms}} \leqslant M_y' \leqslant +M'_{y_{rms}}$), on $(x^\ddagger,z^\ddagger )$ planes very near the wall ( $y^\star \approxeq 1$), for different $\bar {M}_{{CL}_x} \in \{1.51, 2.02,2.49\}$ at nearly constant $Re_{\tau ^\star }\approxeq 110$; also included are approximate streak boundaries (white contours $M_x = \overline {M_x|_{M_{x}^{'}<0}}$) and $p'$-fronts (black contours $\nabla _{xz}p'=0$).
Explaining the  $\bar {M}_{{CL}_x}$-induced structural modifications of the wall-normal correlation $c_{p'v'}$ is obviously more complicated than for the streamwise correlation $c_{p'u'}$. The strong negative $c_{p'v'}$ correlation coefficients observed at low $\bar {M}_{{CL}_x}$ can be associated to $(+ / -)$- $v'$ events that form relatively elongated streamwise structures which do not coincide with the $p'$-fronts, as, e.g., in the $\bar {M}_{{CL}_x} = 1.51$ case (figure 17). At higher $\bar {M}_{{CL}_x} = 2.49$ the flow structure is completely masked by high-intensity $(+ / -)$- $v'$ events which coincide with the fronts of the cross-streak bow-waves (figure 17), and which symmetrise the $c_{p'v'}$-integrand (figure 16). It is not clear whether it is possible to analyse this modification as an additive compressible effect, via linear approaches (Tang et al. Reference Tang, Zhao, Wan and Liu2020), or if there are important nonlinear effects (Chu & Kovásznay Reference Chu and Kovásznay1958) that become dominant with increasing $\bar {M}_{{CL}_x}$.
5. Conclusions
The construction of the  $(Re_{\tau ^\star },\bar {M}_{{CL}_x})$-matrix DNS database of compressible TPC flow presented in this paper enables the precise evaluation of the effect of each of the two flow-determining parameters, the other being held constant. The present study focusses on the effects of these two parameters on the fluctuating pressure $p'$. The wall-to-recovery temperature ratio $\bar {T}_w/T_r$ is not a free parameter, but is the result of viscous heating determined by $(Re_{\tau ^\star },\bar {M}_{{CL}_x})$. Therefore, results in the paper correspond to increasingly cold-wall conditions (relative to adiabatic-wall temperature) with increasing $\bar {M}_{{CL}_x}$.
The average wall shear stress  $\bar {\tau }_w$ is a very satisfactory scale for the level of pressure fluctuations, $p'^+_{rms} \equiv p'^\star _{rms}$ (identical in $(\cdot )^+$ wall-units or $(\cdot )^\star$ HCB units), which is much more sensitive on $Re_{\tau ^\star }$ than on $\bar {M}_{{CL}_x}$. The strongest compressibility effects on $p'_{rms}$ appear in the near-wall region ( $y^\star \lessapprox 15$) where, at constant $Re_{\tau ^\star }$, $p'^+_{rms}$ increases with increasing $\bar {M}_{{CL}_x}$, especially when $\bar {M}_{{CL}_x}\gtrapprox 2$. In contrast to the increase of the wall level $[p'_{rms}]^+_w$, the peak value $[p'_{rms}]^+_{PEAK}$ slightly decreases with $\bar {M}_{{CL}_x}$, at constant $Re_{\tau ^\star }$, but the $\bar {M}_{{CL}_x}$ effect on $[p'_{rms}]^+_{PEAK}$ is substantially weaker (more than threefold) than that on $[p'_{rms}]^+_w$. As a consequence, $[p'_{rms}]^+_w$, which is lower than $[p'_{rms}]^+_{PEAK}$ at incompressible and subsonic flow, increases with increasing $\bar {M}_{{CL}_x}$, to reach the peak level at $\bar {M}_{{CL}_x} \approxeq 2.3$, overcoming the peak value at higher $\bar {M}_{{CL}_x}$. The location $y^\star _{p'_{PEAK}}$ of the peak depends principally on $\bar {M}_{{CL}_x}$, consistently moving away from the wall with increasing $\bar {M}_{{CL}_x}$, with a much weaker dependence on $Re_{\tau ^\star }$. A correlation for $[p'_{rms}]^+_w$ with respect to $(Re_{\tau ^\ddagger },\bar {M}_{{CL}_x},T_r/\bar {T}_w)$, valid for airflow within the databases range, fits reasonably well both the incompressible and compressible DNS data.
Pressure–velocity correlations are strongly influenced by  $\bar {M}_{{CL}_x}$ in the near-wall region ( $y^\star \lessapprox 15$), where, at constant $\bar {M}_{{CL}_x}$, they depend weakly on $Re_{\tau ^\star }$. Joint p.d.f.s show that the near-wall increase of the streamwise correlation coefficient $c_{p'u'}$ is the result of increasingly intense $p' < -p'_{rms}$ events within the low-speed streaks ( $u' \approxeq -u'_{rms}$), with little influence from the higher-speed flow region between streaks. On the other hand, the decrease of $-c_{p'v'}$ in the near-wall region appears to be the result of the global modification, with increasing $\bar {M}_{{CL}_x}$, of the flow structure both inside and between streaks. Although the importance of compressibility effects and the extent of the near-wall region where they occur depend mainly on $\bar {M}_{{CL}_x}$, there is also a weak $Re_{\tau ^\star }$ influence, the $Re_{\tau ^\star } \approxeq 1000$ data indicating that compressibility effects are slightly stronger at the lower $Re_{\tau ^\star }$.
In contrast to these strong  $\bar {M}_{{CL}_x}$ effects on the near-wall $p'$-field, the average spanwise distance between low-speed streaks $\varLambda _{S}^{ ( z )}$ (which is a physically relevant length scale) shows little $\bar {M}_{{CL}_x}$-dependence, at constant $Re_{\tau ^\star }$, when non-dimensionalised using a novel system of units introduced in the paper. This new mixed inner/outer (friction/thermodynamics) system of $(\cdot )^\ddagger$ units is based on $\{\bar {\tau }_w,\min _y\bar {\rho },\max _y\bar {\mu }\}$, which in TPC flow without any artificial sink term in the energy equation are $\{\bar {\tau }_w,\rho _{CL},\mu _{CL}\}$. This $y$-independent system of units corrects the geometric distortion of the rapid wall-normal variation of the $\ell ^\star _{UNIT}(y)$ length-unit near the wall ( $y^\star \lessapprox 15$) and the overwhelming $\bar {M}_{{CL}_x}$-dependence of $\varLambda _{S}^{ ( z )+}$ in standard $(\cdot )^+$ wall-units which are ill-adapted for this compressible flow. Furthermore, in compressible TPC flow, these $(\cdot )^\ddagger$ units are almost identical to $(\cdot )^\star$ HCB units for all $y^\star \gtrapprox 20$.
Regarding organised structures of the near-wall flow, the low-speed streaks are well identified (delimited) by the average spanwise Mach number of negative-fluctuation events, i.e. the instantaneous contours  $M_x = \overline {M_x|_{M_{x}^{'}<0}}$, whereas the instantaneous contours $\nabla ^2_{xz}p'=0$ of the in-plane Laplacian determine the fronts between $( + / - )$- $p'$ events. At high $\bar {M}_{{CL}_x} \gtrapprox 2$ these $p'$-fronts appear organised as streamwise waves, with a bow shape between low-speed streaks, implying that they propagate faster in the high-speed region between streaks. More importantly, they extend across several streaks in the spanwise direction. When such organised $p'$-fronts dominate the flow field, high-intensity $( + / - )$- $v'$ events and $p'$-fronts are essentially collocated, explaining the symmetrisation of the $c_{p'v'}$-integrand (based on the joint p.d.f.s) which reduces $-c_{p'v'}$ towards $0$ with increasing $\bar {M}_{{CL}_x}$ and decreasing wall distance $y^\star$. At lower $\bar {M}_{{CL}_x} \lessapprox 1.5$, $p'$-fronts no longer exhibit this wave-packet-like structure, except for some relatively rare instances, but become elongated structures mostly aligned with the streaks which are no longer collocated with high-intensity $( + / - )$- $v'$ events.
Further research is required to identify the precise dynamics of these organised pressure waves, their interaction with the wall-normal vorticity  $\omega _y'$ structures which create the near-wall low-speed streaks, and their origin in a spanwise array of ( $+ / -$)- $\bar {M}_x$ mixing layers embedded in a strongly stratified mean flow, as well as the effect of the wall echo on $p'$ in this very-near-wall region. Obviously the near-wall compressibility effects are induced by a combination of mean-flow stratification (Morkovin Reference Morkovin1962) and compressible turbulence (fluctuating dilatation and fluctuating density). Specific source terms $(-\rho D_t\varTheta -D_t{\boldsymbol {V}}{\cdot }\mathrm {grad}\,{\rho })'$ are included in the Poisson equation for $\nabla ^2p'$ (Gerolymos et al. Reference Gerolymos, Sénéchal and Vallet2013, (A1c), pp. 45–46), and the Green's function solution for the corresponding contributions to $p'$ could contribute to assess the relative importance of each mechanism. Another, single-point-statistics approach, is provided by appropriate rewriting of the heat-conduction term $\overline {p'\partial _{x_\ell }q'_\ell }$ in the transport equation for $\overline {p'^2}$ (Gerolymos & Vallet Reference Gerolymos and Vallet2014, (4.11a), p. 740) to reveal the $\mathrm {grad}(1/\rho )$ terms hidden in $\partial _{x_\ell }T'$, accounting explicitly for stratification effects. Both these complementary approaches are the subject of ongoing research.
Funding
The computations reported in the present work were performed using HPC resources allocated at PRACE-JUWELS (project 2021-240083) GENCI-IDRIS/TGCC/CINES (grants 2010-022139 to 2021-022139) and at ICS-UPMC (ANR-10-EQPX-29-01).
Declaration of interests
The authors report no conflict of interest.
Data availability statement
Data will be made available at http://www.aerodynamics.fr/DNS_database/.
Author contributions
The authors are listed alphabetically and have both contributed equally to the entire work reported in the paper, and to writing the paper.


 Open access