


Between 1940 and 1945, industrial mobilization for WWII in the United States created an “arsenal of democracy:”Footnote 1 over 300,000 aircraft and bombers, 20,000 ships, nearly 90,000 tanks and 350,000 trucks, as well as 9 million rifles and machine guns, and 40 billion bullets, to equip 16 million servicemen (Klein Reference Klein2013, pp. 515–16). Abroad, the result was the defeat of the Axis powers. On the home front, observers at the time and a generation of historians since were left to consider whether mobilization fueled recovery from the Great Depression or facilitated the convergence of underdeveloped areas. Regional disparities in the United States in the first half of the twentieth century and convergence after 1940 provide a useful setting to evaluate the impact of coordinated investment and capital deepening on regional industrialization and catch-up.
A big push by government may be useful when private incentives alone are insufficient to spur growth (Rosenstein-Rodan Reference Rosenstein-Rodan1943; Nurkse Reference Nurkse1953; Murphy, Shleifer, and Vishny Reference Murphy, Shleifer and Vishny1989; Azariadis and Stachurski Reference Azariadis, Stachurski, Aghion and Durlauf2005). In the presence of fixed costs or spillovers from demand, agglomeration, financing, human capital, coordinated investment that aids the adoption of increasing returns technology can be socially beneficial. For example, government subsidies that lower the fixed costs of adopting new technology or public investment that provides infrastructure useful to firms in many sectors can help to facilitate industrialization.
This article uses newly assembled data on the value and location of investment due to WWII to assess the war's impact on regional industrialization and structural change in the southern economy after 1940. The empirical challenge is to identify the particular features of policies that help move a regional economy toward industrialization and whether there is the potential for big push dynamics. For the United States, recent research examines the contribution of government policies to local economic development (see surveys by Glaeser and Gottlieb Reference Glaeser and Gottlieb2008, Reference Glaeser and Gottlieb2009; Neumark and Simpson Reference Neumark, Simpson, Duranton, Henderson and Strange2015). This work follows a large literature in economics and economic history that aims to understand the role of specific aspects of the 1930s New Deal and mobilization for WWII during the 1940s in structural transformation and regional industrialization in the postwar period (Tindall Reference Tindall1967; Wright Reference Wright1986; Sosna Reference Sosna1987; Hooks and Bloomquist Reference Hooks and Bloomquist1992; Seltzer Reference Seltzer1997; Fishback, Horrace, and Kantor Reference Fishback, Horrace and Kantor2006; Bateman, Ros, and Taylor Reference Bateman, Ros and Taylor2009; Kitchens Reference Kitchens2014; Kline and Moretti Reference Kline and Moretti2014).
The new data together with cases studies of specific wartime investment projects have several advantages over previous research on the impact of WWII in the South. First, the data contain information on the value and location of individual investments associated with mobilization for WWII. In particular, I distinguish investment in structures from investment in equipment or spending on supply contracts to focus on the large shock to the South's capital stock as part of mobilization for WWII. If the key barrier to southern industrialization was the size of the fixed costs associated with adopting modern industrial technology, then new investment may have encouraged growth (e.g., in aircraft, automobiles, shipbuilding, synthetic rubber, and aluminum).
Second, prior to the New Deal and mobilization for WWII, firms and locales in the South were already involved in production related to national defense. This included government-owned, contractor-operated (GOCO), government-owned, government-operated (GOGO), and private industrial facilities. Differences in the level of prewar industrialization that are correlated with wartime investment will lead to potentially biased results when assessing the impact of WWII. To address this concern, I construct county-level measures of prewar industrial capacity based on the prewar Industrial Mobilization Plan and other prewar economic and demographic characteristics. I also include county-level fixed effects to control for remaining unobserved differences in prewar industrial capacity. Thus, the results of the empirical analysis reflect the additional contribution of wartime investment to regional industrialization and structural change.
Third, most firms that participated in mobilization for WWII received some form of subsidy for new plant construction or expansions of existing plants. However, the source of financing of the investment may have played a role in the postwar impact of this spending by giving firms more control over the composition of new investment. For example, investment directly financed by the federal government was typically attached to the production of specific goods that were not available through other channels. As a result, firms had less control over the details of the investment. In contrast, firms that received investment financed by the private sector were eligible for indirect subsidies (e.g., from the accelerated depreciation provisions of the 1940 Revenue Act), but subject to less oversight on the part of the military or civilian mobilization agencies. In this article, I exploit information on whether the source of financing was public or private to understand the role of these two channels for coordinating investment across the region.
Ultimately, mobilization for WWII generated substantial economic activity in the national economy between 1940 and 1945. The South accounted for 32.6 percent of total investment and 13.3 percent of government spending on WWII supply contracts. However, from the war's end until 1990, the empirical results indicate no statistically significant differential growth in county-level manufacturing due to WWII investments. Within manufacturing, I find some evidence for reallocation of activity across sectors; following the war the number of establishments in chemicals, rubber, stone, metals, machinery, and transportation equipment was higher. This suggests that wartime investment did facilitate a reallocation of manufacturing activity toward more modern sectors, but this did not consistently translate into more establishments and employment or higher wages and value-added at the local level.
Finally, I provide case studies to highlight two different paths following the construction of new plants related to mobilization for WWII. The case studies suggest that changes in the southern economy were closely related to the stimulus provided by the military-industrial complex. For example, wartime investment in Marietta, Georgia (Cobb County), attracted the Bell Aircraft Company to produce bombers. Over the postwar period, differences between Cobb and other counties in Georgia (including those that also received wartime investment) emerged and persisted. In Charleston, West Virginia (Kanawha County), firms clustered to create a booming synthetic rubber industry during the war, but this difference did not grow over time. Thus, although there is evidence of the war's effect in some counties, there is little support for the idea that mobilization alone fueled a long-run divergence across all counties that received wartime investment or new plants.
These findings are consistent with work that emphasizes mismatch between military and civilian uses together with high rates of depreciation (Higgs Reference Higgs1987; Field Reference Field2011; Rockoff Reference Rockoff2012) and also that wartime production achievements alone did not translate into growth outside the South (Rhode Reference Rhode, Guinnane, Sundstrom and Whatley2003; Fishback and Cullen Reference Fishback and Cullen2013).Footnote 2 The evidence provided in this article is consistent with the large discounts associated with WWII capital calculated by Gerald T. White (Reference White1980),Footnote 3 which may indicate that the scale or configuration of plants used in war production did not translate to production for civilian markets or that the deterioration of facilities due to high utilization during the peak war years was substantial.
This evidence does not rule out changes during the war years that benefited specific firms or sectors. Indeed, in shipbuilding and aircraft, large investments and a steady stream of supply contracts facilitated learning-by-doing in the adoption of mass production techniques and in government-owned facilities scientists and engineers worked to overcome temporary shortages in supplies of natural rubber. And these are just a few examples. Yet, the evidence does not point to mobilization for WWII creating regional industrial clusters. Instead, wartime investment went to locations within the South that were already manufacturing hubs and where the defense sector was present in the prewar period. Ultimately, a simple and decisive role for wartime capital deepening in the South's postwar industrial development should be viewed more skeptically.
HISTORICAL BACKGROUND
In the antebellum period, rapid economic growth in the South was not initially accompanied by large-scale industrialization. After 1880, the southern economy changed. A national market emerged to support a growing cotton textile sector, along with other industries closely linked to resource extraction. Attracted by local boosterism, mill villages sprang up across the South and rates of urbanization increased (although never to rates comparable to the North). Throughout this period productivity, capital investment, rates of new technology adoption remained low, and a diversified industrial economy that could serve as an engine of growth for the region did not emerge. As a result, income per capita in the South lagged behind the rest of the country before 1940 (Mitchener and McLean Reference Mitchener and McLean1999).
Nevertheless, the South was a beneficiary of the growth in the defense sector that began at the end of the nineteenth century and accelerated from WWI through the New Deal and WWII. Starting in the 1880s, Congress set out to rectify the deterioration of U.S. armed forces in the several decades after the Civil War. By the 1870s, the number of Navy vessels had decreased from 700 at the peak to less than 200 and the number of enlistments and officers was reduced more than fivefold, along with government supply contracts. Under the leadership of George M. Robeson, the Navy contracted for only ten new ships between 1869 and 1877, opting instead to refurbish the existing fleet in public and private yards across the country (Koistinen Reference Koistinen1998, pp. 19–20).
As of 1874, 16 firms were building the iron-hulled steamships that would launch a new era for the U.S. Navy. In the 1880s, particularly beginning with the appointment of Benjamin F. Tracy as secretary of the Navy, the shipbuilding program expanded rapidly. For the South, the entry of Newport News Shipbuilding in 1886 and the Drydock Company in 1891 increased the region's capacity to meet the growth in government demand (Koistinen Reference Koistinen1998, pp. 44, 48–49). The South also saw expansions in defense-industrial capacity outside of shipbuilding, including Du Pont plants in Nitro, West Virginia, and Nashville, Tennessee, and American Cyanamid Company in Muscle Shoals, Alabama (Wilson Reference Wilson2016, pp. 18, 25).
Despite the gains in the scale and technical sophistication of defense sector production, WWI highlighted inefficiencies in contracting and logistics (Koistinen Reference Koistinen1998, pp. 5–9). In addition, the aftermath of the war and charges of war profiteering revealed a growing political split over the role of the public ownership and production in matters of national defense and other sectors. For example, the Muscle Shoals site–including the explosives plant and eventual hydroelectric dam–was initially slated for sale to the private sector. However, this plan was halted in the wake of the Teapot Dome scandal and progressive concerns over private ownership (Wilson Reference Wilson2016, pp. 25–26). Muscle Shoals eventually provided the starting point for the growth in electrification under the Tennessee Valley Authority.
During the 1930s the debate over the interwar defense sector was folded into the growing political struggle over the New Deal. In both the 1920s and 1930s, a key point of contention was over the extent of public versus private control and the size of profits that would be allowed under defense contracts. In the mid-1930s, a Senate inquiry led by Gerald Nye (R-SD) publicized the large profits earned by firms such as Du Pont during WWI and called for reforms. However, specific recommendations from the Nye Committee were never enacted as civilian and military leaders preferred to maintain the public-private hybrid system of ownership and production in defense (Wilson Reference Wilson2016, pp. 34–41).
In March 1934, the passage of the Vinson-Trammell Act called for an even split between public and private yards in the construction of new warships, including the aircraft carriers Enterprise and Yorktown in Newport News, Virginia. This continued a long trend toward the build-up of the defense sector in the South and elsewhere prior to mobilization for WWII. Importantly, in the empirical analysis, I consider how differences in manufacturing capacity across southern counties under the Industrial Mobilization Plan influenced the effect of wartime investment after controlling for time-invariant characteristics and prewar cross-county differences.Footnote 4
During the New Deal, legislation was passed to address long standing regional imbalances.Footnote 5 For example, the Agricultural Adjustment Act sought to raise agricultural prices and encourage modernization on the farm, and the Tennessee Valley Authority aimed to improve infrastructure and provide cheap access to fertilizer and electricity. Still, in a speech on 4 July 1938 to a conference on the economic conditions of the South, President Franklin D. Roosevelt declared the region, “the nation's no. 1 economic problem” (Roosevelt Reference Roosevelt1938), and on the eve of WWII many observers concluded the South faced fundamental obstacles to economic development.
By the end of the war, spending on supply contracts and investment in new facilities and equipment in the South was more than $20 billion. Although the South as a whole received less than other regions, and southern cities received a smaller share than Detroit, Buffalo, Chicago, and Los Angeles, the gains were substantial relative to the prewar period. The southern trade magazine, Manufactures' Record, routinely boasted, “South's expansion breaks all records” (quoted in Schulman Reference Schulman1991, p. 95). Capital expenditures in the South, which made up roughly one-tenth of the national total in the prewar period, nearly doubled during the war. In total, the South accounted for 23.1 percent of wartime plant construction and 17.6 of expansions (U.S. War Production Board Reference Bateman and Taylor1945; Deming and Stein Reference Deming and Stein1949).Footnote 6
In some industries the South enjoyed a particular boom. The region dominated synthetic rubber and developed new competencies in steel and non-ferrous metals. Combat in the Pacific had cut off most supplies of natural rubber; alcohol and petroleum were necessary inputs into synthetic rubber and both were available in the South. And although the iron and steel industry continued to concentrate in the cities of the Upper Midwest, new centers were established along the Gulf Coast. The war created at least temporary clusters in other industries as well. In general, wartime expansion accounted for a large portion of newly available manufacturing capacity (Schulman Reference Schulman1991; Combes Reference Combes and Scranton2001). However, White (Reference White1980) puts the share of wartime expansion that was useful for peacetime production around 15 percent, while Paul A.C. Koistinen (Reference Koistinen2004, pp. 44, 48–49) argues the useful share was low but closer to one-quarter to one-third.
The pace of industrial expansion during wartime led one observer to declare that by the end of the war, “The South… in January 1945 was no longer the nation's no. 1 economic problem” (Rauber Reference Rauber1946, p. 1). Across the entire South, Figure 1 shows changes in manufacturing establishments, employment, wages, and value-added and output between 1880 and 1987. In some cases, civilian officials advocated for mobilization to consider “where industrialization during the defense period will contribute to a better long-run balance between industry and agriculture” and “the need for industrialization of certain regions” (quoted in Schulman Reference Schulman1991, p. 101). This was despite the fact that military planners were primarily interested in maximizing production, which initially delayed the flow of federal funds to the South, and were less interested in regional and economic development goals (Schulman Reference Schulman1991; Koistinen Reference Koistinen2004).
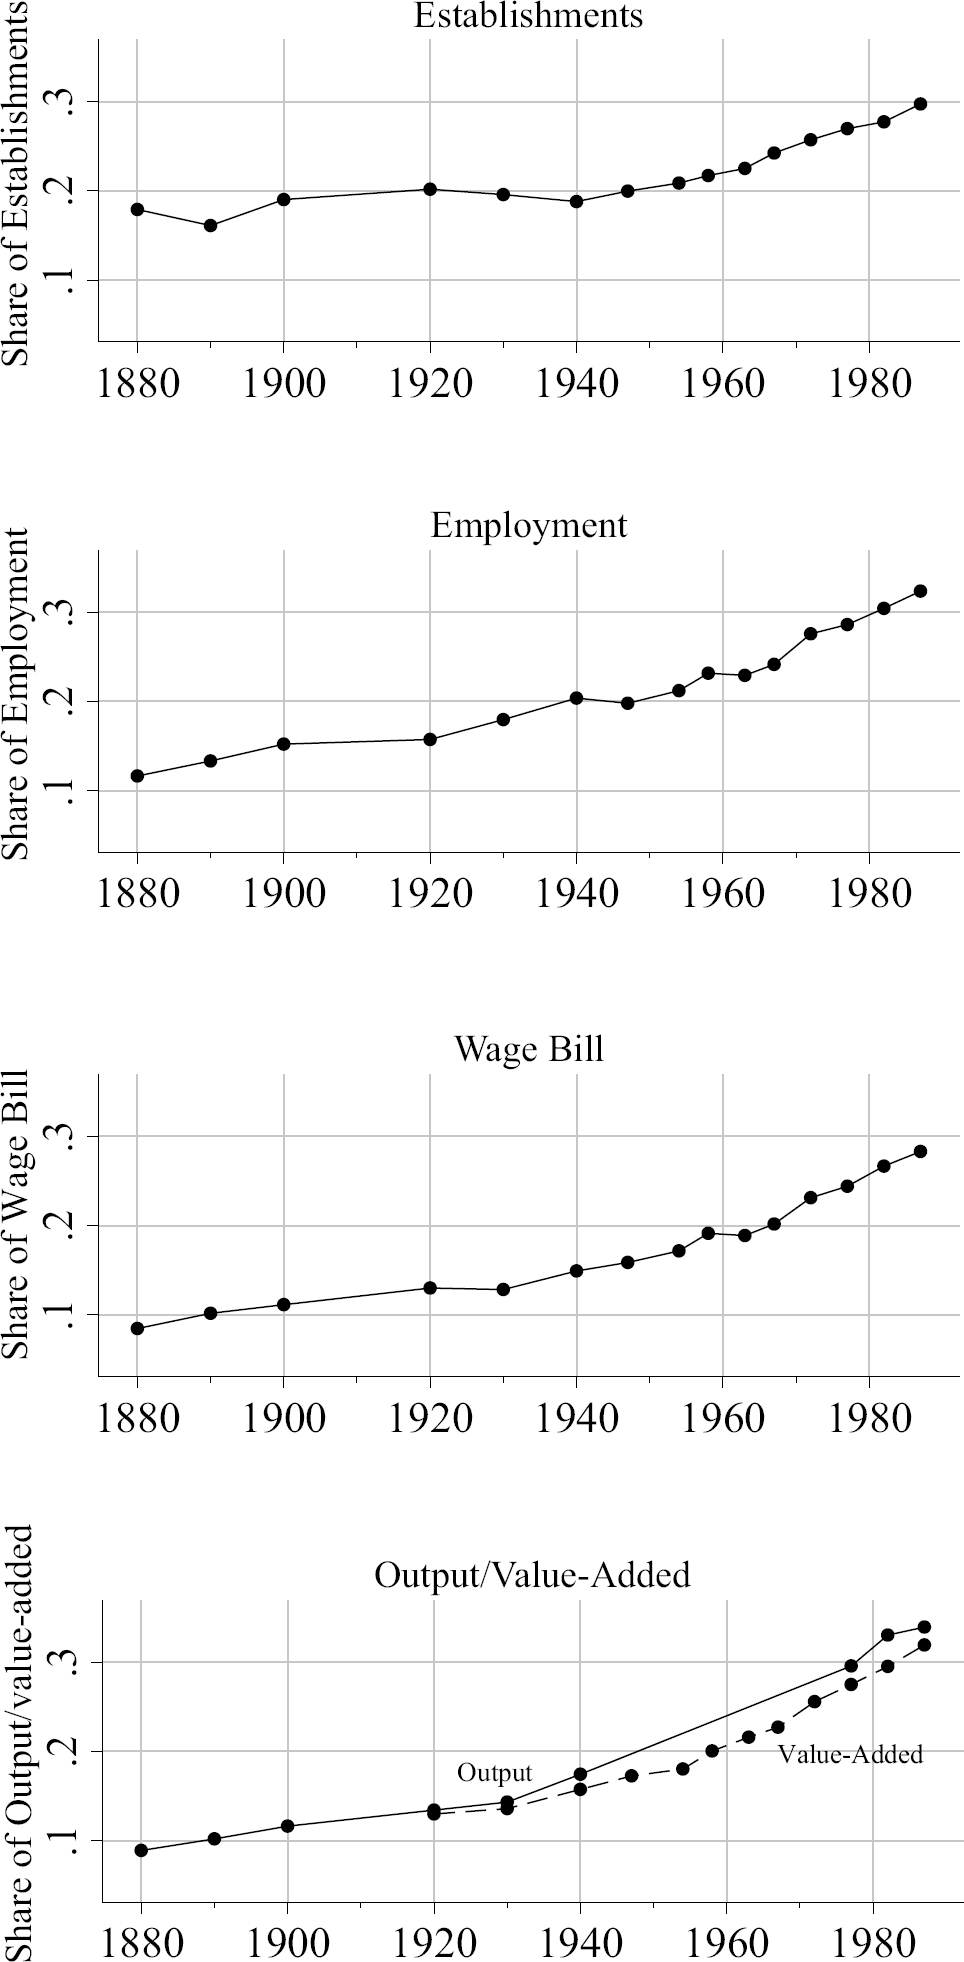
Figure 1 TRENDS IN AGGREGATE MANUFACTURING IN THE U.S. SOUTH
After the war, the southern economy expanded: income per capita converged to the national average and the region's share of manufacturing increased substantially. The South attracted modern industries, such as automobile assembly (Hülsemann Reference Caselli and John Coleman2001), and aggressively implemented policies to entice northern firms (Cobb Reference Cobb1982; Holmes Reference Holmes1998). However, the South's distinctiveness as a region did not dissipate (Wright Reference Wright and Scranton2001). In many cases, older patterns of production persisted along with exclusionary labor market policies (Ferguson Reference Ferguson and Scranton2001; Lewis Reference Lewis2007). The postwar economic development of the South was closely related to changing political-economic dynamics that directed a large share of federal defense spending to the South. However, the specific link between mobilization for WWII and the growth of manufacturing in the South in the postwar period remains an open question.
MOTIVATING THEORY
This article quantifies the spillovers associated with new facilities construction during WWII. The motivation for the empirical analysis is twofold. First, there is a large literature that provides conditions for big push policies to lead to industrialization (see the survey by Azariadis and Stachurski Reference Azariadis, Stachurski, Aghion and Durlauf2005). In one class of models, firms face uncertainty about the prospects for revenue from industrialization to cover fixed costs. Under the control of a social planner, investment coordinated across many sectors alleviates this uncertainty and industrialization occurs. During the 1940s, the federal government exercised unprecedented control over economy-wide allocation of resources. The empirical question is whether the coordination of investment during wartime was useful for overcoming the lack of industrialization in peacetime.
Second, coordinated investment may lead to industrialization if it creates agglomeration economies. In my setting, agglomeration-type spillovers may flow from wartime mobilization if new investment embodied new technology and forms of industrial organization relevant for peacetime, or if war production helped develop thicker markets for intermediate inputs. During WWII, manufacturing productivity increased due to wartime investment. After the war, capital owned by the government was sold off to private firms, usually at a discount, and firms redirected inputs toward output for consumer markets.
In the absence of consumption disamenities or agglomeration spillovers, the increase in productivity due to mobilization for WWII increases labor demand and, correspondingly, wages and housing costs. Alternatively, the war may have led to deterioration in the quality of hospitals, schools, and therefore offset the gains in productivity. The war may also have generated spillovers from improvements in worker training, intermediate input markets, transportation, and technology that continued to benefit manufacturers in the postwar period. As a result, wages may increase further to compensate for a decline in the value of consumption amenities or despite rising local input prices in response to the lasting benefits from the war economy.
To the extent that wartime investment facilitated a big push, I expect to see gains in the manufacturing outcomes combined with changes in the sectoral composition of manufacturing at the county level. Because I find little evidence of growth in local manufacturing activity due to WWII, I then provide evidence for reasons wartime mobilization did not lead to industrialization. In particular, I emphasize the role of control over the allocation of investment, the concentration of investment among a few firms, and the mismatch between technology relevant for military versus civilian uses. The evidence here suggests that the gains from mobilization were concentrated at the firm level. Recent work by Taylor Jaworski and Andrew Smyth (forthcoming) provides specific evidence that military contracts in the 1930s and 1940s enabled some firms to survive the postwar shakeout in the airframe industry.
DATA AND VARIABLES
The data for the empirical analysis are drawn from several sources. First, county-level information on manufacturing, wholesale and retail trade, and the housing sector is taken from Michael R. Haines (Reference Haines2010). In particular, I make use of information on manufacturing establishments, employment, wages, and value-added from 1920 to 1987. Similarly, for the wholesale and retail sectors, I use information on total sales, employment, and establishments over the same period. Second, I digitized county-level information on the number of establishments by manufacturing sector from various years of the Census of Manufactures as well as the Industrial Market Data Handbook of the United States (U.S. Department of Commerce Reference Fishback and Cullen1939).
Third, I collect data on the location of investment in structures from War Manufacturing Facilities (U.S. War Production Board Reference Bateman and Taylor1945). These data provide the most comprehensive view of individual investment projects during mobilization for WWII. For the main empirical analysis I construct a county-level variable, invest c equal to the aggregate value of investment in 1940 dollars in each county (plus one). Figure 2 shows the county-level variation in investment in structures used in the empirical analysis. These data also indicate whether the source of financing was directly public or private. Even when new establishments received financing directly from the private sector, the owner still benefited from indirect government subsidies due to, for example, accelerated depreciation. For this reason, although the main results aggregate both types of investment, I also examine differences in the effect of public and private investment separately.

Figure 2 WORLD WAR II INVESTMENT IN THE U.S. SOUTH
In addition, I collect information on the new plants constructed as part of mobilization for WWII from the War Industrial Facilities (U.S. Civilian Production Administration Reference Ferguson and Scranton1946). I also conduct a separate analysis using new plants as the measure of WWII mobilization and discuss case study evidence for the impact of the largest of new plant in two states to understand potential heterogeneous impacts.
Finally, to construct a measure of prewar manufacturing capacity related to military production I use the Industrial Mobilization Plan collected by Price V. Fishback and Joseph A. Cullen (Reference Fishback and Cullen2013). These data give the number of existing establishments assigned to each branch of the military in the event of war mobilization plans set up in the 1930s from the U.S. Joint Army and Navy Munitions Board (Reference Roosevelt1938). As additional county-level controls, I include information from 1940 on population density, the share of population living urban area as well as the foreign and African-American population shares from Haines (Reference Haines2010).
EMPIRICAL FRAMEWORK
As a starting point for empirical analysis, I quantify the size of spillovers from investment in structures due to mobilization for WWII. Specifically, I regress the log of a given manufacturing outcome, Y ct , for county and year on the log of total value of investment in new manufacturing facilities constructed during WWII interacted with year fixed effects:

The b t coefficients trace out changes in manufacturing over time due to differences in the extent of investment from WWII. This specification focuses on investment in structures as distinct from investment in equipment, which could have been and was redeployed elsewhere at the end of the war. I take the log of wartime investment (plus one) so that the b t coefficients are interpreted as elasticities.Footnote 7
County fixed effects included in equation (1) control for county characteristics that are time-variant. In addition, state-year effects control for unobserved differences at the state level that impact the growth of manufacturing at the local level. This is important in the postwar period in the South where changes in state right-to-work and industrial recruitment laws may have played a substantial role in the growth of manufacturing (e.g., Cobb, Reference Cobb1982; Holmes, Reference Holmes1998). Equation (1) also includes controls for prewar differences in county characteristics, X c , that may predict differential growth in the postwar period. In particular, X c includes population density and urban shares of the county population in 1940 to control for differences in postwar industrialization in the South due to urbanization across the region; I also include the African-American and foreign-born population shares in 1940 to control for the role of demographic composition in industrialization; finally, I include second-order polynomials in latitude and longitude to allow for topographical and climatic differences that may have directly or indirectly affected the attractiveness of a county for new plant location.Footnote 8 The variables included in X c are fixed at their 1940 values and so are interacted with year fixed effects to allow for their impact to be different in each time period.
In addition, in X c , I include the value of government spending on WWII supply contracts interacted with year fixed effects to ensure that my results are robust to the other major government spending associated with mobilization for WWII.Footnote 9 I also examine robustness to including the presence of military bases, which Bruce J. Schulman (Reference Schulman1991) discusses as an important development for the postwar southern economy, and New Deal policies as part of the Agricultural Adjustment Act and Tennessee Valley Authority, which may have affected the pace of structural trans-formation (Alston Reference Alston1981; Whatley Reference Whatley1983; Schulman Reference Schulman1991; Fishback, Horrace, and Kantor Reference Fishback, Horrace and Kantor2005; Kitchens Reference Kitchens2014; Kline and Moretti Reference Kline and Moretti2014).
To be clear, the identifying assumption for equation (1) is that in the absence of new investment during WWII, relative changes across southern counties would otherwise have been the same for counties that received different amounts of WWII investment. This assumption is weakened with the inclusion of county fixed effects, state-year fixed effects, and prewar county control variables. In practice, this assumption is violated if war planners decided the placement of new facilities with domestic goals in mind. Overall, the discussion of the mobilization program by Koistinen (Reference Koistinen2004)–centralized control in the military rather than the civilian bureaucracy–suggests the location of new facilities was not motivated by economic development objectives. Instead, planners aimed to maximize production of standardized and relatively high quality products. In this case, the concern is that characteristics correlated with planners’ ability to achieve these objectives were also correlated with growth potential and, thus, lead to overstating the contribution of wartime investment to industrialization. In some instances, lobbying by local communities may have led to the placement of a war-related plant (Schulman Reference Schulman1991). To examine effectiveness of these efforts, I also present statistical and case study evidence for the impact of newly constructed plants as part of wartime mobilization.
In the absence of exogenous variation in WWII investment a descriptive interpretation of the results from equation (1) is still useful. In particular, the empirical specification quantifies whether counties that received wartime investment were differentially responsible for the postwar growth in the South's share of manufacturing. Even if the observed changes do not reflect a causal effect, the lack of statistically significant differences documented in the next section suggests the long-run path of southern industrialization was not substantially altered by WWII. This type of analysis cannot rule out a relationship between WWII and local economic activity due to, for example, postwar government contracts that prevented the decline of manufacturing in some areas. However, in general, the evidence I present is not consistent with postwar industrialization of the American South due to WWII investment.
Finally, as an alternative to equation (1), I estimate a specification that exploits additional information available due prewar planning under the Industrial Mobilization Plan. In particular, as part of preparation prior to the outbreak of WWII, war planners surveyed industrial capacity relevant for military production in the event of sudden mobilization. The survey gives the number of existing plants that would be fully or partially allocated for war production. That is, the survey indicates war-related capacity that existed (and would have continued to exist) in the absence of mobilization for WWII. Previously available industrial capacity may have interacted with new capital investment due to mobilization and, thereby, helped to facilitate postwar industrialization. To examine this potential mechanism, I estimate the following equation:
In equation (2), in addition to wartime investment, I also include an indicator variable for whether a county had capacity allocated under the Industrial Mobilization Plan and the interaction between investment and presence of facilities allocated under the Industrial Mobilization Plan.
Before showing the main results in the next section, Table 1 presents an analysis of the relationship between investment spending and pre-war characteristics. Each column shows the results from regressing wartime investment on government spending on supply contracts, indicators for whether a county at least one facility in the Industrial Mobilization Plan, and a given manufacturing outcome in 1920. The results show the positive relationship between wartime investment and prewar manufacturing outcomes, which highlights the importance of using data before and after WWII to control for preexisting differences across counties.
Table 1 DETERMINANTS OF WARTIME INVESTMENT
Notes: Each column shows the results of regression of log of wartime investment, ln(invest + 1), on prewar county characteristics. ln(contracts +1) is the value of government spending on supply contracts. Indicator variables are included for the number of facilities assigned under the Industrial Mobilization Plan. The remaining entries are the lagged number of establishments (column 1), employment (column 2), wages (column 3), and value-added (column 4) in 1920. All regressions include prewar county characteristics and state fixed effects. Standard errors (in parentheses) are clustered at the state level. The number of sample counties is 1,086.
Sources: See text of the Data and Variables section.
Table 1 also shows a positive relationship between wartime investment and contracts spending. Finally the presence of facilities allocated under the Industrial Mobilization Plan is positively correlated with wartime investment. Although this relationship is not statistically significant, the coefficient is large, which suggests that despite the fact that the Industrial Mobilization Plan was not formally used to organize mobilization it may still reflect characteristics of a county targeted in deciding the most effective way to carry-out mobilization, which is consistent with the motivation for estimating equation (2) earlier.
RESULTS FOR MANUFACTURING OUTCOMES
The Impact of WWII Facilities Investment
The previous literature aimed to quantify the impact of WWII by focusing only on postwar differences in manufacturing activity across counties and states that received more or less wartime government spending (Hooks and Bloomquist Reference Hooks and Bloomquist1992; Hooks Reference Hooks and Scranton2001; Bateman, Ros, and Taylor Reference Bateman, Ros and Taylor2009). To illustrate my approach in relation to this literature, I estimate equation (1) excluding county fixed effects and plot the coefficients on ln(invest c + 1) in Figure 3 for the log number of manufacturing establishments, employment, wage bill, and value-added. This specification controls for state-year fixed effects and so does not attribute differences in manufacturing activity at the state level to mobilization for WWII.
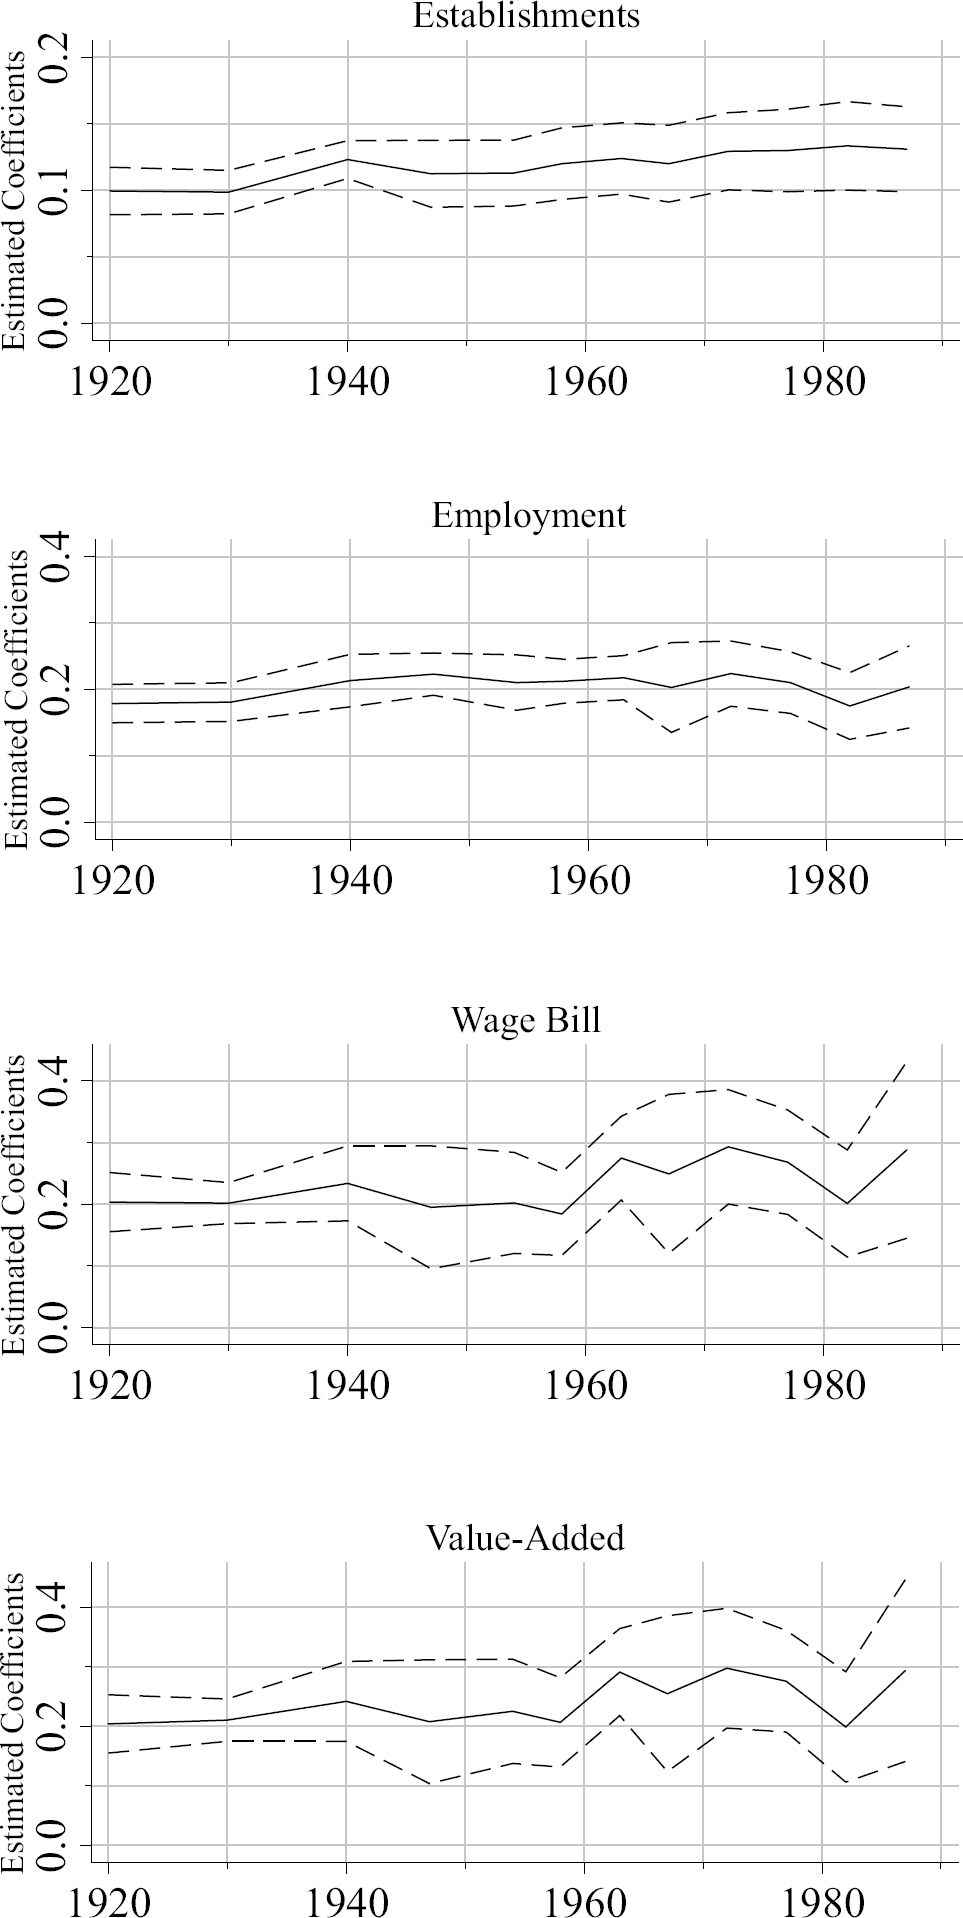
Figure 3 RELATIONSHIP BETWEEN WARTIME INVESTMENT AND PRE- AND POST-WAR MANUFACTURING
A few interesting patterns emerge from this comparison. First, each panel shows a clear relationship between the extent of prewar industrialization and war-related government spending. For example, a county that eventually received 10 percent more in wartime investment had up to 2.5 percent more value-added between 1920 and 1940. These existing differences motivate the inclusion of county fixed effects and prewar county characteristics when estimating equation (1). A second noteworthy feature of Figure 3 is the absence of change between the prewar and postwar periods. The remainder of this sub-section provides additional statistical evidence for the patterns in Figure 3.
The panels of Figure 4 show the results from estimating alternative versions of equation (1) including county fixed effects with manufacturing establishments, employment, wage bill, and value-added as the dependent variable. In each panel, the coefficient for the interaction of ln(invest c + 1) with 1940 is excluded; the remaining coefficients should be interpreted as the difference relative to 1940. The solid black line shows the estimated coefficients on wartime investment for each year in the sample from a specification that includes state-year and county fixed effects as well as prewar county characteristics (interacted with year effects); the corresponding 95 percent confidence interval is given by the dashed black line.
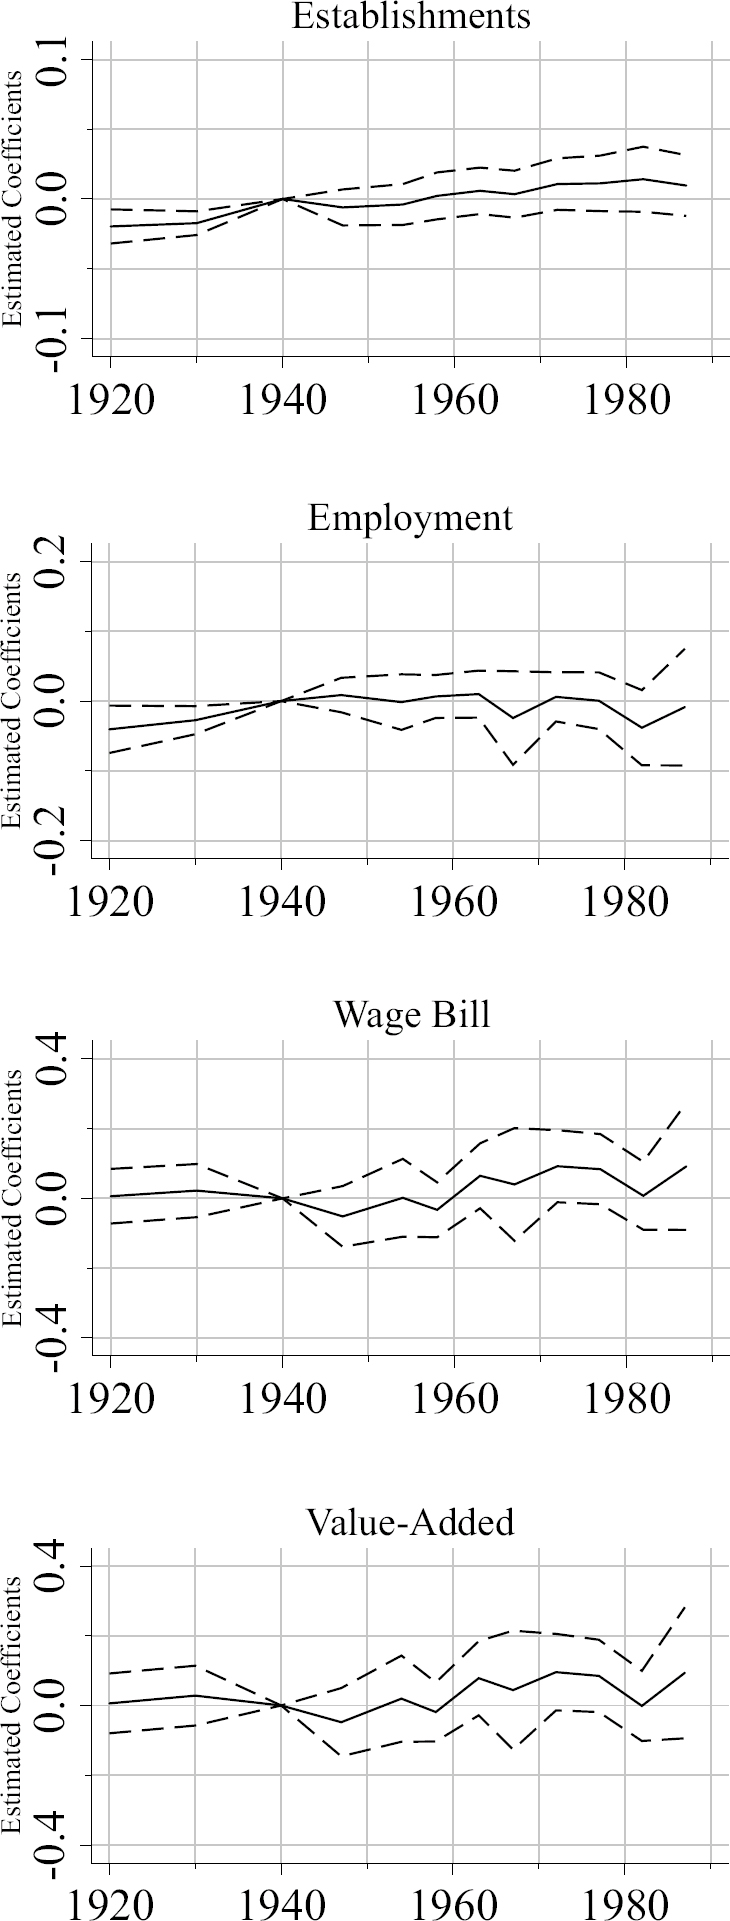
Figure 4 IMPACT OF WARTIME INVESTMENT ON MANUFACTURING
Overall, the results in Figure 4 do not show a clear break in southern manufacturing activity associated with wartime investment. To conduct hypothesis testing and provide a quantitative interpretation of the results, Table 2 shows the estimated coefficients for each year from the specification that includes county fixed effects, state-year fixed effects, and county-level control variables. The only effects that are statistically significant at the 10 percent are found in 1972: a 10 percent increase in wartime investment increases the wage bill by 0.922 percent and value-added by 0.956 percent. Otherwise, the estimated coefficients reported in Table 2 tend to be small or negative.
Table 2 IMPACT OF WARTIME ON MANUFACTURING

Notes: Each column shows the results of estimating equation (1) for the log of different manufacturing outcomes: establishments (column 1), employment (column 2), wage bill (column 3), and value-added by manufacturing (column 4). All columns are from a specification that includes state-year and county fixed effects as well as county-level controls (interacted with year fixed effects). The years included are 1920, 1930, 1940, 1947, 1954, 1958, 1963, 1967, 1972, 1977, 1982, and 1987. Standard errors (in parentheses) are clustered at the state level. The number of sample counties is 1,086.
Sources: See text of the Data and Variables section.
In some cases, imprecise estimates imply that larger effects cannot be ruled out, which suggests substantial heterogeneity in the postwar experience of counties that received WWII investment. I further explore this heterogeneity by considering differences in the source of financing of investment and the characteristics of counties prior to 1940 that may have influenced postwar industrial development.
First, in terms of investment, projects where the direct source of financing was either public or private may indicate more (public) or less (private) scope for coordination and oversight. Frederick L. Deming and Weldon A. Stein (Reference Deming and Stein1949 pp. 3, 12) describe how both privately and publicly financed projects ultimately received some form of government subsidy indirectly through the accelerated depreciation provisions of the 1940 Second Revenue Act or directly. The results in Figure 5 allow the effect of investment to vary by public (black) and private (gray) sources of financing. Investment financed by the public sector shows positive effects in the immediate aftermath of WWII, but these effects do not persist. In contrast, privately financed investment has a negative effect initially, but turns positive after 1960. Although these effects are generally small and not statistically significant they are suggestive of the potential role of coordination in choosing investment projects.
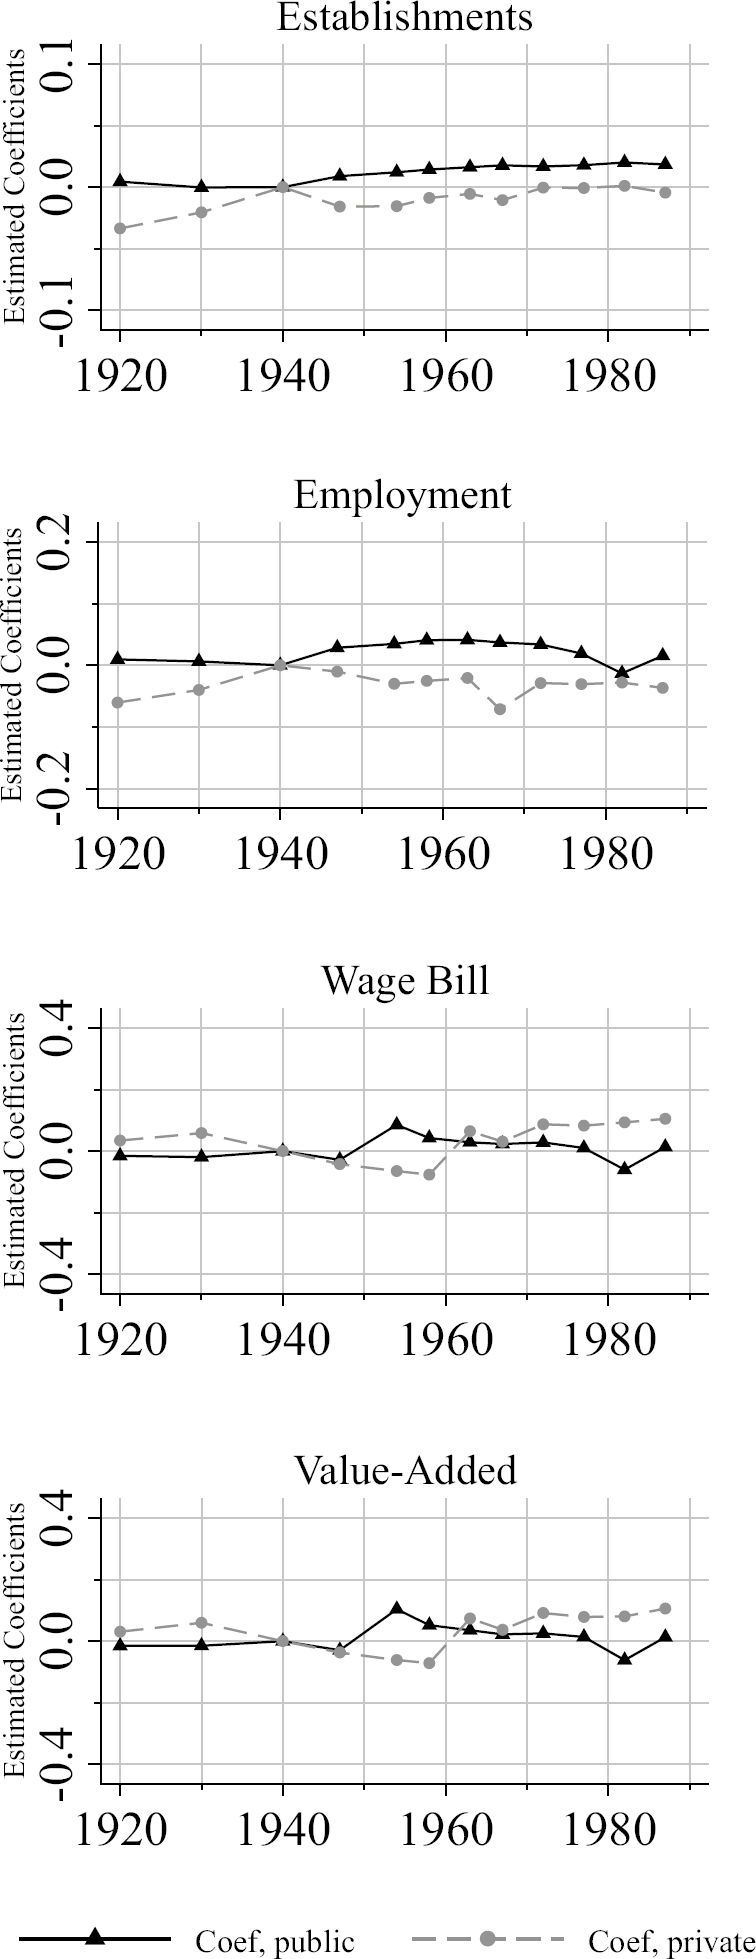
Figure 5 IMPACT OF PUBLIC VERSUS PRIVATE WARTIME INVESTMENT
Second, in terms of heterogeneity across counties, equation (2) described in the previous section allows for differences in the effect of wartime investment based on the extent of prewar capacity for mobilization as identified by the Industrial Mobilization Plan. In the Online Appendix, Figure A4 shows the estimated coefficients on ln(invest c + 1) in Panel A, on IMP c in Panel B, and on their interaction in Panel C, for each year. To understand the role of heterogeneity across counties, I test the null hypothesis that the sum of the coefficients on ln(invest c + 1) and its interaction with IMP c is greater than zero, which captures the marginal impact of investment in counties with at least one plant allocated under the Industrial Mobilization Plan. To summarize these results, I conduct joint hypothesis tests on the sum of the coefficients for 1947–1958, 1963–1972, and 1977–1987. Only the null hypothesis for employment for 1963–1972 could be rejected at the 10 percent level.
In the absence of a clear break in manufacturing activity as a whole it is important to also consider changes in the composition of manufacturing establishments by sector. In this context, although the previous results suggest that WWII did not create immediate gains for manufacturing as a whole, it may have led to the reallocation of establishments toward higher value-added sectors. To assess the impact of war-related investment across manufacturing sectors, each column of Table 3 shows the results from regressions of the number of manufacturing establishments in a given sector. These results provide evidence that investment during WWII changed the composition of southern manufacturing in the first part of the postwar period. The estimated magnitudes for lumber, chemicals, rubber, stone, metals, machinery, and transportation equipment are statistically significant and economically large: a 10 percent increase in wartime investment increases the number of establishments between 0.460 (in rubber) and 5.871 (in metals).
Table 3 IMPACT OF WARTIME ON ESTABLISHMENTS BY SECTOR
Notes: The dependent variable in each column is the number of establishments in a given sector. All columns include county fixed effects, state-year fixed effects, and prewar county characteristics interacted with year effects. The years included are 1935, 1939, 1947, 1954, and 1958. Standard errors (in parentheses) are clustered at the state level. The number of sample counties is 1,086.
Sources: See text of the Data and Variables section.
These sectors represented a small share of southern manufacturing prior to the out-break of WWII and expanded after 1940. The estimated effects are consistent with their role in the war effort (Deming and Stein Reference Deming and Stein1949). Importantly, these results suggest that despite the war's limited role in local economic development of manufacturing in the South and elsewhere, investment and government demand may have played a role in the growth of particular industries. For example, this appears to have been the case in aluminum, synthetic rubber, and the production of aircraft, among others (Koistinen Reference Koistinen2004). Still, this reallocation of manufacturing activity across sectors did not translate into substantial growth in the overall number of manufacturing establishments, employment, wages, or value-added.
The Impact of WWII Plant Expansions
The previous section focused on the total value of wartime investment in facilities and supply contracts as a potential catalyst for the postwar industrialization of the American South. Yet, in some cases, the positive impact of mobilization for WWII may have been concentrated in counties that only received entirely new plants. This was the case in roughly 100 southern counties, including aircraft in Forth Worth, Texas (Tarrant County) and Marietta, Georgia (Cobb County), explosives in Sylacauga, Alabama (Talladega County) and Morgantown, West Virginia (Monongalia County), aluminum in Jones Mill, Arkansas (Hot Springs County), and synthetic rubber in Charleston, West Virginia (Kanawha County) and Louisville, Kentucky (Jefferson County).
Attracting big, national deep-pocketed firms to the South may have stimulated demand for intermediate inputs, increased local labor market thickness, or facilitated learning across establishments. Alternatively, large firms with scale economies may crowd-out local entrepreneurs by restricting access to inputs and financial capital or exercising monopoly power in output markets (Chinitz Reference Chinitz1961; Glaeser, Kerr, and Kerr Reference Glaeser, Sari and Kerr2015). More directly, Ann Markusen, Peter Hall, Scott Campbell, et al. (Reference Markusen, Hall and Campbell1991) provide evidence that firms associated with the postwar military-industrial complex exercised market power. Figures 6 and 7 provide case studies of two counties in West Virginia and Georgia with newly constructed plants during WWII. The figures follow the postwar manufacturing outcomes of these counties and compare their performance to other counties in the same state.
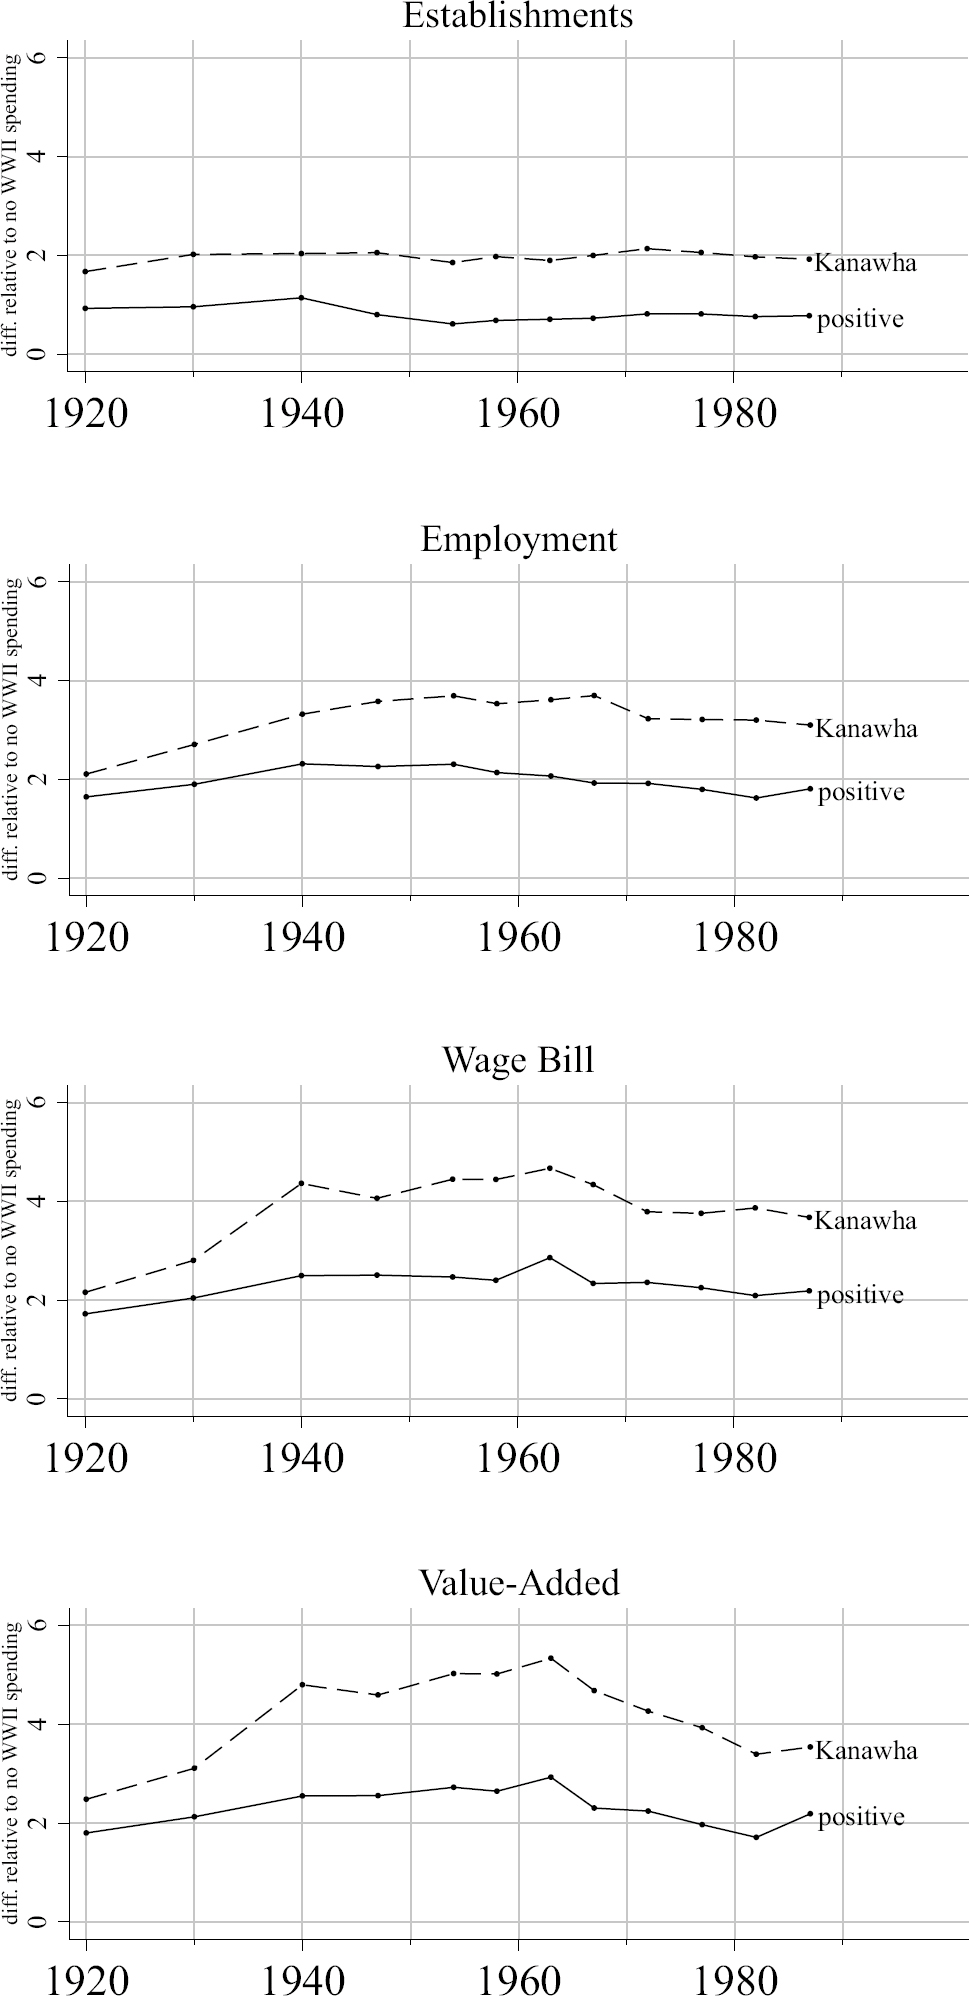
Figure 6 CASE STUDY OF KANAWHA COUNTY (WEST VIRGINIA)
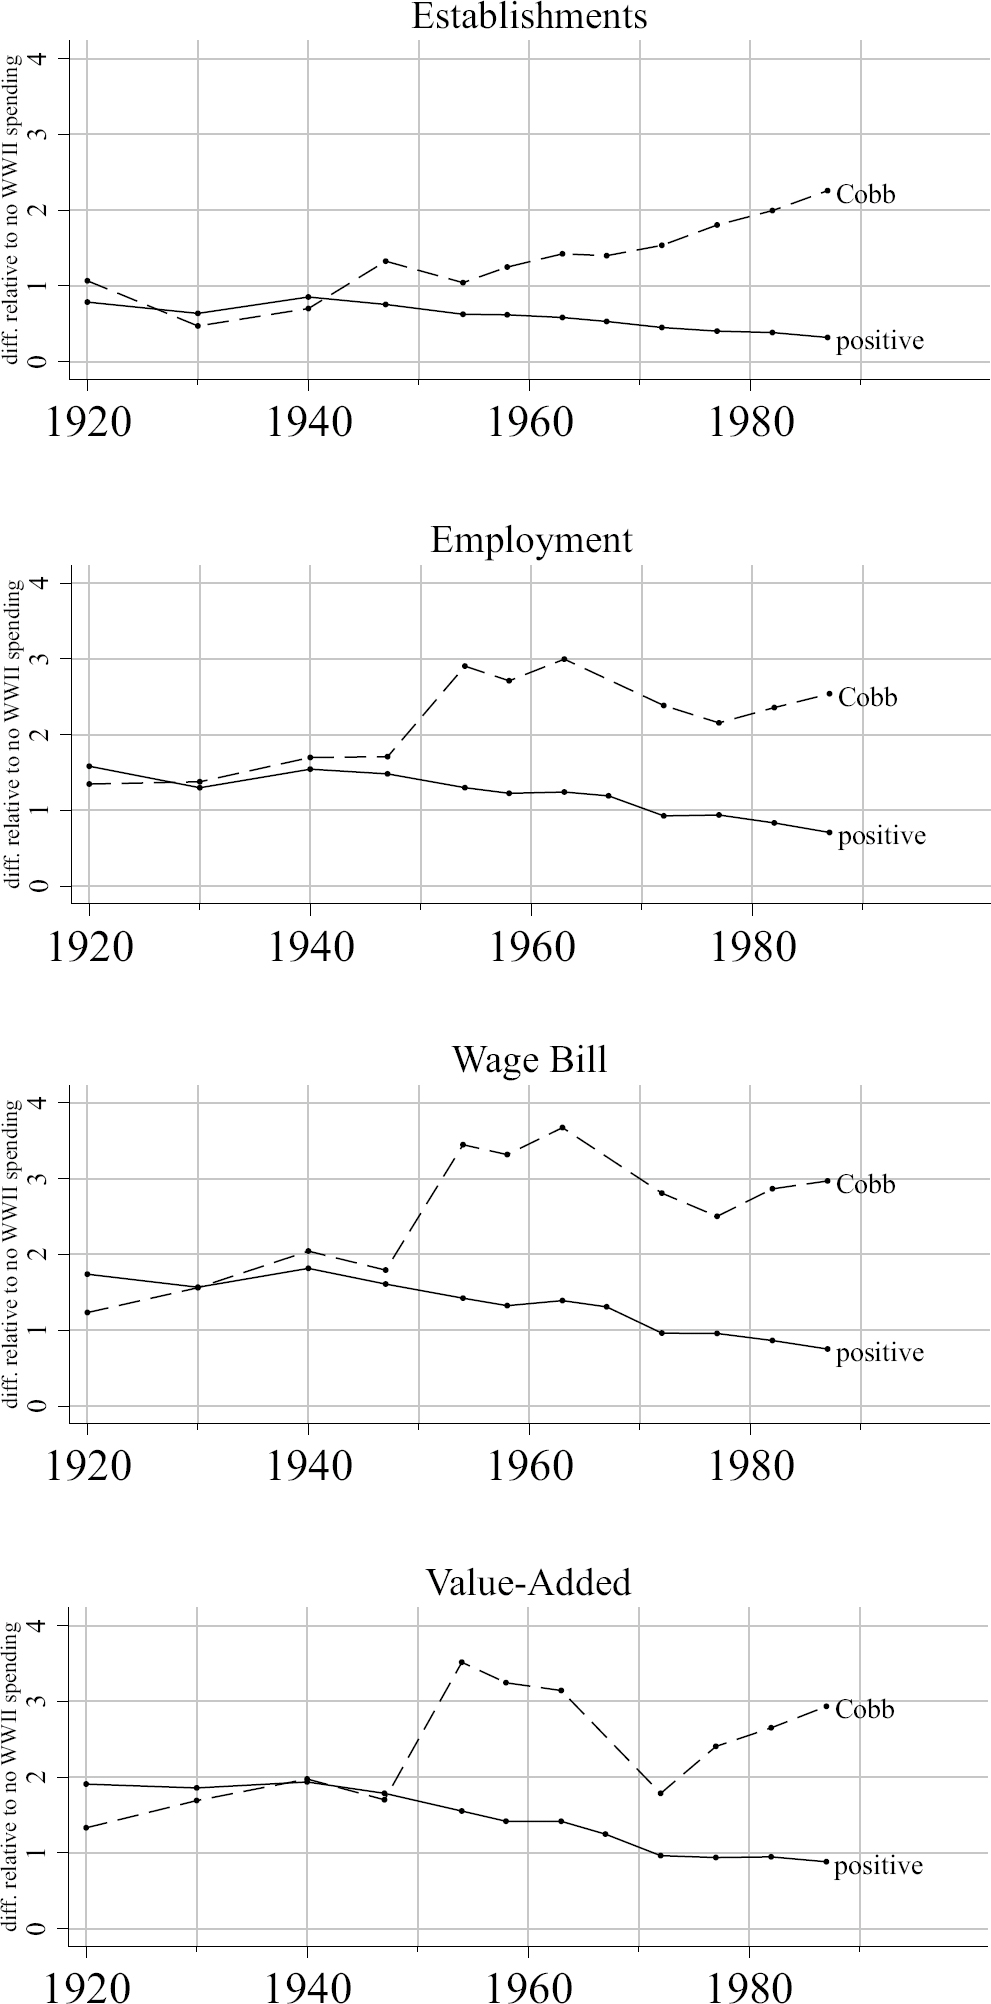
Figure 7 CASE STUDY OF COBB COUNTY (GEORGIA)
The panels of Figure 6 compare manufacturing activity in Kanawha County, West Virginia, and the rest of the counties in the state that received investment with counties that received zero investment. Kanawha County was the site of a new synthetic rubber plant operated by Union Carbide and Carbon Corporation. The mass production of synthetic rubber was an outgrowth of mobilization for the war. During the 1920s and 1930s, Standard Oil of New Jersey monopolized the related intellectual property through contracts with the Germany's IG Farben. From the early 1940s, due to antitrust actions on the part of the Justice Department and coordination of mobilization agencies–including the Industrial Materials Division, which created the Synthetic Rubber Committee–production was turned over to a group of companies, among them Union Carbide and Carbon with a new plant in Kanawha County, West Virginia (Koistinen Reference Koistinen2004, pp. 150–57). The lines in Figure 6 show that neither Kanawha County (dashed) nor the remaining counties that received wartime investment (solid) grew more rapidly after WWII relative to counties that received no wartime investment.
In contrast, the panels of Figure 7 show manufacturing activity in Cobb County, Georgia, which exhibits more postwar industrialization than other counties in the state. Richard S. Combes (Reference Combes and Scranton2001) describes the efforts on the part of local politicians that led to the opening of a Bell Aircraft plant in Marietta (Cobb County) in early 1942. The plant, which manufactured the B-29 during the war, grew from 1,179 employees to 17,094 by the end of 1943 and eventually reached an employment peak of more than 20,000. In part, the tremendous growth of manufacturing reflected in this and other accounts of the wartime South (see Schulman Reference Schulman1991) helped reinforce the view of structural transformation fueled by WWII investment. In the case of Bell Aircraft in Georgia and other newcomers to advanced manufacturing across the South, the war appeared to bring demand and training for new skills.
From the panels of Figure 7, Cobb County (dashed line) and the remaining counties with some wartime investment (solid line) show divergence, which suggest the plant contributed to postwar growth of manufacturing in Cobb County. Importantly, surges in employment, the wage bill, and value-added in the 1950s and 1970s were largely due to government contracts with the Lockheed Corporation for the C–130, C–141, and C–5B. Thus, at least for Cobb County, Figure 7 shows the legacy of WWII investment was positive and closely tied to the postwar military-industrial complex (Combes Reference Combes and Scranton2001).
These case studies present two alternative scenarios for the impact of new plant construction as part of wartime mobilization. To test for the impact of new plants, I estimate the following equation:
which replaces ln(invest c + 1) with an indicator, plant c , for whether wartime investment reflected the construction of a new plant. Figure 8 shows the results from plotting the coefficients on plant c for each year and manufacturing outcome. Each regression includes county and state-year fixed effects as well controls for prewar county characteristics (interacted with year fixed effects). In each panel the results show no evidence of a prewar trend and no statistically significant impact of large WWII plants. The large standard errors mean I cannot rule out positive effects for some counties, possibly stemming from the Cold War build-up and growth of the military-industrial complex in the postwar period. But the results suggest no systematic impact of WWII investment alone on southern industrialization. In the absence of demand through government contracts, many local entrepreneurs elected to return to prewar activities in non-manufacturing sectors or specialize in types of production spillovers to the local economy were limited.
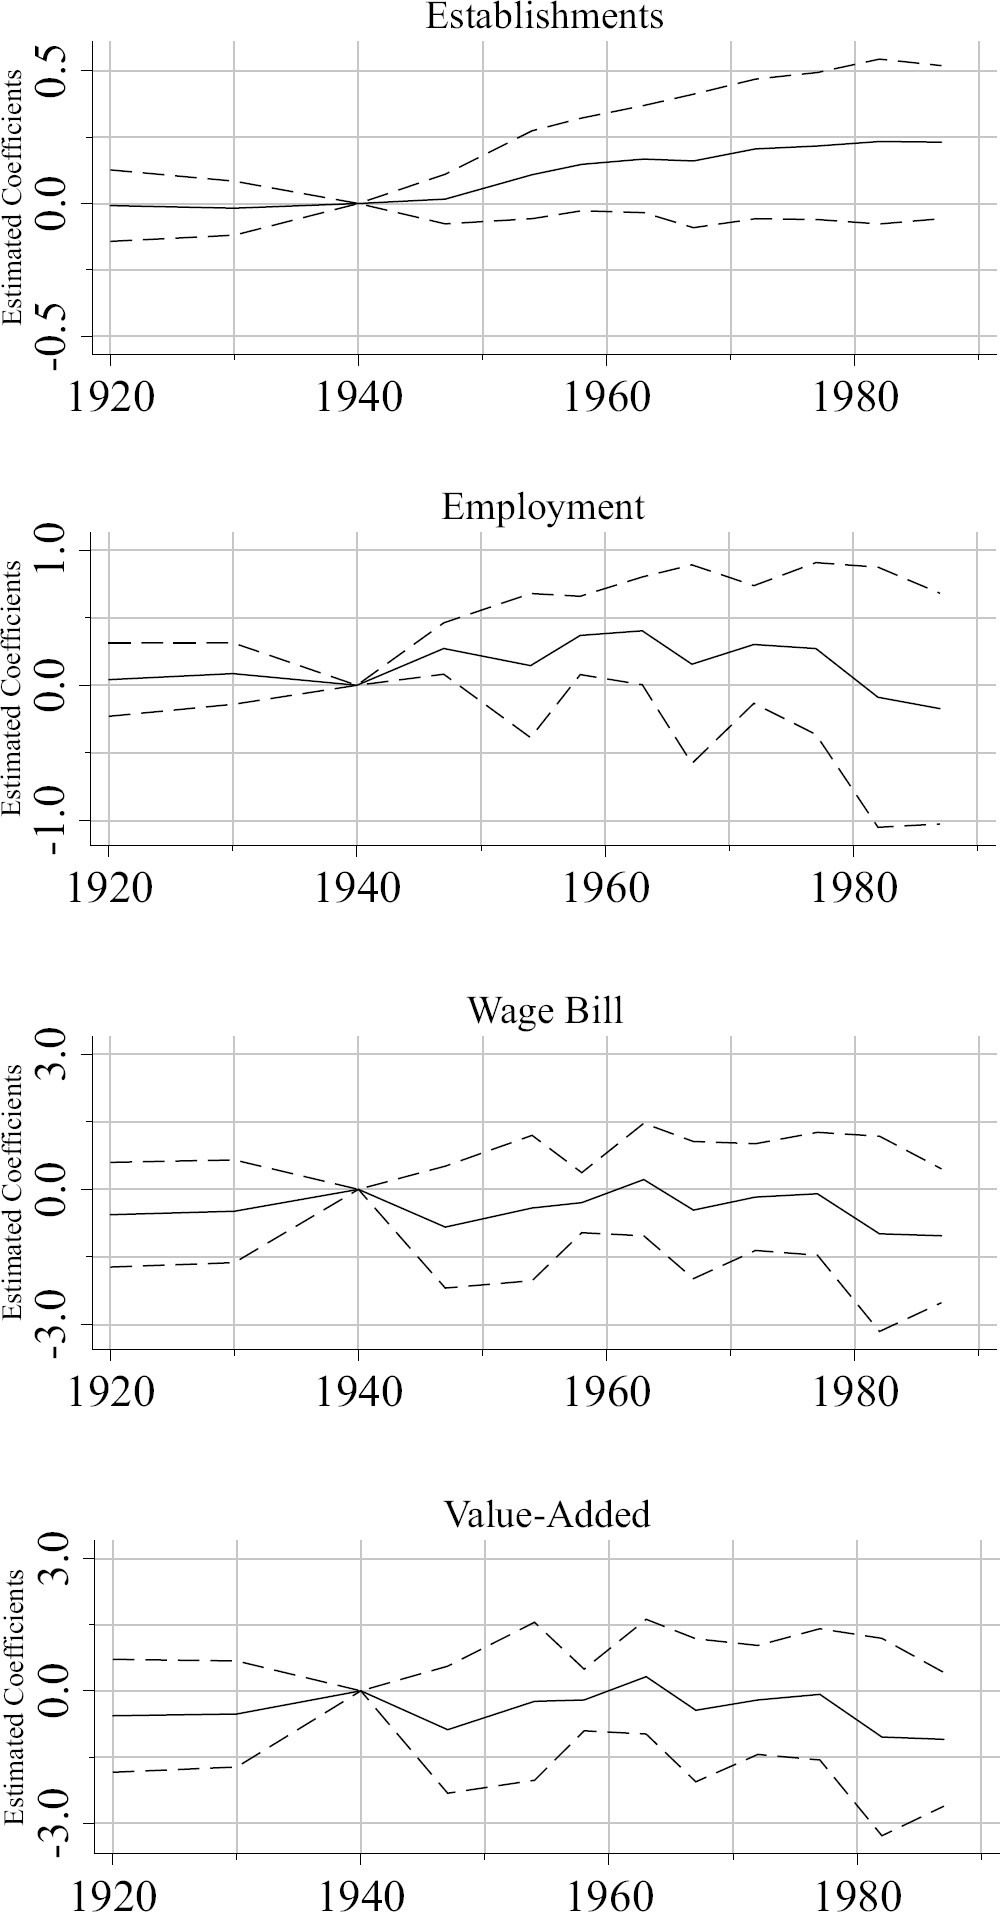
Figure 8 IMPACT OF WARTIME PLANTS ON MANUFACTURING
Overall, WWII investment may have been too specific to military production or utilized to the point of near complete depreciation as a result of two- or three-shift runs during the mobilization period (Higgs Reference Higgs2006; Field Reference Field2011; Rockoff Reference Rockoff2012). This is consistent with the substantial discounts tabulated by White (Reference White1980, p. 104) that were applied to the sale of surplus property in the postwar period: his estimates as a share of initial spending range between 12 and 50 percent. This is also in line with evidence from Valerie A. Ramey and Matthew D. Shapiro (Reference Ramey and Shapiro2001) for the reallocation of capital following a downturn in the aerospace industry in the 1990s due to demobilization from the Cold War. For WWII, specific projects may have been beneficial, but the typical county experienced few or no gains.
Robustness to Controlling for the New Deal and Military Bases
Prior to WWII, the onset of the Great Depression hit Southern agriculture and industry hard. The price of cotton and other agricultural commodities plummeted and, as a result, farm incomes in 1929 were at their lowest level in three decades (Schulman Reference Schulman1991, p. 14, footnote 48). In addition, high rates of unemployment among industrial workers and persistent regional wage differentials attracted the attention of national policymakers. Starting in 1933, Congress passed several pieces of legislation. For example, the Agricultural Adjustment Act (AAA) sought to reduce crop production and raise commodity prices through payments to farmers, while the Tennessee Valley Authority (TVA) worked to improve infrastructure and provide cheap access to electricity.
These policies along with technological change contributed to a reorganization of the Southern economy that played out fully over the subsequent decades. For example, mechanization replaced labor in pre-harvest cotton operations, which reversed previous trends toward a large number of tenants distributed among smaller sized farms and began to break- down landlord-tenant relations (Alston Reference Alston1981; Whatley Reference Whatley1983).Footnote 10 Throughout the 1930s the TVA sought to attract more small industry (e.g., hosiery, textile, and lumber mills) that would provide employment for surplus agricultural labor (Schulman Reference Schulman1991, p. 35). After the outbreak of WWII the TVA began to pursue a policy based on a close link between electricity, industrialization, and economic growth.Footnote 11 As a result, it is important to control for differences in New Deal policy across southern counties that may also be correlated with differences in war-related investment.
In addition to differences in New Deal policy, other aspects of mobilization for WWII may have played a role in the postwar growth of manufacturing. For example, the war increased the number of military bases in the region, which may have stimulated local demand or encouraged the siting of new manufacturing plants (Schulman Reference Schulman1991). In the Online Appendix, results presented in Table A1 show that including all of these controls together does not alter the main conclusions.
POPULATION, HOUSING, WHOLESALE, AND RETAIL
The results from the previous section show little impact of WWII investment on southern industrialization. However, this does not rule out changes in other aspects of the region's economy. The immediate impact of mobilization for war was a booming economy that provided a job to anyone willing to work and, in many cases, willing to move. Some workers left altogether while others moved within the region to take advantage of higher paying jobs associated with war production in southern cities. This section documents population movements together with the war's impact on the housing, wholesale, and retail sectors.
Table 4 presents the results of replacing the dependent variable in equation (1) with variables related to population (Panel A), housing (Panel B), and the retail (Panel C) and wholesale (Panel D) sectors. Panel A shows that total population increase in counties that received relatively more wartime investment. Quantitatively, the effect is large: a county with 10 percent more wartime investment had population that was 0.06 percent larger on average. Over the entire postwar period wartime investment is correlated with a substantial decrease in the black population. This is consistent with greater opportunities for white workers in high-paying industries during and after the war (Schulman Reference Schulman1991, p. 83). Finally, the war does not appear to have altered the distribution of population between urban and rural areas within southern counties. Overall, the differences suggest a strong migration response among whites within the South and out-migration on part of African-Americans.Footnote 12
Table 4 IMPACT OF WARTIME ON NON-MANUFACTURING OUTCOMES
Notes: The dependent variable in each column is a non-manufacturing outcome (in log). Panel A includes total, black, urban, and rural population; Panel B includes the number of owner-occupied housing units, the median house value, the number of renter-occupied units, and the value of gross rent; Panels C and D each give the number of establishments, employment, wages, and sales. All columns include county fixed effects, state-year fixed effects, and prewar county characteristics interacted with year effects. The years included in panels A and B are 1920, 1930, 1940, 1950, 1960, 1970, and 1980; panels C and D include 1930, 1940, 1947, 1954, 1958, 1963, 1967, 1972, 1977, 1982, and 1987. Standard errors (in parentheses) are clustered at the state level. The number of sample counties is 1,086.
Sources: See text of the Data and Variables section.
Panel B shows limited changes in postwar housing markets due to wartime investment. There were small increases in the number of owner- and renter-occupied units and decreases in the median house value and gross rent. The magnitudes tend to be economically small: 0.03 percent for the number of owned units and 0.08 to 0.10 percent for housing costs for a 10 percent increase in wartime investment. These results are consistent with the expansion of housing supply (and some social services) in areas with a booming war economy and influx of migrants, although the effects are modest (and not always statistically different from zero). The small effects on housing speak to the temporary nature of wartime mobilization.
Finally, Panels C and D indicate mixed effects of wartime investment on the number of establishments, employment, wages, and sales in the retail and wholesale sectors. Together with the impact on population movements, these results suggest that although the war did not lead to differential growth in manufacturing, mobilization still played an important role in shaping the economic growth of the American South through the reallocation of the population across space and the subsequent stimulus provided by consumer demand and government contracts in these markets. This is part of a process of wholesale and retail expansion that started in the 1930s and continued to play out over the second half of the twentieth century (Cobb Reference Cobb1982; Schulman Reference Schulman1991; Holmes Reference Holmes2011).
Both the New Deal and WWII played a prominent role in bringing the influence of the federal government to the American South and invigorated spending throughout the region. The legacy of mobilization for WWII does not appear to be a newly created and dynamic industrial economy. Instead, mobilization spurred the movement of population and, to a lesser extent, the growth of the wholesale and retail sectors. Indeed, according to Schulman (Reference Schulman1991, p. 221) and Matthew L. Downs (Reference Downs2014, p. 257), another area where the South gained was in industries with substantial demand from government contracts, in particular, the defense industry (Markusen, Hall, Campbell, et al. Reference Markusen, Hall and Campbell1991).
CONCLUSION
Prior to WWII, the South lagged behind the rest of the country, which led President Franklin D. Roosevelt in 1938 to describe the region as “the nation's no. 1 economic problem” (Roosevelt Reference Roosevelt1938). Through mobilization for WWII the federal government stimulated demand for industrial goods and infused the region with substantial new investment. Many analysts have since attributed the region's postwar growth to the spark provided by mobilization. Using newly assembled data on the location and value of WWII investment, I examine the impact of capital deepening on the local manufacturing activity. My results indicate that previous research has claimed too much certainty in linking mobilization with the subsequent growth of manufacturing in the American South.
I present empirical evidence using newly digitized data on the location and value of wartime investment to show that capital deepening during the 1940s was not decisive. I use an empirical strategy that controls for prewar differences across southern counties in the level of industrial development as well as state and federal policies over the period that targeted the region. This is particularly important given substantial heterogeneity in prewar levels of industrialization across the South. The estimated coefficients tend to be small and not statistically significant, although I cannot reject effects that are sizable for some outcomes due to large standard errors. Indeed, using Cobb (Georgia) and Kanawha (West Virginia) counties as case studies, I show large investments may have led to markedly different postwar experiences. Together, these findings are consistent with differences in depreciation across wartime investment projects, specificity for capital redeployed from military uses, and the mediating role of federal government contracts in the postwar period. Future research should focus on the relative importance of these factors.


