


Research on England’s economic and financial history focused on the development of financial markets following the Glorious Revolution. Dickson’s (1967) The Financial Revolution…1688–1756 was followed by North and Weingast (Reference North and Weingast1989), who argued that institutional reforms, namely establishing credible commitment, enacted after the Glorious Revolution contributed to financial development and growth. Some of the key financial innovations were establishing the Bank of England (1694), a stock exchange, and a deep market for perpetual government securities. The main criteria used for the successful financial transformation and its most significant contribution to economic growth was evidence of declining interest rates. Few accounts debated the starting date of the financial revolution in England. Roseveare’s (1991) The Financial Revolution, 1660–1760 directly challenged Dickson’s (1967) account.
In this paper, we turn to an overlooked aspect of England’s financial development during the seventeenth century, when financial development was still in its infancy.Footnote 1 Our main contribution is a novel, annual series of interest rates paid by the Corporation of London to its lenders from 1638 to 1683 extracted from individual debt contracts from its accounts.Footnote 2 The series complements Clark’s decennial real interest series based on land returns (Clark Reference Clark and Alexander2010) and fragmentary mortgage rates reported by Ward (Reference Ward1974). The Corporation of London was a chartered corporation that originated in the twelfth century. Its governance structure included the Lord Mayor, the Court of Aldermen (executive branch), and the Court of Common Council (a deliberative institution).Footnote 3 In the seventeenth century, it enjoyed autonomy and was essentially an oligarchy of wealthy merchants with mainly Whiggish inclinations.Footnote 4 The Corporation of London was an important factor in the Restoration period’s politics (De Krey Reference De Krey2005).
We also provide quantitative evidence for the emergence of the Corporation of London as a significant financial institution that was integrated within London’s expanding financial market (Quinn Reference Quinn1997; Roseveare Reference Roseveare1991). This allows us to suggest that the borrowing costs we document are indicative of non-sovereign interest rates prevailing in London at the time.
The main empirical finding is that before the Glorious Revolution, interest rates in London declined in parallel to those in Amsterdam, the most developed financial center of the time (Carlos and Neal Reference Carlos and Neal2011). Therefore, London’s interest rates during the seventeenth century exhibited a similar declining trend to that observed in other parts of Europe.Footnote 5 There was also convergence between London and Amsterdam achieved by 1680 when interest rates temporarily reached 4 percent. This devel opment contrasts with the divergence of interest rates that followed the Glorious Revolution in 1688 and lasted until the 1730s (Sussman and Yafeh Reference Sussman2006). We attribute the convergence of interest rates between London and Amsterdam to the increasing volume and liquidity of debt issued by the Corporation of London.
Our second contribution is to extract micro-level data on the loans raised by the Corporation of London. The Corporation of London used four debt instruments: annuities, bonds, notes, and very short-term loans. We provide evidence of the development of a secondary market for debt. We also document an increase in the number of people holding bonds and their heterogeneity, and the variety of debt maturities.Footnote 6 While the developments we document are modest compared with those of the eighteenth century and those prevailing in Amsterdam at the time, we suggest that they contributed to the decline in the cost of capital in London.Footnote 7
Our study relates to the debate sparked by North and Weingast on the contribution of the Glorious Revolution to financial development and growth. Clark (Reference Clark1996) showed that real interest rates measured as the return to capital were not significantly affected. Sussman and Yafeh (Reference Sussman and Yafeh2006) showed that interest rates increased for more than three decades after the Glorious Revolution. Subsequent research offered a more nuanced view of the Glorious Revolution’s impact on financial development and economic growth.Footnote 8 It emphasized the change in the ability of the state to rule efficiently and raise taxes to finance wars and debt (e.g., O’Brien Reference O’Brien2011; Cox Reference Cox2012; Pincus and Robinson Reference Pincus, Robinson, Galiani and Sened2014). Another strand of the literature emphasized the effects of partisan politics and the growth-enhancing economic policies of the Whig party (e.g., Stasavage Reference Stasavage2007; Pincus and Robinson Reference Pincus, Robinson, Galiani and Sened2014).
Recent accounts argue that the Glorious Revolution was not about securing property rights but about enabling Parliament to transfer landed property rights effectively. This brought a more efficient allocation of resources and the development of capital markets (e.g., Bogart Reference Bogart2011; Bogart and Richardson Reference Bogart and Richardson2011; Hodgson Reference Hodgson2017; Dimitruk Reference Dimitruk2018). The emphasis on the Glorious Revolution as a watershed in the development of efficient (capital) markets fits with research that claims that Britain’s (legal) institutions were more conducive to the development of efficient financial markets (Glaeser and Shleifer Reference Glaeser and Shleifer2002) and the extensive empirical literature that followed (La Porta, Lopez-de-Silanes, and Shleifer Reference La Porta, Lopez-de-Silanes and Shleifer2008).
Our aim is not to dispute the contribution of the Glorious Revolution to British economic history. We provide novel evidence that shows that non-sovereign interest rates in London declined during the seventeenth century, before the Glorious Revolution, and in parallel with their decline in Continental Europe. More importantly, the financial developments we document in this paper accelerated after the Restoration of the Stuart monarchy in 1660.
The financial operations of the Corporation of London from the Restoration to the Glorious Revolution are understudied. Ashton (Reference Ashton1960) studied its financial importance before the Civil War. Richards (Reference Richards1929) characterized its role as a financial intermediary to the Crown (similar to the goldsmith-bankers, only on a larger scale). Coates (Reference Coates2017) studied the period of financial difficulties of the Corporation during the Civil War. Wareham (Reference Wareham2011) discusses the period before the Fire and the levying of the hearth tax on the City. The history of the Orphans Fund was described by Carlton (Reference Carlton1974) but was not placed in the broader context of the Corporation’s financial operations. Harding (Reference Harding, Boone, Davids and Janssens2003) provides a broad history of the City of London’s finances from 1400 to 1700 but provides little quantitative evidence.
Our findings also relate to the literature on municipal borrowing and taxation by cities and provinces in early modern Europe. Epstein (Reference Epstein2000) and Stasavage (Reference Stasavage2011) highlight the relationship between municipal autonomy and the cost of capital. Carlos and Neal (Reference Carlos and Neal2011) summarized Dutch municipal and provincial borrowing as an early financial revolution. More recently, research has focused in more detail on individual European cities (Baguet Reference Baguet2016; Colombo and Dotti Reference Colombo and Dotti2015; Limberger and Ucendo Reference Limberger and Ucendo2015), some of which look particularly at the role of political-economic elites in municipal debt markets (Baguet Reference Baguet2016). Finally, data on municipal borrowing rates in Europe, in the long run, was collected and analyzed by Chilosi, Schulze, and Volckart (Reference Chilosi, Schulze and Volckart2018).
Like its successful continental counterparts (Stasavage Reference Stasavage2011), London’s autonomous Corporation managed to borrow at a lower cost than its sovereign because it enjoyed greater credibility than the Crown. The Corporation of London borrowed to the hilt to rebuild a modern city (Coffman, Stephenson, and Sussman Reference Coffman, Stephenson and Sussman2022), financed the Crown, and provided social security to its orphans (Carlton Reference Carlton1974).
The rest of the paper is organized as follows. The second section describes the lending and borrowing by the Corporation of London. In the third section, we present the methodological framework and report the results of our econometric analysis. The fourth section provides an analysis of the spread between secured and unsecured debt. The fifth section concludes.
THE CORPORATION OF LONDON’S FINANCIAL ACTIVITIES
The capital market in London in the seventeenth century saw three major developments. The first was the equity financing of international trade joint-stock companies. The first joint-stock company, the Merchant Adventurers, was formed in 1552, and in 1599 the East India Company (EIC) was charted and became the largest of these companies. A second development was the rise of goldsmith-banking. Before the Civil War, goldsmith-bankers mainly provided credit to wealthy individuals. In the Interregnum, these bankers started to accept deposits and lent them to the government. The scope of goldsmith-bankers’ activity increased substantially after the Restoration as the Crown demand for credit increased and goldsmith-bankers intermediated between individuals and the Crown (Kim Reference Kim2011; Quinn Reference Quinn1997). A third development, albeit more modest, was the development of a secondary market for financial assets. During the Interregnum, a secondary market for warrants developed (Coffman Reference Coffman2013b). A secondary market for shares in joint-stock companies developed after the Restoration (Carlos, Key, and Dupree Reference Carlos, Key and Dupree1998). In the late 1670s, a secondary market for defaulted royal debts also developed (Li Reference Li2019a).
Within London’s financial development landscape, the Corporation of London’s financial activities ranged from those of autonomous continental municipalities, sub-sovereign municipalities such as Paris to those of goldsmith-bankers. Like autonomous municipalities, the City operated, since the middle ages, an Orphans Fund (Carlton Reference Carlton1974; Doolittle Reference Doolittle1983). Guild members deposited money in the fund that earned interest and was payable as an annuity to orphans before they reached the age of majority. Having reached the age of majority, the orphans could withdraw the funds. Before the Civil War, the Corporation used part of the Orphans Fund’s deposits to fund its deficits. During periods of surpluses, it lent some of them to individuals and companies.
As we show, after 1640, the Corporation also issued debt instruments to cover its deficits. Therefore, the Corporation of London’s financial activities were similar to those of their counterparts on the Continent, especially in the Low-Countries. However, historians and economic historians hardly researched its financial operations.Footnote 9 Therefore, Munro (Reference Munro2003) and Carlos and Neal (Reference Carlos and Neal2011) arrived at their conclusion on London’s financial development’s unique history based on incomplete data.Footnote 10
Before the Civil War and before goldsmith-bankers emerged as major financial intermediaries, the Corporation acted as a financial intermediary between individual lenders and the Crown (Ashton Reference Ashton1960; Richards Reference Richards1929).Footnote 11 It also lent directly to the Crown before the Civil War and after the Restoration. After the Restoration, it used the Orphans Fund deposits to lend to the Crown until the Fire of London (1666) placed a heavy burden on City finances (Nichols Reference Nichols1971).Footnote 12
Like earlier developments in Paris (Hoffman, Postel-Vinay, and Rosenthal Reference Hoffman, Postel-Vinay and Rosenthal2000), the Corporation also lent to the Crown against royal tax receipts. Coffman, Stephenson, and Sussman (Reference Coffman, Stephenson and Sussman2022) show that Parliament authorized the Corporation to establish a Coal Cash Fund responsible for the financial management of rebuilding public buildings and infrastructure after the Fire of 1666. The fund was assigned receipts from a Royal coal tax. Because of an initial shortfall of Coal tax receipts, the Corporation borrowed from individuals and lent to the Coal Cash Fund to expedite the rebuilding projects.Footnote 13
As with shares of joint-stock companies and royal warrants, debt instruments of the Corporation were also assignable and, as we document, became more frequently assigned after the Restoration. Moreover, our data reveal that individuals that held deposits with goldsmith-bankers also held debt instruments of the Corporation. In conclusion, the Corporation was an integral part of London’s financial market. Therefore, in the absence of a time series of interest rates for England for the seventeenth century, we argue that its cost of capital can indicate non-sovereign interest rates.
In this section, we provide a novel, annual series of interest rates for the seventeenth century. We extracted the data from the accounts of the Corporation of London. The data comprises the borrowing accounts of the Corporation of London (1638 to 1683). We supplemented it with a short series on lending by the Corporation of London (1616 to 1639). We also present data on amounts borrowed and various characteristics of the market for the Corporation of London’s debt. Finally, we show the distribution of loan amounts and loan maturities.
Our data analysis ends in 1683. In that year, the Corporation of London suspended interest payments on its unsecured debt. In Coffman, Stephenson, and Sussman (Reference Coffman, Stephenson and Sussman2022), we suggest that the default resulted from higher than expected commitments and insufficient cash flows related to the reconstruction of the City’s infrastructure and public buildings destroyed in the Fire of 1666. A few months after the default, in October of 1683, the King suspended the Corporation of London’s privileges in what is known as the “Quo Warranto” Act.Footnote 14
The impact of default on London’s financial development cannot be inferred from the sources we used. However, evidence provided by Quinn (Reference Quinn2001), based on lending by Child’s Bank, suggests that interest rates during the period 1680–1689 were on average 4.55 percent. These rates do not represent an increase from the rates we report on the eve of the Corporation default. These rates increased, however, after the Glorious Revolution. Carlton (Reference Carlton1974) provides qualitative evidence for the rapid development of a secondary market for defaulted Orphans’ debt. We can cautiously conclude that the default did not reverse the development of London’s financial market.
Parliament restored the City’s privileges in 1688, immediately after the Glorious Revolution. However, the Corporation of London, riddled with debt in default, did not resume its role as a financial intermediary. Subsequent financial development in England proceeded on a well-known and heavily researched trajectory.
The Sources
We extracted our data from the Chamberlain’s account books kept at the London Metropolitan Archive. The “Cash Books” contain the borrowing and lending activities of the Chamberlain of the Corporation of London from 1633 until 1648.Footnote 15 As was customary in the accounts of the time, borrowing was recorded in the receipts (“charges”) section. There was no distinction between an operating budget and a capital account.Footnote 16 From 1649 to 1683, the Chamberlain kept the detailed financial accounts in a separate ledger—the “Loan Books.”Footnote 17 The Cash Books listed only the totals.
The accounts detail the origination date of the loan, the name/s of the lender/s, their gender (widows or spinsters), and whether they resided outside of the City of London. The records provide information on the lenders’ status, whether they belonged to the gentry (gentlemen, esquire, and nobility), the City government, and the livery companies (usually with specific occupations listed). They also record the amount lent, the loan’s nature (very short-term loan, six “months” loan or annuity), and the rate of interest on the loan. The accounts also record the redemption of the loan and the name of the person receiving the principal. This information allows us to establish whether the loan was assigned to another person.
We extracted additional accounting data from the Cash Books. They include annual receipts, expenditures, and balance sheets. The provision of a detailed annual balance sheet, including assets and liabilities, started to appear in the Cash Book in the fiscal year 1654. The fiscal accounts ran from Michaelmas to Michaelmas (29 September). The accounts allow calculating the Corporation’s annual operating deficit (excluding borrowing and debt redemptions) and the Corporation’s stock of debt and additional financial ratios. The accounts are complete except for the ledger for the years 1665 to 1667, which burned in the London Fire.
Lending by the Corporation of London
The Corporation of London advanced loans to individuals and companies before 1640. In 1639 the Corporation incurred a substantial expense of more than £27,000 related to St. Paul’s Cathedral’s repairs that necessitated borrowing from individuals. In 1641, the City lent £95,500 to the Crown in preparations for the Civil War. These financial strains caused the Corporation of London to cease lending to individuals. Since surviving records began in 1633, we have detailed lending data only from 1633 to 1640. We used the stock of unpaid debt borrowed from the Corporation of London accounts to infer, albeit from an incomplete sample, the lending rates before 1633.
THE LOANS
The Corporation of London lent directly to wealthy individuals and two companies; the EIC and the Company of the Merchant Adventurers of London. The Corporation also administered the forced loans levied by the Crown (Ashton Reference Ashton1960). The loans made by the Corporation were extended initially for 6 or 12 months. They were approved by the “consent of the court (of Aldermen).” The Corporation made these loans without asking for collateral. The stock of unpaid debt also includes several loans made in the 1620s that were in default.Footnote 18 These loans were part of the Crown’s forced loans on the Corporation in 1616 and 1625 that were unpaid (Ashton Reference Ashton1960).
TABLE 1 SUMMARY STATISTICS OF UNSECURED LENDING TO INDIVIDUALS BY THE CORPORATION OF LONDON: 1616–1640
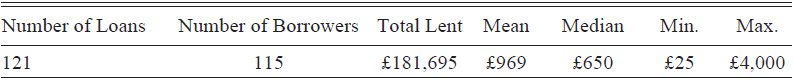
Sources: COL/CHD/CT/001-003, excludes lending to Corporations or the Crown.
Table 1 provides summary statistics for the unsecured lending to individuals we extracted from the account books. The average loan totaled about £1,000, while the median loan was £650. Depending on various assumptions, £1,000 are worth today between £150,000 to £2,250,000.Footnote 19 We can compare these loans to lending by Hoare’s Bank from 1695 to 1724. Temin and Voth (Reference Temin and Voth2013) showed that the average loan made by Hoare’s was £1,040. This amount was similar to the one we found for the Corporation of London.
The Corporation of London accounts reveal that it also lent to the EIC and the Company of the Merchant Adventurers. The EIC borrowed £15,000 a year from 1632 to 1635 and £12,000 in 1636 at 6 percent. In 1639, as the Corporation of London incurred large expenditures for St. Paul’s cathedral’s repair, it lent the EIC only £5,500 at 7 percent. The borrowing by the Company of Merchant Adventurers was more modest than that of the EIC. It borrowed £2,000 at 6 percent in 1632 and 1633 and £1,500 at 6.5 percent in 1634 and 1635.
LENDING RATES
We show the lending rates charged by the Corporation of London and amounts lent in Figure 1. Interest rates declined from the usury ceiling of 8 percent in 1625 to 6 percent during the 1630s and then increased to 7 percent in 1640 when the Corporation started to borrow. We can compare the loans made in the 1630s with those made by Hoare’s Bank after the Glorious Revolution. Temin and Voth (Reference Temin and Voth2013) report that the usury ceiling of 6 percent constrained Hoare’s lending rates until 1714 and 5 percent after that. Therefore, they argue that administrative rather than market forces dominated lending rates. Our data show that almost a century earlier, the Corporation advanced equal-sized loans (on average) at market rates. We also show that lending rates, albeit to privileged borrowers affiliated with the City’s government, in the 1630s were similar to those that prevailed a century later, decades after the Glorious Revolution.
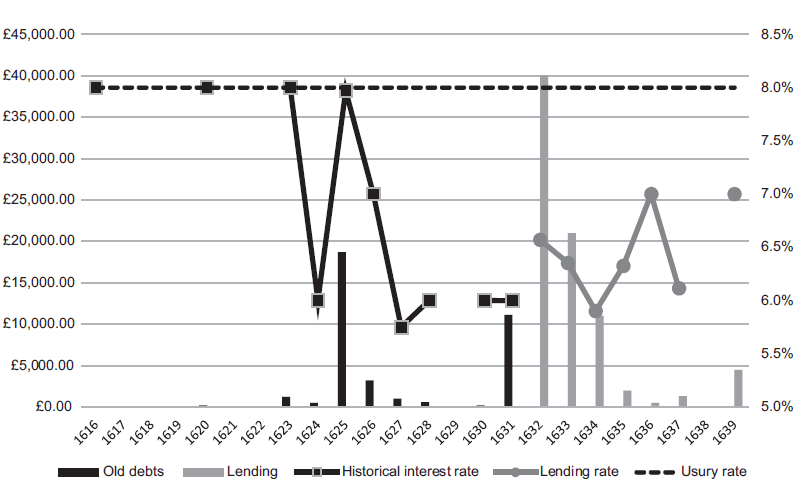
FIGURE 1 CORPORATION OF LONDON LENDING TO INDIVIDUALS: 1616–1640
Notes: Old Debts and historical interest rate based on the stock of outstanding debt owed to the City in 1633 (COL/CHD/CT/01/001). Lending and lending rate based on reported actual lending and excludes lending to Corporations and the Crown.
Sources: COL/CHD/CT/01/001-003.
Borrowing by the Corporation of London
The Corporation of London started borrowing from individuals in 1638 to finance the extraordinary expenses related to St. Paul’s cathedral’s repairs. In the 1640s, the Corporation faced large expenditures related to the Civil War, and its cash flow, which before then was positive and allowed it to lend, became negative for most years. In this subsection, we begin by detailing the loans’ characteristics. We will show the types of debt contracts used, their duration, volume, and their liquidity. We then present the interest rates at which the Corporation of London borrowed.
The loans raised by the Corporation of London were secured only by its reputation. The accounts record them as “borrowed for the ‘City’s use on the City’s bond’.” Habakkuk (Reference Habakkuk1952) cites Benbrigge’s Usura Accommodata from 1646, claiming that the City’s Chamber was a place “whereunto men may put their moneys, for the assurance whereof, and the payment of its use (which is five in the hundred per annum), they have the security of the Chamber, which is accounted the best this day in England.” Footnote 20
TABLE 2 SUMMARY STATISTICS OF UNSECURED BORROWING BY THE CORPORATION OF LONDON: 1638–1683
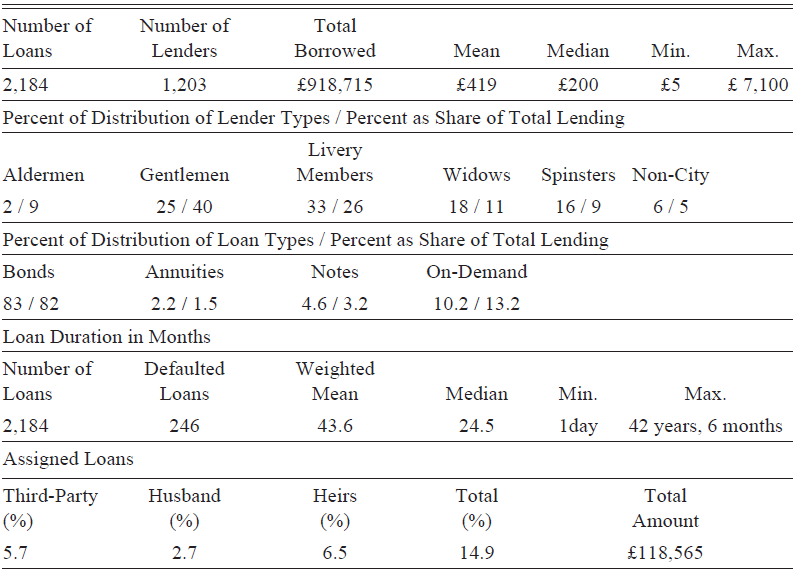
Note: We report the percentage of lender and loan types followed, after the ‘/’ separator, by their share of the amount lent.
Sources: COL/CHD/CT/001 to 019; COL/CHD/LA/001 and 002.
Table 2 provides summary statistics for the unsecured borrowing we extracted from the account books. The accounts record 2,184 loans advanced by 1,203 individuals for a total of almost £920,000 over 40 years. The average loan totaled about £419, while the median loan amounted to £200. These were substantial investments, £200 then are worth today, between £30,000 to £450,000.Footnote 21
The Crown’s default in 1672—the “Stop of the Exchequer”—allows putting the lending to the Corporation of London in perspective. Carruthers (Reference Carruthers1999, p. 66) provides figures for the average amounts of debt assigned to the Crown’s individual creditors. The goldsmith-bankers intermediated the lending of individuals to the Crown. The average loan was £475 and is close to the average amount of borrowing by the Corporation. The average assigned loan held by a female was £294, which is similar to the average loan size of women to the Corporation, that is, £284. We can conclude that lending to the Corporation was, for individuals, an investment comparable to intermediated lending to the Crown.
The volume of defaulted debts can offer another perspective on the comparability of intermediated sovereign lending and lending to the Corporation. The total defaulted sovereign debt assigned to individuals was £767,000. The total debt at default for the Corporation of London in 1683 was comparable at £617,192.Footnote 22
THE VOLUME OF DEBT AND BONDS
An important measure of financial development is the ratio of financial assets to GDP (Sahay et al. Reference Sahay, Martin Čihák, Adolfo Barajas and Diana Ayala2015).Footnote 23 The Corporation of London started to borrow using bonds in 1638, although it had already administered an Orphans Fund dated to the middle ages. We can see (Figure 2) that debt volumes rose during the English Civil War and declined during the Interregnum. Debt volumes increased again following the Restoration, and especially after the London Fire of 1666 and the reconstruction carried out by the Corporation. We can scale the debt volumes by British GDP (Broadberry et al. Reference Broadberry, Bruce Campbell, Overton and van Leeuwen2015) and show that this ratio did not exhibit a trend until the Restoration. However, after 1660 the Corporation of London’s debt to British GDP ratio tripled from about 0.4 percent to 1.2 percent of GDP.Footnote 24
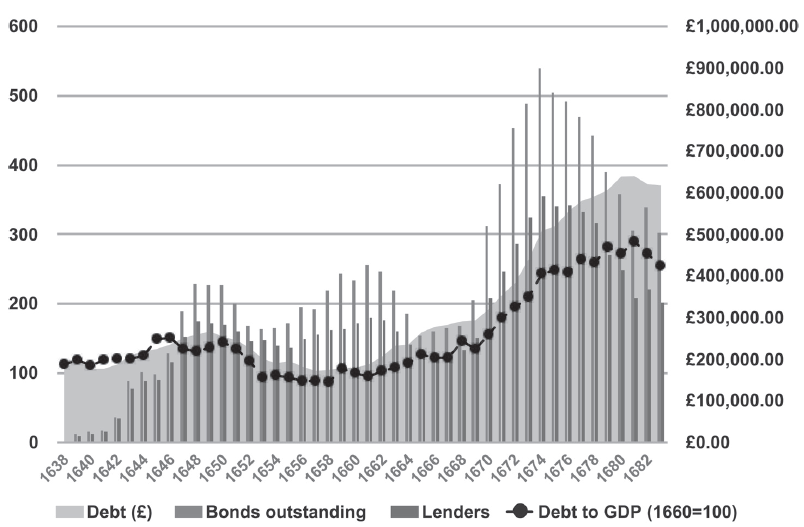
FIGURE 2 MEASURES OF FINANCIAL ACTIVITY: DEBT VOLUMES, DEBT TO GDP, NUMBER OF LOANS OUTSTANDING, AND NUMBER OF LENDERS: 1633–1683
Sources: COL/CHD/CT/001 to 019; COL/CHD/LA/001 and 002.
One way to gauge a financial intermediary’s size is its balance sheet (total assets or liabilities). The financial balance sheet of the Corporation of London was larger than that of goldsmith-banks. Before the Restoration, the Corporation’s balance sheet averaged around £200,000 and tripled to £600,000 in the 1680s. In contrast, according to Temin and Voth (Reference Temin and Voth2013), the assets of individual Goldsmith Banks from 1688 to 1730 were in the range of £100,000 to £200,000.
Another way to assess the size of the Corporation of London relative to London’s financial market is to compare its liabilities to those of joint-stock companies. The value of the largest company, the EIC, in 1675 was about £370,000, and by 1685, total liabilities, including debt, totaled about £570,000.Footnote 25 Smaller companies such as the Royal African Company raised £100,000 in equity in 1672, and the Hudson Bay Company raised only £10,500 (Carlos, Key, and Dupree Reference Carlos, Key and Dupree1998). Therefore, the rise of the Corporation’s debt following the Restoration could not be considered insignificant.
Financial development is also represented by the number of bonds and the number of lenders holding the Corporation’s debt instruments. The data show (Figure 2) that the number of individuals holding the Corporation’s debt increased during the first decade of borrowing to around 150 and remained at this level until 1669. It then increased rapidly to levels higher than 300. The number of bonds outstanding followed a similar trend; more than 500 bonds were outstanding in 1674.
The exogenous event of the Fire of London that strained the finances of the Corporation accelerated these developments. The borrowing needs of rebuilding the City after the Fire offered wealth holders financial investment opportunities on a large scale. Total borrowing for rebuilding exceeded £400,000, significantly larger than the capital raised by England’s prominent trading companies noted earlier. Though this was a one-time event, the debt raised was not paid off instantly and became a significant part of individuals’ portfolios. In Coffman, Stephenson, and Sussman (Reference Coffman, Stephenson and Sussman2022), we document how financial markets financed the City’s rebuilding. In this paper, we emphasize the increasing demand for loans as a catalyst for developing the London financial market.
WHO WERE THE LENDERS?
The Corporation of London borrowed mainly from wealthy residents of the City (Table 2). The documents classify the lenders into six categories: (1) members of the Corporation’s governing body (Aldermen). They accounted for 2 percent of the loans, but 9 percent of the amount lent. The Alderman can be considered as insiders—lending to the institutions they governed. (2) Gents and esquires that resided in the City. They provided 25 percent of the loans and 40 percent of the amount lent. (3) Members of livery companies (guilds) that supplied the largest share of loans (33 percent) and 26 percent of the amount lent. (4) Widows that provided 18 percent of the loans and 11 percent of the amount lent. (5) Spinsters that provided 16 percent of the loans and 9 percent of the amount lent. Independent women, therefore, provided 23 percent of the loans and 20 percent of the amount lent. (6) A small subset of lenders did not reside in the City. Many resided in London and some in the surrounding shires. They accounted for 6 percent of the loans and 5 percent of the amount lent.
Lending to the Corporation of London increased the variety of assets Londoners could hold. Records of Backwell Bank—one of the three most prominent goldsmith-banks that operated in London after the Restoration (Quinn Reference Quinn1997; Richards Reference Richards1929)—allow us to show that 322 of the 1,203 lenders to the Corporation (27 percent) also held bank accounts in that bank.Footnote 26 Our records show that those with bank accounts with Backwell lent on average significantly larger amounts to the Corporation than those who did not have an account with Backwell.Footnote 27 The share of women who lent to the Corporation and had an account with Backwell was only 13 percent.
The list of assignees of the royal defaulted debt, during the “Stop of the Exchequer,” includes all goldsmith-bankers’ intermediated debts. The lists show that women represented 14.6 percent of creditors (Carruthers Reference Carruthers1999, p. 66). Though we have data from only one, albeit the largest bank in London and the list of assignees of royal debt from 1672, we can conclude that the Corporation of London offered additional comparable investment opportunities allowing individuals to diversify their portfolios. More tenuously, we can conclude that the Corporation of London offered investment opportunities to those who did not have access to bank accounts, especially women.
The fact that individuals that lent to the Corporation also held accounts at Backwell Bank offers additional evidence that the Corporation of London was an integral part of London’s financial market. Its lenders faced the option of either depositing funds at a bank or lending to the Corporation. Therefore, we conclude that the Corporation competed with London goldsmith-bankers and offered the option to diversify financial investments.Footnote 28
DEBT CONTRACT TYPES
In this subsection, we present evidence that the Corporation of London offered various debt contracts that differed in their initial liquidity (minimal holding period) and provided flexible withdrawing options in terms of maturity and repayment options. All debt contracts were unsecured, and they were not issued against collateral or assigned (tax) revenues. During the City’s reconstruction after the Fire of 1666, the Corporation also issued bonds (in 1672 and 1673) on behalf of the Coal Cash Fund secured by the Coal Tax receipts.Footnote 29
In 1638, when borrowing began until 1662, most of the loans were recorded as bonds borrowed for six months. In effect, most loans were repaid after longer periods (Table 2). In 1663, the accounts stopped mentioning the duration of the bonds altogether.Footnote 30 Thus, we can characterize them as bonds with a flexible redemption option making them a liquid investment. The loans were contracted at a given interest rate for the initial period (mostly six months). Interest rates could vary between lenders. After the initial maturity elapsed and until their redemption, the bonds were subject to variable interest rates based on prevailing borrowing costs. Only a small number of loans (2 percent of the total borrowed) were life rents or annuities.
When the Corporation required immediate liquidity, it raised loans recorded as loans to “cover the want of cash,” which could be repaid within a very short period. These loans amounted to more than 10 percent of the total. On average, they were of a higher value, and their median holding length was half that of bonds (17 months). Finally, the Corporation also issued notes (similar to the royal exchequer notes). These debt instruments amounted to 4.6 percent of all loans, were of lower value than bonds, and were held for even shorter durations (median holding period of 11 months).
The Corporation, therefore, issued a variety of debt instruments that varied in their minimum holding period. However, none of the debt instruments had a maximum redemption maturity, and most of them were redeemed on the lenders’ demand, well after the minimal contractual holding period expired. Another interesting aspect of debt contracts is that they could be redeemed in installments. The Corporation repaid about 17 percent of all loans in installments: 9 percent of loans were repaid in two installments, 3.5 percent in three installments, and the rest repaid in 4 to 14 (a single loan) installments.
THE BONDS’ MATURITIES
As we saw previously, except for a small share of annuities, most of the lending to the Corporation was under short-term contracts. However, the lenders had the option of holding the debt instruments beyond the initial contract period. Therefore, de facto, the Corporation was also able to raise longer-term debt and, at the same time, offer a liquid investment to the investors.Footnote 31
Figure 3 shows the distribution of the holding periods. About one-third of the loans were redeemed within 18 months, and the median was about two years. However, about one-quarter of the loans were held for periods above five years. Ten percent of the loans were held for more than ten years.Footnote 32 While most of the investments in the Corporation’s bonds were, therefore, held for short maturities, these debt instruments allowed the investor to keep them for longer periods. For some investors, the bonds served as an annuity.
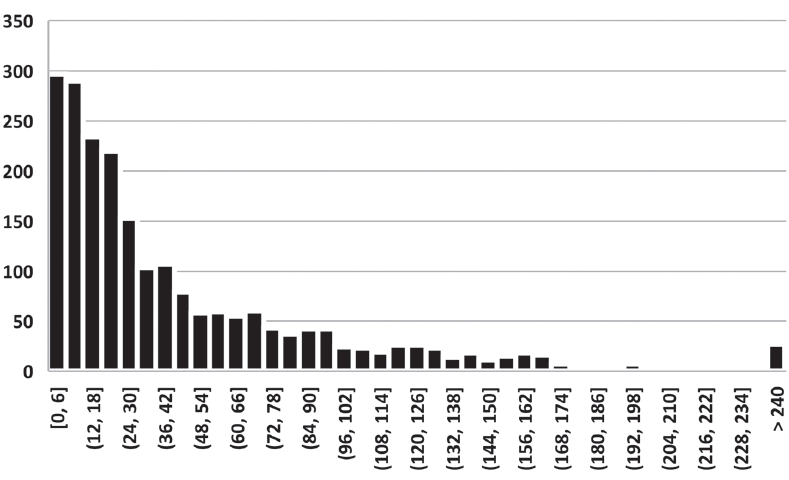
FIGURE 3 DISTRIBUTION OF LOAN MATURITIES IN MONTHS: 1640–1683
Sources: COL/CHD/CT/001 to 019; COL/CHD/LA/001 and 002.
The loans’ maturity also depended on lenders’ characteristics and the type of debt instrument used. To determine what affected individual bonds’ holding periods, we estimated a survival model on the length of time loans were held until redemption. We report the estimation results in the Online Appendix (Table A-7). Controlling for the year of redemption fixed-effects, we found that loan duration decreased with the amount lent; large loans were held for shorter durations. We also found that loans advanced by insiders—the Aldermen—were held for 40 percent shorter durations than those advanced by liveries members. On the other hand, loans by widows were held for about 30 percent longer. Annuities were held for periods twice as long as regular bonds and notes, and short-term debt was held for nearly half the bonds’ duration. Those that withdrew their loans in installments held them for 60 percent longer than others. Finally, bonds assigned to third parties were held for almost twice as long as those redeemed by original lenders.
Evidence from loan maturities allows us to conclude that lending to the Corporation provided lenders with debt instruments that suited their preferences. On the one hand, widows held smaller bonds for much longer durations—serving as an equivalent to an annuity. Insiders, on the other hand, lent large amounts for shorter durations.
A SECONDARY MARKET FOR DEBT
When the Corporation paid back the loans, the records mentioned the name of the person paid. If that person was not the original bond-holder, they recorded the name of the assignee. The records show (Table 2) that 15 percent of the loans were assigned. Natural cases for assignments were when lenders died and when women were married. Married women’s financial assets were legally required to be held by the husband. However, about 6 percent of all loans worth over £41,000 were assigned to third parties.
As we saw in the previous section, assigned loans were held for longer durations than unassigned loans, suggesting that those that bought them did so for investment purposes. Recall that investors could cash their bonds after six months. Moreover, only four of the assigned bonds were cashed six months after their issuance. Since we have no record of the assignment transaction, we do not know when it took place in the bond’s life. We can only observe bonds when they are redeemed. Nevertheless, we can see that the share of assigned bonds redeemed increased over time (Figure 4). In particular, we note that assignability to third parties was rare before the Restoration.
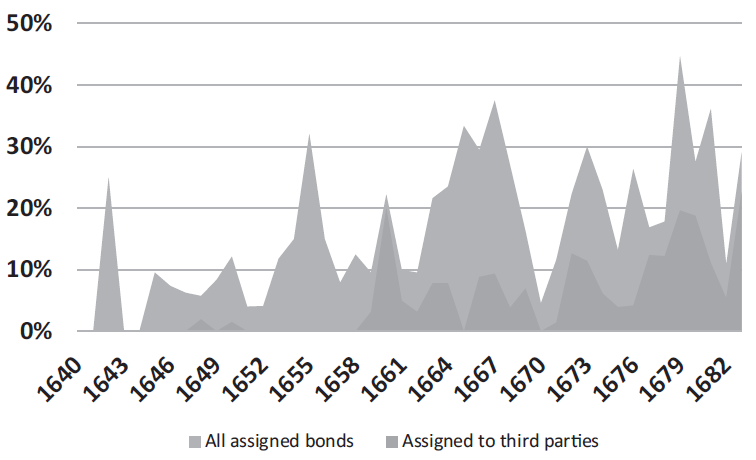
FIGURE 4 SHARE OF BONDS REDEEMED BY ASSIGNEES: 1640–1683
Sources: COL/CHD/LA/01/001 and 002.
The data on bond assignability shows that the assets created by the Corporation could not only be held for any duration but also became negotiable. We cannot claim that an organized, fully liquid market for these assets existed. Nevertheless, their negotiability, or liquidity, made them a means to diversify financial investments (Kiyotaki and Moore Reference Kiyotaki and Moore2005).
BORROWING INTEREST RATES
The Corporation of London did not issue standardized bonds. It borrowed varying amounts from various types of individuals and used a variety of debt instruments. Therefore, we would expect some hetero-geneity in the rates of interest offered to its lenders. In Figure 5, we group annual loans to the Corporation by the interest paid. The bubble size represents the amount of lending at a given interest rate for every year. We can see that lending rates, within a year, were concentrated. However, some variation, up to 200 basis points, occurred within the year. The heterogeneity of interest rates suggests that the Corporation was not borrowing at a predetermined institutional rate. Instead, it was active in a credit market.
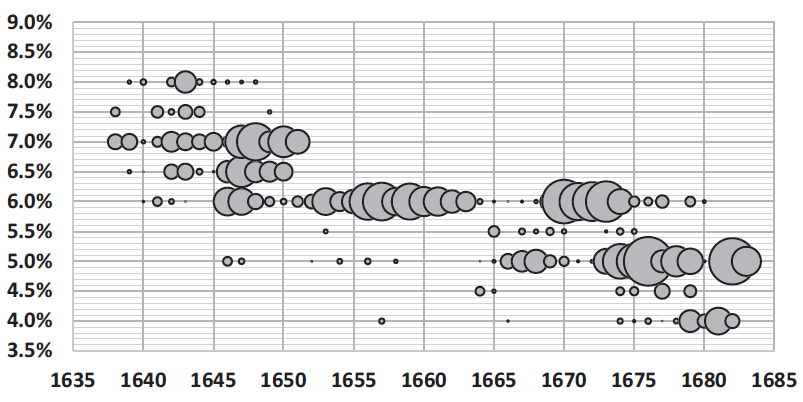
FIGURE 5 INTEREST PAID ON ALL LOANS: 1638–1683
Sources: COL/CHD/LA/01/001 and 002.
The data extracted from the loans recorded in the accounts also allow us to construct an annual time series based on weighted borrowing rates for the Corporation of London. We report annual borrowing rates calculated using a weighted (by loan size) average of all bonds’ borrowing rates. In Figure 6, we plot the weighted borrowing rate together with the amounts borrowed and the usury ceiling. One can note a clear downward trend in the interest rate series. From 1640 to 1680, borrowing rates declined by 350 basis points to 4 percent. This decline paralleled that observed for the Dutch Republic of Amsterdam and temporarily converged to it by 1681. Interest rates declined before the Civil War and, in 1651, reached 6 percent. In 1651, the Commonwealth Parliament lowered the usury rate from 8 percent to 6 percent. Charles II reaffirmed the act after the Restoration in 1661.
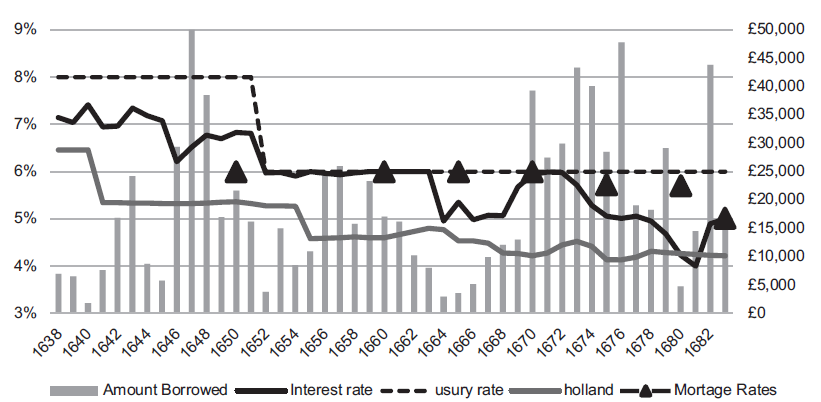
FIGURE 6 BORROWING BY THE CORPORATION OF LONDON: 1638–1683
Sources: London: COL/CHD/LA/01/001-002; COL/CHD/CT/01/002-017. Borrowing rates weighted by loan amount. Mortgage rates from Ward (Reference Ward1974, table IV, p. 166). Average weighted mortgage rate. The last observation, for 1685, is plotted for 1683.
Province of Holland: Average cost of debt from Wantje Fritschy Gewestelijke Financiën ten tijde van de Republiek der Verenigde Nederlanden 1572–1795.
It is likely that during Cromwell’s protectorate and the Restoration’s initial years, the usury rate was a binding constraint on borrowing rates (Munro Reference Munro2003). Beginning in 1664, we observe a decline of interest rates toward 5 percent (in 1665). The rebuilding of London after the Fire and the Third Anglo-Dutch War outbreak placed considerable demands on the capital market. By 1672 during the Crown’s default—the Stop of the Exchequer—rates reached 6 percent again. However, the peak was shortlived, and already in 1673, rates started their rapid descent and reached 4 percent by 1681. In 1682, when the Corporation of London borrowed heavily to avert default, rates increased to 5 percent. Our series ends in 1683 when the City defaulted on its debt services and stopped borrowing.
In January 1672, Charles II stopped paying interest on loans he raised mainly to finance the fleet (Horsefield Reference Horsefield1982). The infamous “Stop of the Exchequer” lasted throughout the 1670s. In 1677, the treasury paid interest on the defaulted debt at 6 percent (Li Reference Li2019a). Li (Reference Li2019a, table 7) shows that discounted defaulted debt was trading in the secondary market at an average rate of 15 percent.Footnote 33 Simultaneously, unsecured borrowing by the Corporation of London, albeit constrained by the usury ceiling, was financed at some 200 basis points less than the sovereign debt.Footnote 34
The decline of borrowing rates, especially after 1660, supports Roseveare’s (1991) claims that the Restoration marked the beginning of the Financial Revolution in England. During Charles II’s reign, interest rates on the Corporation of London’s debt declined by 200 basis points to reach 4 percent. While the Corporation’s default in 1683 could have put a brake on this development, the development of a secondary market for the defaulted debt can be considered a silver lining.Footnote 35 The rate of 4 percent would be reached again only in the 1720s and remained the average Consol yield in the eighteenth century (Sussman and Yafeh Reference Sussman2006). These findings offer further evidence that the Glorious Revolution’s effect on borrowing costs was not as significant as claimed by North and Weingast (Reference North and Weingast1989).
Comparison with European Municipalities
To provide additional robustness, we compare London borrowing rates to those of municipalities on the Continent. For comparison, we utilize the data collected by Chilosi, Schulze, and Volckart (Reference Chilosi, Schulze and Volckart2018). For the period 1638 to 1683, only three cities have almost complete data: Genoa, Sienna, and Hannover. The city with the strongest correlation with London is Genoa (see Online Appendix Table A-6). To account for the incomplete data from individual cities, we grouped the 49 cities into seven geographical/political regions: Belgium, France, Germany, Hansa, Holland, Italy, and Naples. We then used panel data estimation to estimate time trends for each region.
Except for the Kingdom of Naples, all regions exhibited a decline during the period (Figure 7). The largest decline was in Belgium, and the smallest was in Germany. However, when compared to European municipalities, the convergence of the London rates is also apparent. These results strengthen our conclusion that London was integrated with financial developments on the Continent and experienced financial developments that caused its borrowing rates to converge with those in Europe.Footnote 36
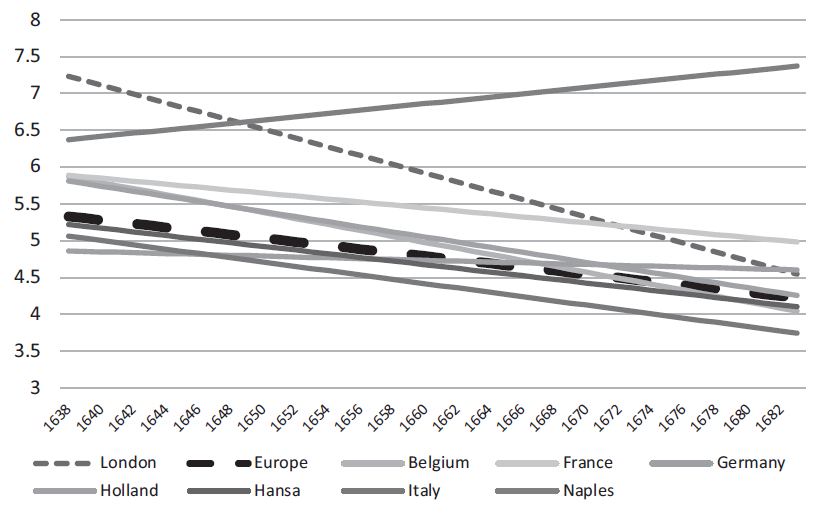
FIGURE 7 TRENDS IN EUROPEAN MUNICIPAL BORROWING RATES (PERCENT): 1638–1683
Notes: Linear time trends estimated from panel data estimation with City fixed effects based on 49 municipalities grouped into 7 regions. The rate for Europe is the average time trend of all municipalities.
Sources: Chilosi, Schulze, and Volckart (Reference Chilosi, Schulze and Volckart2018) and https://journaldata.zbw.eu/dataset/1d5fb8dc-7443-4ffe-917a-547fd2f8ce14/resource/3c3ccfb0-519d-4601-8412-2750908f233b.
THE DETERMINANTS OF INTEREST RATES PAID BY THE LONDON CORPORATION
This section analyzes the determinants of the Corporation of London’s borrowing cost. As we saw in the previous section, there was a common trend of declining interest rates in Europe in the seventeenth century. Interest rates in London not only declined but declined much faster than the average municipality in Europe and eventually converged to those of Amsterdam, the most developed financial center of the time (Figure 6). Econometric analysis allows us to test the hypothesis that the decline in the cost of borrowing of the Corporation of London reflects both the declining interest rates in Europe proxied by the cost of borrowing in Amsterdam and the financial developments we documented earlier. We begin by presenting the empirical framework that we use to test econometrically for the determinants of the cost of capital. We then present and discuss the results of the estimations.
Empirical Framework
In the previous section, we established that the Corporation of London was a significant financial institution in London during the seventeenth century alongside goldsmith-banks and joint-stock companies. Goldsmith-bankers and the joint-stock companies operated within an international capital market. A standard assumption in the finance literature is that a single asset’s demand elasticity is infinitely elastic (Scholes Reference Scholes1972).Footnote 37 Therefore we can assume that the Corporation of London faced a perfectly elastic supply of capital. In other words, its borrowing did not affect the price of capital in the West-European financial market. Following the bond pricing literature (Acharya, Amihud, and Bharath Reference Acharya, Amihud and Bharath2013), the nominal cost of borrowing of a particular borrower it i, Footnote 38 is equal to the time-varying risk-free rate r t, which is exogenous to the borrower plus an asset-specific time-varying risk premium α t, and a time-varying liquidity premium l .Footnote 39
 $${i_t} = {r_t} + {\alpha _t} + {l_t}$$
The time-varying risk premium captures the specific default risk associated with the bond. Market participants monitor the debtor’s ability to meet the interest payments and to redeem its bonds. Standard measures for default risk include leverage (the stock of debt relative to income), deficits, debt service to income, etc. Investors also require a liquidity premium to reflect the transaction costs of trading a financial asset (Amihud, Mendelson, and Pedersen 2006). Therefore, the Corporation of London’s cost of capital could deviate from the West-European risk-free rate because of its default-risk or the relative costs of transacting its financial assets in London.
The assumption of an elastic supply of capital allows us to identify a causal relationship between the supply of capital and its price. When capital is perfectly elastic, the price is determined according to Equation (1) and the quantity according to the borrower’s demand. From the Restoration to 1680, England’s annual trade surplus doubled from about 500,000 to 1 million Pounds.Footnote 40 This implies that England accumulated almost 15 million pounds of financial claims on its trading partners, mostly in Western Europe, over this period of 20 years. While the Corporation was not a marginal financial actor, and its activities contributed to London’s financial development, it was small enough, relative to these large volumes of wealth accumulated through trade, such that its demand for capital did not affect the risk-free rate.Footnote 41
The equation for estimation is:
 $${i_t} = c + \beta {r_t} + {\gamma _i}{\alpha _{it}} + \delta {l_t} + {u_t}$$
Following Sussman and Yafeh (Reference Sussman and Yafeh2006), we assume that Amsterdam is the European financial center and considers the government’s debt of the province of Holland as the risk-free financial asset of the time.Footnote 42 We justify our assumption that the Amsterdam rate is relevant for investors by recalling that a significant number of the lenders to the Corporation also banked with Backwell Bank that was engaged in discounting bills with Amsterdam. Therefore, r t is proxied by Dutch yields. Two series for Dutch borrowing rates are available. The first, based on Gelderblom, Jonker, and Kool (Reference Gelderblom, Jonker and Kool2016), is the tax-free market yields of the provinces’ debt, and the second, is based on the average cost of capital from the financial accounts of the Province of Holland (Fritschy Reference Fritschy2017). Fritschy used a similar measure of the costs of capital as in Sussman and Yafeh (Reference Sussman and Yafeh2006) and divided interest payments by the stock of debt outstanding. In our principal analysis, we used the series provided by Fritschy (Reference Fritschy2017).Footnote 43
To account for the time-varying risk premium of the Corporation of London, α it we introduced a set of dummy variables that capture England-specific events that could have affected the Corporation’s ability to service its debt. The English Civil War: 1642 to 1648; the Protectorate: 1649 to 1659; the year of the Restoration (1660); the three Anglo-Dutch Wars (1652–4, 1663–5, 1672–4) the Stop of the Exchequer, 1672, when King Charles II defaulted on the interest payments of the government’s debt. Two notable events that affected London were the plague of 1665 and the Great Fire of 1666. We also calculated some financial ratios related to the fiscal borrower-risk of the Corporation of London: (1) the budget deficit,
(2) the debt to income ratio (leverage), (3) the debt service to income ratio, and (4) the current ratio—cash reserves to current liabilities.Footnote 44
To proxy for the liquidity premium, we use two measures: the outstanding stock of debt of the Corporation of London divided by nominal GDP (Sahay et al. Reference Sahay, Martin Čihák, Adolfo Barajas and Diana Ayala2015) and the percent of assigned bonds out of total bonds outstanding. The literature on corporate debt assumes and has empirically validated that the larger the debt, the more liquid it is (Houweling, Mentink, and Vorst Reference Houweling, Mentink and Vorst2005). Habakkuk (Reference Habakkuk1952) and Keirn and Melton (Reference Keirn and Melton1990) previously attributed part of the decline in London’s interest rates in the seventeenth century to the increased liquidity of the Corporation of London’s debt. Ventura and Voth (Reference Ventura and Voth2015) argue that rising public debts in England in the eighteenth century had crowding-in effects and increased the liquidity of debt assets that crowded in financial investment from more traditional (e.g., land) investments. Because GDP could be endogenous to the cost of capital, we used the one-year lagged measure of debt to GDP.
A standard measure used to measure assets’ liquidity is asset turnover.Footnote 45 Turnover is measured by the volume of transactions relative to the stock of an asset. Since there was no organized secondary market for debt in London, we use as a proxy the share of bonds that were assigned (traded) out of the total number of outstanding bonds.Footnote 46 Since we observe assigned bonds (turnover) only when the bonds are redeemed, we do not know when the actual assignment took place. On the one hand, this introduces a measurement error that could bias our results downward. On the other hand, endogeneity is less of a concern.Footnote 47
The cost of borrowing by the Corporation of London was likely constrained by the usury law of 1651 (Figure 6). Because for some years, we believe that our outcome variable, the cost of borrowing, is censored, we estimated Equation (2) using censored (Tobit) regressions. In our estimations, we also controlled for the composition of borrowing by bond type to capture any possible effect the type of bond could have on the borrowing rate.Footnote 48
Results
We estimate the cost of borrowing for the Corporation of London using Equation (2) and present the results of our parsimonious estimations in Table 3, Columns (1) to (3). Complete estimation results that include variables that were statistically insignificant appear in Online Appendix Table A-6.
Our main result is that the Corporation of London’s borrowing rates, our dependent variable, co-moved with Dutch rates. The coefficient of the Dutch borrowing rate in all our regressions is not significantly different from 1. This result suggests that the trend-decline in interest rates we observed in London was not significantly different from that on the Continent.Footnote 49
Table 3 ESTIMATING ANNUAL BORROWING COSTS OF THE CORPORATION OF LONDON
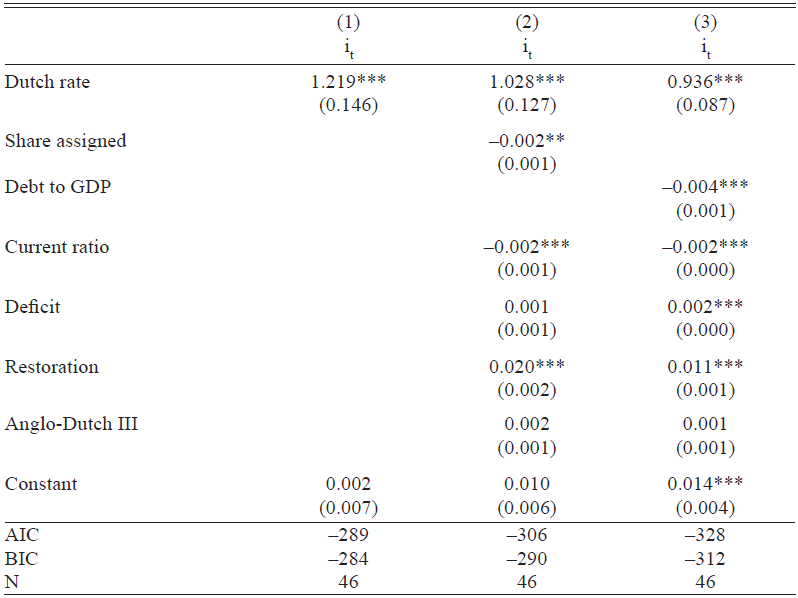
Notes: Standard errors are in parenthesis.
*** p<0.01, ** p<0.05, * p<0.1
Regressions were estimated using Tobit in Stata with weighting by annual loan amount using robust standard errors. The debt to GDP, current ratio, and deficit were standardized.
Descriptive statistics for the data used are provided in Online Appendix Table A-1. Data for replication and Stat code, see Reference SussmanSussman (2022).
Sources: COL/CHD/CT/01/002-017. Dutch rates: Wantje Fritschy Gewestelijke Financiën ten tijde van de Republiek der Verenigde Nederlanden 1572–1795. GDP from Broadberry et al. (Reference Broadberry, Bruce Campbell, Overton and van Leeuwen2011). Dummy variables equal 1 for Restoration (1660); Third Anglo-Dutch War (1672–4).
Interest rates in London not only co-moved with Amsterdam, but they also converged by 1680 (Figure 6). As captured by either the share of assigned bonds out of total bonds (Column (2)) or the Corporation debt to British GDP ratio (Column (3)), the liquidity premium contributed to this convergence. The regression results also show that the Corporation’s time-varying risk premium also significantly affected the Corporation’s borrowing costs. While the regression results (Columns (2) and (3)) are very similar, those based on the Corporation debt to British GDP ratio are somewhat more significant. The AIC and BIC information criteria point in that direction too. In the following analysis, we discuss the results reported in Column (3).Footnote 50
Since London’s interest rates co-moved with those of Amsterdam, and the regression coefficient is 1, we can frame the analysis of London-specific developments in terms of the spread—the yield difference between London and Amsterdam. We sum all the risk premia effects (the deficit, the current ratio, the Restoration, and the Third Anglo-Dutch War) and compare them with the liquidity premium effect as captured by the Corporation debt to British GDP ratio.
Our findings show (Figure 8) that the early phases of the Civil War increased the spread—primarily because the perceived default risk of the corporation increased. The financial position of the Corporation stabilized during the Interregnum. However, the liquidity premium increased as financial activity declined. According to our results, the Restoration event was associated with a large increase in the risk premium (110 basis points) that probably reflected the uncertainty of the monarchy’s return. However, that risk immediately declined. From 1661 until the London Fire of 1666, the fiscal situation of the Corporation improved, and the default risk premium declined.
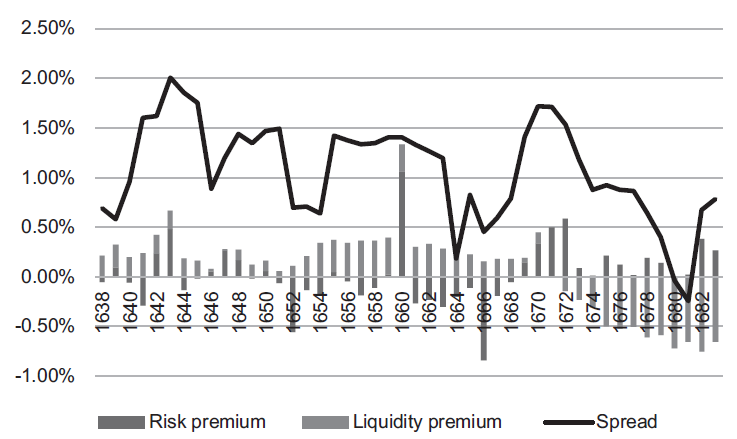
FIGURE 8 THE SPREAD BETWEEN INTEREST RATES IN LONDON AND AMSTERDAM AND ITS DETERMINANTS: LIQUIDITY TIME-VARYING RISK PREMIUMS: 1638–1683
Note: Based on the estimation results reported in Table 3, Col. (3).
After the London Fire, the large deficits of the Corporation associated with rebuilding expenditures and the decline of rentals revenues (Coffman, Stephenson, and Sussman Reference Coffman, Stephenson and Sussman2022) increased the default risk and the spread with Amsterdam. However, the Third Anglo-Dutch War had a modest impact on default risk (10 basis points). Finally, the decline of the spread to zero in 1681 was associated with a large decline in the liquidity premium. In sum, during the period under consideration, the decline in the liquidity premium contributed about 100 basis points to the decline in the spread between London and Amsterdam.
Our interpretation of the contribution of increasing liquidity to the convergence of borrowing rates between London and Holland could be challenged by an argument that after the “Stop of the Exchequer,” the Corporation benefitted from flight-to-safety capital flows. Therefore, the decline in the cost of capital should have been captured by a decline in the risk premium on the Corporation debt, rather than by the debt to GDP variable or share of assigned debt that we used to capture the liquidity premium. Empirically the effect of a missing flight-to-safety variable would be captured by the residuals of the regression. Inspection of the residuals (Figure A1 in the Online Appendix) shows that except for 1680, when the actual borrowing rate was lower than the predicted rate, the specification we used accounts for the convergence of rates.
ESTIMATING THE RISK PREMIUM ON UNSECURED DEBT
The Corporation of London borrowed throughout the period without offering any collateral or employing a sinking fund to assure investors, whereas the Crown borrowed against tax revenues (Coffman Reference Coffman2013b). It is interesting to assess the effect of securing borrowing by tax receipts on borrowing costs, as it allows us to compare reputation with explicit guarantees. In most cases, this comparison is difficult because the two borrowing mechanisms differ between borrowers.
Following the London Fire of 1666, Parliament set up a Coal Cash Fund that the Corporation of London administered. Parliament assigned the Coal Cash Fund a coal tax to finance the public rebuilding.Footnote 51 Because of an initial shortfall of tax revenues, the Coal Cash Fund resorted to borrowing from individuals in 1672 and 1673. Therefore, for two years, the Corporation continued to borrow without offering security on its debt and began borrowing on behalf of the Coal Cash Fund backed by coal tax receipts. The total amount borrowed on the two accounts from January 1672 to September 1673 was comparable—£69,000 and £61,000, respectively. This allows us to assess the relative effects of reputation and explicit guarantees on borrowing costs.
In Figure 9, we plot the weighted (by loan amount) average of monthly borrowing rates and the corresponding borrowing amounts of secured and unsecured debt. We can divide the period into two—the first, from January 1672 to January 1673, and the second, from February to September 1673. During the first sub-period, the unsecured borrowing rate was 6 percent, and that of secured borrowing was lower. The average risk premium—the difference between the two borrowing rates—was about 50 basis points in that sub-period.
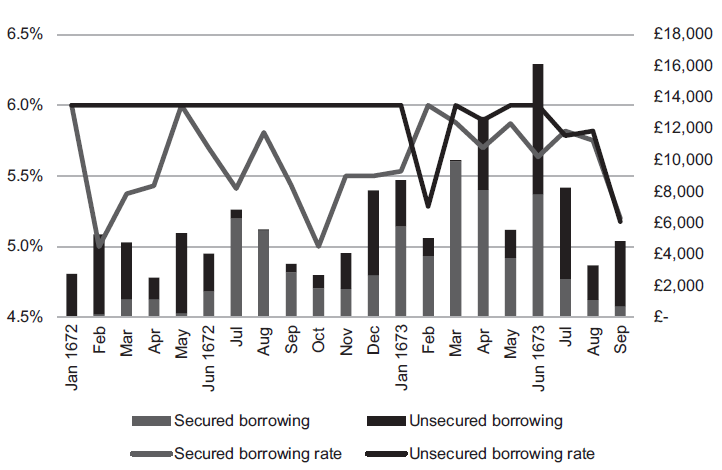
FIGURE 9 SECURED VERSUS UNSECURED BORROWING BY THE CORPORATION OF LONDON: 1672–1673
Sources: COL/CHD/LA/01/001 and COL/CHD/DM/01/001.
In the second sub-period, the spread between the borrowing rates is much smaller and eventually disappears. One possible explanation for the reduction in the spread is the perception that the precedent of granting the Corporation of London the right to collect a tax could be applied in other circumstances. This explanation is consistent with the literature on the effect of fiscal capacity and the cost of (sovereign) borrowing.Footnote 52 Alternatively, once the effect of the financial crisis triggered by the “Stop of the Exchequer” subsided and interest rates declined (Figure 6), the premium commanded by secured debt disappeared. We conclude that in typical times, reputation may be as good as collateral. During a financial crisis, investors prefer a harder commitment.Footnote 53
CONCLUSIONS
The financial development of London in the seventeenth century, as reflected in borrowing costs of the Corporation of London, advanced along similar lines to those of its rival Amsterdam. In both countries, like most other countries on the Continent, the cost of capital declined through the seventeenth century by between 300 and 400 basis points. The supply of capital came mainly from London’s wealthy citizens and the gentry who resided in its vicinity. During the seventeenth century, and especially after the Restoration, the economy experienced financial development. The volume of financial assets held by individuals increased, the number of bondholders increased, bonds started to be assigned in a secondary market, and investors diversified their portfolio of financial assets, holding goldsmith-bank deposits and Corporation of London’s debt. The amount of the Corporation of London’s debt alone increased threefold.
Our econometric analysis shows that the declining interest rates we observe in the data were also the manifestation of financial development embodied in a rising debt stock that increased liquidity (Gorton and Pennacchi Reference Gorton and Pennacchi1990). More liquid capital markets and lower cost of credit following the Restoration probably helped propel the English economy forward. Our findings, therefore, offer support for the view that the break from the Malthusian trap and the accelerated growth that led to the Industrial Revolution in England began by the mid-seventeenth century (e.g., Clark Reference Clark2005; Kelly and Ó Gráda Reference Kelly and Gráda2016; Broadberry et al. Reference Broadberry, Bruce Campbell, Overton and van Leeuwen2015).
In an age when governments did little to finance growth, the relevant prism to evaluate the finance-growth nexus should be the development of non-governmental financial intermediaries. The contribution of the state was to allow them to operate. In that regard, the “Quo Warranto” revocation of the Corporation of London’s rights in 1683, after its default, is perhaps the equivalent of allowing a systemically important bank to fail. Arguably, this was a setback to the financial development that occurred during the Restoration.
This financial setback did not last long. In 1688, immediately following the Glorious Revolution, Parliament restored the Corporation’s charter, restructured its debts, and provided it with tax revenues to service and repay the debt. This bail-out and financial restructuring increased the public’s confidence in financial markets. We conclude this paper with yet another twist in the story of the Glorious Revolution’s contribution to the (continuation of) the financial revolution and economic growth in Britain. It might not have started a financial revolution, but it strengthened its institutional underpinning.


 Open access