Hostname: page-component-8448b6f56d-qsmjn Total loading time: 0 Render date: 2024-04-19T14:27:09.478Z Has data issue: false hasContentIssue false

Marketing and Social Structure in Rural China Part II

Published online by Cambridge University Press:  23 March 2011

Get access

Extract

In A.D. 1227, during the Southern Sung, the four hsien on the peninsula in Chekiang which is dominated by Ningpo supported twenty-six rural markets; six and a half centuries later, during the Kuang-hsü reign, there were approximately 170 rural markets in the same territory. Chin-t'ang hsien, Szechwan, had four rural markets at the beginning of the K'ang-hsi reign in 1662; by 1875 the number had increased to thirteen and by 1921 to thirty-two. Rural markets in Yen-shan hsien, Hopei, rose from twenty-three in 1868 to thirty-seven in 1916. By what principles and in accordance with what patterns do markets thus proliferate on the landscape?

Type
Articles
Copyright
Copyright © Association for Asian Studies, Inc. 1965

Access options

Get access to the full version of this content by using one of the access options below. (Log in options will check for institutional or personal access. Content may require purchase if you do not have access.)

References

92 I am grateful to the following scholars for having given me the benefit of their criticism: Knight Biggerstaff, Allan G. Feldt, Richard C. Howard, John W. Lewis, Ta-chung Liu, John W. Mellor, Chandler Morse, Morris E. Opler, Lauriston Sharp, Robert J. Smith, and Arthur P. Wolf, all of Cornell University; Brian J. L. Berry (Chicago), Albert Feuerwerker (Michigan), Maurice Freedman (London School of Economics), Ping-ti Ho (Chicago), Sidney Mintz (Yale), Rhoads Murphey (Michigan), Peter Schran (Yale), Denis Twitchett (School of Oriental and African Studies), Donald E. Willmott (Toronto), Mary C. Wright (Yale), C. K. Yang (Pittsburgh), and Basil S. Yamey (London School of Economics). I regret that it has not been possible at this stage of the research to implement all of the suggestions for improvement which have been received or to take up every issue raised.

93 Pao-ch'ing Ssu-ming chih, Pao-ch'ing 3 (1227), ch. 13 (Yin hsien), ch. 15 (Feng-hua hsien), ch. 17 (Tz'u-ch'i hsien) and ch. 19 (Ting-hai, now Chen-hai, hsien). Yin hsien chih, Kuang-hsü 3 (1877), ch. 2. Chen-hai hsien chih, Kuang-hsü 5 (1879), ch. 4. Tz'u-ch'i hsien chih, Kuang-hsü 25 (1899), ch. 3. Feng-hua hsien chih, Kuang-hsü 34 (1908), ch. 3.

94 Chin-t'ang hsien chih, Min-kuo 10 (1921), ch. 1.

95 Yen-shan hsien chih, T'ung-chih 7 (1868); Yen-shan hsin-chih, Min-kuo 5 (1916). Data summarized in Katō, p. 5.

96 Jen-chūn, Chang, Kuang-tung yü-ti ch'üan-t'u [Comprehensive Atlas of Kwangtung] (Canton, 1897), Vol. I, p. 41Google Scholar. Chieh-yang hsien cheng-hsü chih, Min-kuo 25 (1936), ch. 1.

97 It is, of course, a direct reflection of inexorable growth in the rural population.

98 The rise and fall of individual markets is treated by C. K. Yang in A North China Local Market Economy, 1944, Ch. VI, and by Kuramochi Tokuichirō in “Shisen no joshi” [”The Local Markets of Szechwan”], Section 5.

99 Figures 5.1 and 5.2 present the sequence with considerable ellipsis. The circular marketing areas first expand until they meet, and then, as Lōsch puts it, “The corners [i.e., interstices between die circles] can be utilized by pressing die circles together until a honeycomb results.” The Economics of Location, p. 109; see also Fig. 23 on p. 110.

100 The assumptions on which distribution models are normally based—namely, that topographical disturbances are minimal and that relevant resources are uniformly distributed—become manifestly unreal in the case of Model A. Nonetheless, even for mountainous landscapes a geometric model retains utility as an abstract schematization—vide Figure 2—and as a means of laying bare certain principles of change.

101 The argument as stated assumes that the arable lands available to the village in a mountain valley are no less productive than those found in the plains. In some empirical cases, there is indeed little to choose between the arable land on the floor of mountain valleys and that in the plains below them; that is, a compensatory balance may obtain among the various factors which affect the cash value of output (or, if different in the case of food crops, the energy yield) per unit of cultivated land: soil fertility, soil structure, microclimate, suitability for crops of lower or higher cash value (or energy yield), and so forth. Where the factors are not in balance, however, the differential typically favors the plains. In particular, while the culture of high-energy food crops such as rice may be feasible in a given plain, it is often precluded in nearby mountain valleys because of inadequate water supply and /or a shorter growing season stemming from the higher altitude. Moreover, the slopes of mountain valleys are generally less fertile than the valley floors. In consequence, the arable lands available to the mountain village tend to be less productive than those available to the plains village. Thus the contrast noted in the text—that the ratio of arable land to total land area is lower in mountainous landscapes than on the plains—is normally sharpened by the additional fact that such arable land as is available to mountainous villages tends to be less productive than that cultivated by villagers on the plains.

102 In other words, the Model-A sequence is drawn at a smaller scale than is the Model-B sequence in order to bring out the similarity of pattern in settlement distribution at the beginning of the intensification cycle and the difference in pattern at the end.

103 Under certain circumstances a group of villages may found a new market with deliberate intent to encroach on the area supporting an already existing market. A case in point is described by C. K. Yang, p. 24: “The Tuanchiachuang market [Tsou-p'ing hsien] was first organized about 1900 by eighteen villages surrounding it, as a measure of combatting the excessively heavy taxes levied by tax farmers in Tungchiachuang market, about two miles to the south. … The market in Tungchiachuang. … declined considerably after the emergence of … its rival … ” A second case is provided by Tai Po in the New Territories of Hong Kong. In the 1880's the Tai Po market was controlled by a localized lineage of the Tang people who, as masters of the market, permitted themselves to claim excessive privileges and to harass marketers from other lineages. Tang control of the market was repeatedly challenged by the Man people of another village, and on suffering a decisive setback in their campaign to force a relaxation, the latter organized a league of already existing intervillage units in order jointly to establish, in 1893, a new market in the close vicinity of the old. It is from the new market, which quickly gained supremacy, that the present town of Tai Po developed. I am grateful to Dr. Maurice Freedman for details of the case. Also see Sung Hok-p'ang, “Legends and Stories of the New Territories: I Tai Po,” Hong Kong Naturalist, VI (May 1935).

In the more usual circumstances in which the older market enjoys the good will of its dependent villages, it has a competitive advantage over a new market established unduly near to it. C. K. Yang (p. 24) cites several cases of minor markets which, through unwise siting, were short-lived.

While it is probable that new markets are not normally established at locations which bring on their founders the ire of neighboring settlements, benevolent intent is not assumed by the model here being presented. A new minor market established on a site where it can succeed only at the expense of a neighbor's demise will either succumb to the competition or replace the original market. If die site is a patent threat to an existing market, the latter may fight back with political as well as economic weapons. “A market was set up in the village Shiliu in the northern part of … [Tsou-p'ing] county in 1914. Only half a mile from an old market in the neighboring county, it was abolished within a few days of its establishment by … order of … [the Tsou-p'ing] County Government upon a protest lodged by the old market.” C. K. Yang, p. 24.

104 J. E. Spencer, “The Szechwan Village Fair,” 1940, caption to Figure 3, p. 51.

105 To cite an example from southern Szechwan, one may contrast Nan-ch'uan hsien, whose terrain is almost wholly mountainous, with its immediate neighbor, Pa hsien, which incorporates some sizeable alluvial plains along die Yangtze and Chia-ling rivers. Marketing structures in the former approximate Model A almost exclusively, whereas those in the latter approximate Model B in considerable number. Accordingly, standard marketing systems (in their manifestation as townships—see below) are in Nanch'uan larger in average area (76 sq. km. vs. 41) but smaller in population (7,659 vs. 11, 558) than in Pa hsien. The contrast between standard marketing systems included in Model-A structures as against those distributed in accordance with Model B is more consistent with respect to area than to population. For, as shown in Table 1 (Part I) and in Table 5 below, at very high levels of population density—which, of course, tend to be associated with fertile plains—the population of standard marketing systems may be seen to vary inversely with density and hence directly with area.

106 One expects the ratios to rise higher in the case of Model A than of Model B because intensification is proceeding toward the point where the 18 villages of the original standard marketing area will have increased to 72 in the former case but only to 54 in the latter. If it be assumed for purposes of comparison that the first of the new set of standard markets will be established only when the potential area of each has come to include 12 villages, then the critical point is 54 villages for Model A as against 42 villages for Model B. Furthermore, since the villages in Model-A landscapes normally consist of fewer households, the minimum number required to support a new standard market may be higher than is the case with the larger villages on Model-B landscapes. It is noteworthy that the only village-to-market ratios in excess of 50 which are well authenticated in the literature have been reported for a hilly region on the Shantung peninsula: In the British territory of Wei-hai-wei tiiere were at the turn of the century, 315 villages but only 6 market towns. Johnston, Reginald F., Lion and Dragon in Northern China (New York, 1910), p. 129Google Scholar.

107 Chang Jen-chün (see Footnote 96 above). The number of markets is for some reason omitted in the cases of Kao-yao hsien and Ch'ih-ch'i t'ing. For purposes of computation, the former was assumed to have 34 and the latter 2, in accordance with the ratios of their contiguous neighbors.

108 The regional population figures which were used in computing population densities are estimates based on a number of more recent hsien enumerations. They assume a total population for the province in 1897 of approximately 26 million and a rural population of 23.4 million.

109 These ratios are the number of villages per rural market. I have estimated, on the basis of data supplied by gazetteers for the hsien in which the various cities are located, that of the putative total of 1691 markets for Kwangtung as a whole some 73 were strictly urban. These have in each case been excluded from the regional total of markets prior to computing ratios.

110 The growth of Hai-k'ou and Shao-kuan into something approaching cities is a 20th-century development.

111 The two factors are interdependent, at least in certain circumstances. For instance, once a given landscape has been fully occupied and all of its arable land brought under efficient cultivation, further population growth may eventually precipitate a decline in the average amount of marketing per household. When the addition of another person to the labor pool working a given farm increases production by an amount which is less than he consumes, then the household in question will net a smaller surplus with which to enter the market. In theory, the point may be reached where increases in the number of households through population growth could, by forcing households to consume an ever larger proportion of their product, so decrease the amount of marketing per household that the total amount of marketing done in the area would begin to decline. While change in this direction has surely occurred in China—it may, for instance, underlie a part of the economic stagnation which has been considered characteristic of the final stages of the dynastic cycle—it must only rarely have progressed to the point of decline in the total volume of market transactions. For one thing, households do not passively watch their surplus dwindle, but rather are stimulated to increase their marketable product by developing cottage industry, say, or by adding value to their agricultural produce through labor-intensive processing. Furthermore, declines in per capita income which stem from growing population pressure on the land are likely to increase marketing activity in staples as households begin selling their crops of higher quality grain (rice or wheat) in order to buy cheaper staples (kaoliang, millet, maize or sweet potatoes) of inferior quality. Cf. Buck, J. Lossing, Chinese Farm Economy (Chicago, 1930), pp. 356365Google Scholar.

112 Cf. Spencer, p. 52: “Since the fair pattern [i.e., market-day schedule] is determined by the village [i.e., market-town] elders in their own way, one cannot lay down any simple limits of business volume or patronage which produce certain frequencies.”

113 Yin hsien chih, Kuang-hsü 3, ch. 2. Yin hsien Cung-chih, Min-kuo 26, Yü-ti chih, ts'e 3 and 7.

114 Village-to-market ratios were computed for the various ch'ü into which the hsien was divided in 1937. Since ch'ü boundaries do not correspond closely to either zonal or marketing-area boundaries, the ratios within each zone cannot be precisely cited.

115 J. Lossing Buck's study of the rural economy in selected Chinese provinces, 1922–25, gives some indication of the levels of self-sufficiency attained by peasant households under more or less commercialized conditions. Some 1,389 households in eight North China localities were found on the average to furnish from their farms nearly three-quarters of the goods and services consumed annually. By contrast, some 981 households in five localities of East Central China were shown to furnish from the farm less than three-fifths of their annual consumption on the average. “This is indicative [notes the investigator] of the greater commercialization of agriculture in East Central China, where the large city population of the nation is centered.” The selected rural households of East Central China purchased 98 per cent of their clothing, as against 60 per cent for the North China households; they purchased 24 per cent of their food, as against only 12 per cent for the North China households. China's Farm Economy (Chicago, 1930), PP. 391–93Google Scholar.

116 Buck's monumental study of China's rural economy, 1929–33, provides data on the average cost, in silver dollars per ton-mile, of transporting agricultural products to market. The most commonly reported traditional forms of transport averaged, for both short- and medium-distance hauls, as follows: junk 21¢ per ton mile, animal-drawn cart 40¢, wheelbarrow 63¢, pack donkey 71¢, and runner using a carrying pole $1.39. By contrast, the costs per ton-mile were, for medium-distance hauls, 8¢ by steamboat and 9¢ by railroad. Data computed from Buck, J. Lossing, Land Utilization in China, Statistics (Nanking, 1937), Tables 4 and 5, pp. 346–47Google Scholar.

117 As of the early 1930'5, all the rivers shown in Figure 7 were well served by steam launches operating out of Ningpo. Surfaced roads had been completed from the city south to Feng-hua, northwest to Tz'u-ch'I and to Kuan-hai-wei, and northeast to Chen-hai. Motor-bus service connected Ningpo with Feng-hua, , Chen-hai, and Tz'u-ch'i, . China Industrial Handbooks: Chekiang (Shanghai, 1935), pp. 115122, 847, 872Google Scholar.

118 The markets of Zones B and C exhibit more irregular than regular market-day schedules, and in this regard Ningpo's hinterland is typical of fertile plains around other modernizing cities. This situation arises because the strong commercialization to which such areas are subjected quickly brings them to the climax of the intensification cycle. As new markets are founded and old markets increase the frequency of their schedules, it becomes increasingly difficult for a standard market to achieve or maintain scheduling compatibility with all the intermediate markets on which it is dependent. In many cases, the only way to avoid conflict altogether is to alter die original schedule somewhat from its regular pattern.

As an example, we may take a Model-A distribution in which a standard market with a regular 2–7 schedule is dependent on intermediate markets with 3–8 and 5–10 schedules. If the intermediate markets 
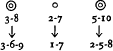
increase their market-day frequency by adopting regular 3-per-hsün schedules as shown, then the standard market is likely to alter its schedule to an irregular 1–7, so as to remain entirely compatible with both intermediate markets. The same change would be advantageous if both intermediate markets adopted even 5-per-hsün schedules. But if both intermediate markets adopted odd schedules, then one would expect the standard market to change to an irregular 2–8 schedule—a change which also maintains the continuity of one market day. (In the case where one intermediate market adopts an odd schedule and the other an even schedule, the standard market would naturally persist in its regular 2–7 schedule so as to avoid complete conflict with either.)

This kind of situation gives rise to several new sets of irregular schedules, namely:

The 2-per-hsün schedules of the first column arise in the situations already illustrated. The 3-per-hsün schedules of the second column and the 4-per-hsün schedules of the third column are favored by markets dependent on higher-level markets all of which adopt odd, or all of which adopt even, every-other-day schedules. The 4-per-hsün schedules in the fourth column are favored by markets in interdependent systems with regular 3-per-hsün schedules. Scheduling compatibility is, of course, more difficult to manage in the case of Model-B distributions, in which each standard market is dependent on three higher-level markets, than in the case of Model-A distributions. This factor, too, fosters scheduling irregularity in the plains near modernizing cities.

119 C. K. Yang, p. 34. The transport system as a whole is graphically described on pp. 27–29; commercialization is analyzed on pp. 34–37.

120 The schedules of all intermediate markets in the hsien had been doubled since the turn of the century. Tsou-p'ing hsien is credited with 14 markets by the 1911 provincial gazetteer, as against 26 found by Yang in 1932–33.

121 Shan-tung t'ung-chih, Hsüan-t'ung 3 (1911), ch. 1–2.

122 The population data used, however, are far from satisfactory. The volume published in 1916 by the Ministry of Interior on the population of Shantung in 1912 appears to be unavailable. Consequently the Chinese Post Office estimates for 1919 (The China Year Book, 1921–22, pp. 14–15) were used subject to correction on the basis of more reliable 1948 data. (The 1919 figure was adjusted in the case of hsien for which the 1919–1948 comparison indicated either a population increase of over 70%, or a net population loss.) The distribution of Table 2 would doubtless be less scattered if reliable population statistics were available for the computation of 1911 densities.

123 Forsyth, Robert C., ed., Shantung, the Sacred Province of China (Shanghai, 1912), pp. 113137Google Scholar.

124 Kent, P. H., Railroad Enterprise in China (London, 1908), pp. 140148Google Scholar.

125 C. J. Voskamp, in Forsyth (1912), p. 135.

126 Yang, C., Hau, H. B. et al. , Statistics of China's Foreign Trade during the Last Sixty-five Years (Shanghai, 1931), p. 91Google Scholar.

127 Somewhat later the following was written by J. E. Baker, after a survey of communications in China: “It may be said that Tsingtau and the leased territory of Kiaochow is better supplied with modern roads than any other part of China. These fine motor roads wind … out thirty miles into the country …, a constant reminder of what other parts of China could be under efficient government.” In Stauffer, Milton T., ed., The Christian Occupation of China (Shanghai, 1922), p. 18Google Scholar.

128 The number of rural markets was compiled from gazetteers by Yamane Yukio: “Min Shin jidai kahoku ni okeru teiki ichi” [“Periodic Markets in North China during the Ming and Ch'ing Periods”], 1960, p. 495.

129 Ch'iao Ch'i-ming, Hsiang-tśun she-hui-ch'ü hua ti fang-fa [Methods for Mapping the Rural Community], 1926, facing p. 6.

130 Arthur P. Wolf, personal communication of 20 August 1964.

131 Rural China: Imperial Control in the Nineteenth Century (Seattle, 1960), Ch. 2Google Scholar.

132 1935 figure cited in Nei-cheng nien-chien [Yearbook, of Internal Administration] (Shanghai, 1936), Seet. B., p. 645. 1948 figures cited in Wei-Ian, Kuan, ed., Chung-hua min-kuo hsing-cheng ch'ü-hua chi t'u-ti jen-k'ou t'ung-chi piao. [Statistical Tables of Administrative Subdivisions together with Land Areas and Population] (Taipei, 1956), p. 81Google Scholar.

133 China on the Eve of Communist Takeover (New York, 1963), p. 122Google Scholar.

134 Kuan Wei-Ian, ed., pp. 24, 30–36, 57–58, 64–67, 95, 100–01.

135 For purposes of this analysis, the Szechwan Basin is defined as shown in Figure 8. No hsien is included which is not wholly or largely contained in the drainage basin of the Yangtze river from just west of P'ing-shan (on the Szechwan-Yunnan border) to just downriver from Yün-yang (in the Yangtze Gorges). In the west and northwest of the drainage basin so defined, large areas which are essentially non-agricultural have been excluded; the hsien in question lie in Szechwan, Sikang and Kansu provinces. In the south, only the northern portion of the drainage basin of the Wu river has been included, the remainder being considered to fall in the geographic region often designated the Yunnan-Kweichow Plateau. (While geographers are not in agreement concerning the southern boundary of the Szechwan Basin, all draw it through the drainage basin of the Wu river rather than at its southern limits.) As delimited here, then, the Szechwan Basin encompasses 3 hsien in Yunnan, 18 in Kweichow, 2 each in Hupeh and Shensi, and 4 in Kansu, in addition to 127 hsien in Szechwan.

136 Large junks navigate the Chia-ling river as far upstream as Lang-chung; and as far upstream on its two tributaries, the Ch'ü and Fou rivers, as San-huai chen and T'ai-ho chen, respectively. Large junks navigate the Wu river as far upstream as Kung-t'an. In the case of the T'o and the Min rivers, large junks can penetrate little or no farther upstream than can steamers, i.e., not much beyond Fu-shun and Lo-shan, respectively. Data on the navigable waterways of Szechwan are taken from:

Hsiao-mei, Chang, Ssu-ch'uan ching-chi ts'an-k'ao tzu-liao [Economic Reference Materials on Szechivan] (Shanghai, 1939), pp. H1–4.Google Scholar

Afanas'evskiĭ, E. A., Sychuan': Ekpnomikp-Geograficheskiĭ Ocherk [Szechwan: An Economic-geographical Essay] (Moscow, 1962), pp. 194208Google Scholar. Tr. in Joint Publications Research Service, No. 15308.

The Chinese Yearbook, 1944–45 (Shanghai, 1946), pp. 728729Google Scholar.

Chen-hsu, Tang, “Water Resources Development of Post War China,” National Reconstruction Journal, VI (1945), 88Google Scholar.

137 From data which I gathered in 1949–50, it appears that virtually no change in the number and distribution of markets immediately surrounding Chengtu had occurred during the entire Republican period. In the whole area mapped in Figure 3, for instance, only one new market had been founded since 1911. In other words, Chengtu's “Zone A” must in 1948 have been considerably less commercialized than Ningpo's Zone C as of 1937.

138 The regression equation of average township area (y) on average density of population (x) is approximately y = .04x + 29 + 7790/x.

139 For the Central Riverine Zone, the regression equation of y on x is approximately y = .04x + 29 + 4900/x.

140 That is, the third term of the regression equation was lowered.

141 All data from Kuan Wei-lan, ed.