


1. Introduction
Tariffication is one of the mechanisms to liberalize trade. Tariffication, the conversion of import quotas to tariffs, is believed to stabilize not only international prices with respect to shocks in world supply or demand but also the domestic price with respect to domestic supply or demand shocks (Abbott and Paarlberg, Reference Abbott and Paarlberg1998; Tyers and Anderson, Reference Thompson, Meyer and Westhoff2010). Some countries have implemented a tariff rate quota (TRQ) as their means of tariffication. However, under TRQs, the price stabilizing effects of tariffication might not be realized if the tariff on over-quota imports is prohibitive (Abbott and Paarlberg, Reference Abbott and Paarlberg1998). Because the criteria used to establish TRQs are unclear and the rules are not transparent, tariffication by means of TRQs can maintain barriers to trade rather than improve market access for agricultural commodities (Abbott, Reference Abbott2002).
The Korean rice market serves as a good case study to examine the impact of a TRQ. Under the General Agreement on Tariffs and Trade (GATT) and the Uruguay Round Agreement on Agriculture (URAA), trade barriers for agricultural products were reduced, but Korean rice was still highly protected relative to agricultural support provided by other Organization for Economic Cooperation and Development (OECD) countries (OECD, 2016). Under the URAA, the tariffication of rice was delayed until the end of 2014, and Korea finally implemented a TRQ for rice imports in 2015. However, trade partners debate whether Korean rice imports at the current over-quota tariff rate are possible because the Korean government set the over-quota tariff rate at 513% (Kim, Park, and Seung, Reference Kim, Park and Seung2014).
The question has been raised as to whether implementing a TRQ fulfills a negotiated agreement. To address the question, Cramer, Hansen, and Wailes (Reference Cramer, Hansen and Wailes1999) examine the impact of rice tariffication, focusing on Japan and world rice markets. The authors use the Arkansas Global Rice Model to show that the TRQs for Japanese rice could be prohibitive. Choi and Sumner (Reference Choi and Sumner2000) investigate a TRQ regime for agricultural products in Korea and the implications for agricultural imports. Chen, Chang, and McCarl (Reference Chen, Chang and McCarl2011) model the international rice market to compare over-quota tariff reduction and quota expansion. Hranaiova and de Gorter (Reference Hranaiova and de Gorter2006) show the effects of tariffication with application to the Korean rice market. The authors find that an expansion of the quota or a decrease in the over-quota tariffs would lead to more Korean rice imports. However, these articles were published well before the TRQ was introduced and based on outlooks that preceded the price surges of the last decade. Moreover, they treat rice as a single commodity, without differentiation. These studies left unanswered the impact of the actual TRQ in current market conditions and the potential for rice differentiation to affect outcomes.
Our approach adds to the literature by recognizing both uncertainty and product differentiation. We build a structural model to represent the Korean rice market and stochastically simulate the possibility of importing rice. Korean rice yield and border price uncertainties are considered in our model for the stochastic process. In addition, rice is broken down into two different types: medium-grain and long-grain rice. Korean consumers primarily consume medium-grain rice but also consume long-grain rice in some restaurants. The volume of long-grain rice imported and consumed remains small but has increased in recent years (Kim et al., Reference Kim, Park, Jo and Son2015). Depending on relative prices, Korean consumers may choose to make bulk purchases of one over the other. One challenge is to represent product differentiation in the absence of historical data about the potential for much greater substitution at as yet unobserved relative rice prices that could occur in certain scenarios. Our model relies on a commonly used representation of consumer demand to explore how Korean imports of medium- and long-grain rice could evolve. In addition to a base case without any adjustment to the TRQ parameters, we estimate medium- and long-grain rice imports given two possible policy changes—namely, (1) a reduction of the over-quota tariff rate and (2) an expansion in the TRQ quantity, or minimum market access (MMA) quantity.
The article is structured as follows. The next section briefly provides an overview of the Korean rice market. In the third section, the model is specified, and the stochastic simulation approach is summarized. The fourth section describes the data, estimation, and calibration. An empirical analysis demonstrating the possibility that Korea can import rice is presented in the fifth section, which includes scenarios and sensitivity analysis. The last section summarizes our findings and draws some conclusions.
2. Overview of the Korean rice trade market
The Korean agricultural industry has been protected by trade barriers and provided domestic support to raise producer returns above world market prices (OECD, 2016). Korean import barriers were reduced as a result of GATT negotiations in the late 1980s and the URAA in 1995 (Choi, Dyck, and Childs, Reference Choi, Dyck and Childs2016). In addition to these agreements, Korea has negotiated free trade agreements (FTAs) with 46 countries, and agreements with 15 countries are still under negotiation (Korea Customs Service, 2018). These agreements have led to a partial opening of the Korean agricultural market and might have helped to increase the share of imported agricultural commodities in the domestic market.
The Korean rice market is still relatively more protected than many other agricultural commodity markets. A producer support estimate for major Korean agricultural commodities, as calculated by OECD (2016), is higher than for most OECD members. The aggregate measure of support, which is a URAA instituted indicator, is also very high because of support for the rice market in Korea. However, actual support, as well as indicators of support, might have to be reduced in the future as a condition of trade deals.
The GATT, URAA, and bilateral FTAs have reduced Korea’s rice import barriers. Under the URAA, the Korean government chose a TRQ with two categories. One category is a country-specific quota (CSQ) that allocates separate import rights to each of China, the United States, Thailand, and Australia. The CSQ increased gradually to 4% of total rice consumption by 2004. From 2005 to 2014, the CSQ was constant at the 2004 level, and an additional import quota was allocated based on a bidding process that was not restricted to the CSQ countries. After the tariffication in 2015, the TRQ amount was set at the TRQ amount (408,000 metric tons) in 2014 that is subject to the in-quota tariff of 5%, and over-quota imports face a 513% tariff (Kim, Park, and Seung, Reference Kim, Park and Seung2014). Although there is no specific Korean policy to expand the potential for rice trade at this time, officials note the pressure of trading partners to consider doing so (Ministry of Agriculture, Food and Rural Affairs [MAFRA], 2019), and popular press and trade journals suggest that other parties are interested in or concerned about a reduction in this tariff.
The sum of the world rice price and the over-quota tariff would have been much greater than the domestic rice price if the current system had been in place between 2005 and 2014 (Figure 1). Imported Thailand long-grain rice with the over-quota tariff rate would have been one-third more expensive than Korean domestic rice, after applying the 513% tariff rate. This imported rice price would have been priced two times higher than the Korean domestic rice in recent years. The potential for imports in the future, with the TRQ in place, depends on how these prices evolve, as well as on consumer willingness to buy long-grain rice instead of medium- or short-grain rice. These factors can determine the potential for rice imports if there are changes to the TRQ regime in the future.
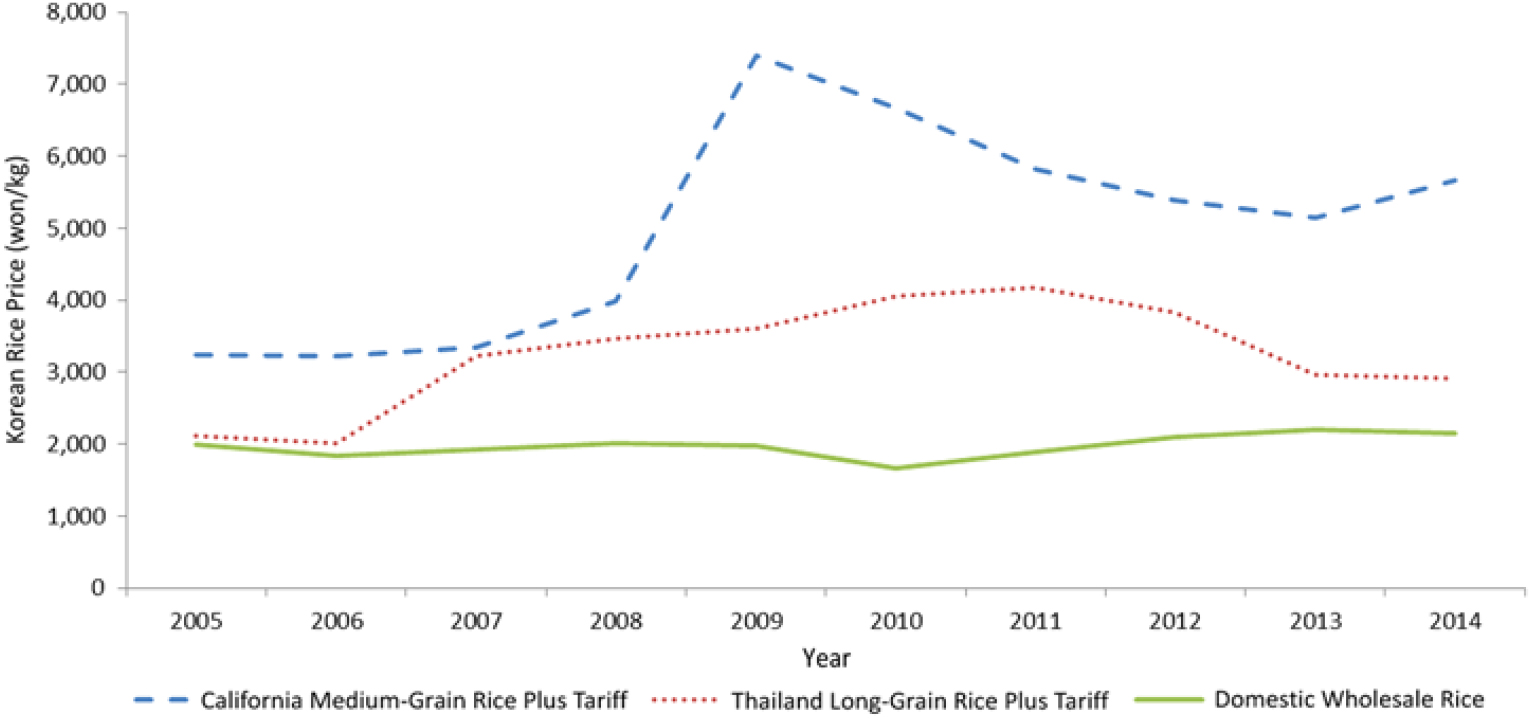
Figure 1. The comparisons of the Korean rice price and hypothetical import prices.
3. Analytical framework
3.1. The model
Abbott and Paarlberg (Reference Abbott and Paarlberg1998) assess TRQs using an approach that can represent recent Korean rice policies (Figure 2). The left panel of Figure 2 shows domestic supply and demand. In the right panel, a world trade market is represented, with Korean excess demand (ED) calculated by subtracting domestic supply from domestic demand. In this analysis, Korea is considered a small country in the world rice market. A small country assumption implies that changes in Korean rice imports will not have important consequences on world prices, so the world price can be treated as an exogenous variable. Korean rice imports accounted for 1% of world rice imports in 2017 (Wailes, Chavez, and Durand-Morat, Reference Wailes, Chavez and Durand-Morat2018).Footnote
1
Such a small share in world trade would tend to support the small country assumption, but this representation is discussed later to highlight how results could be sensitive to this choice. The rest of world excess supply (ES) taking the TRQ into account allows imports up to the quantitative restriction (QR) at the world price with the in-quota tariff rate ( $P_{in,t}^I$
) and imports beyond that point at the world price with the over-quota tariff rate (
$P_{in,t}^I$
) and imports beyond that point at the world price with the over-quota tariff rate ( $P_{over,t}^I$
). If the TRQ quantity is binding, then the domestic price (
$P_{over,t}^I$
). If the TRQ quantity is binding, then the domestic price ( $P_t^D$
) is determined by the domestic supply and demand equilibrium given the set amount of imports. As shown, there are three possible initial situations: (1) ED1, imports below TRQ quota, and the domestic price at
$P_t^D$
) is determined by the domestic supply and demand equilibrium given the set amount of imports. As shown, there are three possible initial situations: (1) ED1, imports below TRQ quota, and the domestic price at $P_{in,t}^I$
; (2) ED2, imports at TRQ quota, and the domestic price in the range between
$P_{in,t}^I$
; (2) ED2, imports at TRQ quota, and the domestic price in the range between $P_{over,t}^I$
and
$P_{over,t}^I$
and $P_{in,t}^I$
; and (3) ED3, imports above TRQ quota, and the domestic price at
$P_{in,t}^I$
; and (3) ED3, imports above TRQ quota, and the domestic price at $P_{over,t}^I$
. Based on this framework, the model is built as follows.
$P_{over,t}^I$
. Based on this framework, the model is built as follows.

Figure 2. Trade regime under the tariff rate quota. Source: Adapted from Abbott and Paarlberg (Reference Abbott and Paarlberg1998).
There are four possible world-to-domestic price transmission equations for two rice types: $P_{m,in,t}^I = f\left[ {P_{m,t}^W \times X{R_t} \times \left( {1 + {\tau _{in,t}}} \right)} \right],$ $P_{m,over,t}^I = {\rm{}}f\left[ {P_{m,t}^W \times X{R_t} \times \left( {1 + {\tau _{over,t}}} \right)} \right],$ $P_{l,in,t}^I = f\left[ {P_{l,t}^W \times X{R_t} \times \left( {1 + {\tau _{in,t}}} \right)} \right],$ $P_{l,over,t}^I = {\rm{}}f\left[ {P_{l,t}^W \times X{R_t} \times \left( {1 + {\tau _{over,t}}} \right)} \right],$
where the low price of the imported medium- or long-grain rice (
 $$P_{m,in,t}^I$$
or
$$P_{m,in,t}^I$$
or $P_{l,in,t}^I$
) is a function of the world price of the medium- or the long-grain rice (
$P_{l,in,t}^I$
) is a function of the world price of the medium- or the long-grain rice ( $P_{m,t}^W$
or
$P_{m,t}^W$
or $P_{l,t}^W$
), the exchange rate (XRt
), and the in-quota tariff rate (τin,t
). The high price of the imported medium- or long-grain rice (
$P_{l,t}^W$
), the exchange rate (XRt
), and the in-quota tariff rate (τin,t
). The high price of the imported medium- or long-grain rice (
 $$P_{m,\,over,\,t}^I$$
and
$$P_{m,\,over,\,t}^I$$
and $P_{l,\,over,\,t}^I$
) depends on the over-quota tariff rate (τover,t
),
$P_{l,\,over,\,t}^I$
) depends on the over-quota tariff rate (τover,t
), $P_{m,t}^W$
or
$P_{m,t}^W$
or $P_{l,t}^W$
, and XRt
.
$P_{l,t}^W$
, and XRt
.
Each individual consumer has a different preference for medium- and long-grain rice. Although some consumers may be willing to buy long-grain rice at a given price relative to medium-grain rice, other consumers may not be willing to switch to long-grain rice unless the price is much lower, or perhaps not at all, at least for some uses. To characterize this phenomenon, a model developed and used by Mussa and Rosen (Reference Mussa and Rosen1978) and Tirole (Reference Tirole1988) is applied to the agricultural commodity demand to represent product differentiation (Moschini, Bulut, and Cembalo, Reference Moschini, Bulut and Cembalo2005).
The utility function of an individual consumer is ${U_i}\left( {{q_m},{q_l},z} \right) = {k^{{1 \over \varepsilon }}}{\varepsilon \over {\varepsilon - 1}}\,{\left[ {{{\left( {{q_m} + {\theta _i}{q_l}} \right)}^\lambda }{z^{1 - \lambda }}} \right]^{{{\varepsilon - 1} \over \varepsilon }}} + y,$
where qm and ql are medium-grain rice and long-grain rice, respectively, z is a substitute good that is assumed to be wheat in this case, y is the numeraire, the parameter λ ∈ (0,1) governs substitution between rice and wheat, the parameter ε > 0 is the overall demand elasticity, and the parameter k > 0 is a scale variable to reflect the market size. The consumer taste parameter (θi) varies among individuals according to the willingness of each one to substitute between rice types.
In the model, no consumers will purchase long-grain rice unless its price is less than an assumed proportion, θH, of the medium-grain rice price. The consumer taste parameters are represented as though distributed uniformly from θL to θH, where θL is the lowest consumer taste parameter and θH is the highest consumer taste parameter. The aggregations of individual demands are ${D_m} = \left( {\varphi+ \left( {1 - \varphi} \right){{{{{p_l}} \over {{p_m}}} - {\theta _L}} \over {{\theta _H} - {\theta _L}}}} \right){\rm{exp}}\left[ {{\alpha _m} + \left( {\lambda \left( {1 - \varepsilon} \right) - 1} \right)\ln\left( {{p_m}} \right) + \left( {1 - \lambda } \right)\left( {1 - \varepsilon} \right)\ln\left( {{p_z}} \right)} \right],$ ${D_l} = \left( {1 - \varphi } \right)\left( {{{\theta _H^{1 - \lambda \left( {1 - \varepsilon } \right)} - {{{{{p_l}} \over {{p_m}}}}^{1 - \lambda \left( {1 - \varepsilon } \right)}}} \over {{\theta _H} - {\theta _L}}}} \right){\rm{exp}}\left[ {{\alpha _l} + \left( {\lambda \left( {1 - \varepsilon } \right) - 1} \right)\ln \left( {{p_l}} \right) + \left( {1 - \lambda } \right)\left( {1 - \varepsilon } \right)\ln \left( {{p_z}} \right)} \right].$
The relative prices determine the aggregate demands, apart from a share of medium-grain rice consumption that will never switch to long-grain rice. There are at least some quantities demanded for both types of rice depending on relative prices that are in the range between consumer taste parameters (i.e., ${\theta _L} \lt {{{p_l}} \over {{p_m}}} \lt {\theta _H})$
. If the relative price is greater than θH
, however, then no one buys the long-grain rice. In addition, we assume that there are holdout consumers who always buy the medium-grain rice no matter how cheap long-grain rice is relative to medium-grain rice. Taking a share of consumption as holdout consumers (ϕ ∈ (0,1]) into account, the aggregation demands are determined by ϕ.Footnote
2
${\theta _L} \lt {{{p_l}} \over {{p_m}}} \lt {\theta _H})$
. If the relative price is greater than θH
, however, then no one buys the long-grain rice. In addition, we assume that there are holdout consumers who always buy the medium-grain rice no matter how cheap long-grain rice is relative to medium-grain rice. Taking a share of consumption as holdout consumers (ϕ ∈ (0,1]) into account, the aggregation demands are determined by ϕ.Footnote
2
The supply side consists of the following equations for harvested area, expected gross return, yield, and total production: $H{A_t} = f\left( {H{A_{t - 1}},G{R_{t - 1}}} \right),$ $G{R_t} = f\left( {P_t^{ED},Y{D_t}} \right),$ $P_t^{ED} = {\rm{max}}\left\{ {P_t^{AV} + FD{P_t},P_t^{AV} + VD{P_t} + FD{P_t}} \right\},$ $VD{P_t} = 0.85 \times \left( {P_t^{Support} - P_t^{AV}} \right) - FD{P_t},$ $Y{D_t} = f\left( {trend} \right),$ $Q{P_t} = H{A_t} \times Y{D_t}$.
A common specification for the supply model is used (Beghin and Elobeid, Reference Beghin and Elobeid2015; Williams and Luo, Reference Williams and Luo2017). The harvested area (HAt
) is specified by a partial adjustment function of the previous harvested area (HAt
−1) and expected real gross return (GRt
−1). Expected gross return per unit of area (GRt
) is estimated by multiplying the expected producer returns per unit $\left( {P_t^{ED}} \right)$
times the trend yield (YDt
) (Adams et al., Reference Adams, Westhoff, Willott and Young2001). The expected producer returns per unit (
$\left( {P_t^{ED}} \right)$
times the trend yield (YDt
) (Adams et al., Reference Adams, Westhoff, Willott and Young2001). The expected producer returns per unit ( $P_t^{ED}$
) depend in part on the expected price, calculated as the 3-year moving average market price (
$P_t^{ED}$
) depend in part on the expected price, calculated as the 3-year moving average market price ( $P_t^{AV}$
). If the expected market price is greater than the support price (
$P_t^{AV}$
). If the expected market price is greater than the support price ( $P_t^{Support}$
), then the expected market price and fixed direct payment (FDPt
) determine the expected gross return. However, if the market price is below the policy trigger, then the Korean government also provides a variable direct payment (VDPt
) equal to 85% of a gap between the support price and the market price minus FDPt
(equation 11). Producers take this policy response into account when determining expected returns. We note that the support price has increased at certain intervals in the past. Nevertheless, the support price is held constant in the results presented in the text, although we test sensitivity of results to this assumption. We assume that there is no large change in policy or new effort to encourage rice farmers to switch to other crops. The annual yield is a function of trend, with potential price effects difficult to detect over the time frame of this model. Finally, the total production (QPt
) is the product of harvested area and the yield. Korea produces only medium-grain rice, and we assume that there is no fundamental change that results in significant quantities of domestic long-grain rice production.
$P_t^{Support}$
), then the expected market price and fixed direct payment (FDPt
) determine the expected gross return. However, if the market price is below the policy trigger, then the Korean government also provides a variable direct payment (VDPt
) equal to 85% of a gap between the support price and the market price minus FDPt
(equation 11). Producers take this policy response into account when determining expected returns. We note that the support price has increased at certain intervals in the past. Nevertheless, the support price is held constant in the results presented in the text, although we test sensitivity of results to this assumption. We assume that there is no large change in policy or new effort to encourage rice farmers to switch to other crops. The annual yield is a function of trend, with potential price effects difficult to detect over the time frame of this model. Finally, the total production (QPt
) is the product of harvested area and the yield. Korea produces only medium-grain rice, and we assume that there is no fundamental change that results in significant quantities of domestic long-grain rice production.
The model represents two relevant regimes: (a) imports at quota and price set domestically or (b) over-quota imports and price equal to the world price with the over-quota tariff. The expressions to represent these situations are as follows: At the quota, imports and the domestic price are determined by $I{M_t} = TR{Q_t}$, $I{M_t} + Q{P_t} + B{S_t} = Q{C_t} + E{X_t} + E{S_t}$.
Over-quota, these equations are $P_t^D = P_t^W \times X{R_t} \times \left( {1 + {\tau _{over,t}}} \right)$, $I{M_t} = Q{C_t} + E{X_t} + E{S_t} - Q{P_t} - B{S_t}$.
At the quota, the domestic price is determined by the sum of import (IMt ), production (QPt ), and beginning stock (BSt ), equal to the sum of consumption (QCt ), export (EXt ), and ending stock (ESt ) in equation (15). Import is equal to TRQ quantity in equation (14). At over-quota, the domestic price is determined by equation (16), and import is calculated by the total use minus production and beginning stock in equation (17). We rule out the possibility that import quantities are less than the MMA as being very unlikely in the context of the Korean rice market. A Fischer-Burmeister representation of a nonlinear complementarity problem (Fischer, Reference Fischer1992) is used in the applied model.
3.2. Stochastic approach
A stochastic approach is used to examine the implications of uncertainty. Westhoff, Brown, and Hart (Reference Westhoff, Brown and Hart2006) exploit a stochastic modeling method that randomly draws from distributions of selected exogenous variables to generate 500 outcomes for the endogenous variables using a structural economic model. Stochastic models have been used in various commodity markets (Chavez and Wailes, Reference Chavez and Wailes2011; Fadiga et al., Reference Fadiga, Mohanty, Welch and Pan2008; Thompson, Meyer, and Westhoff, Reference Thompson, Meyer and Westhoff2010; Westhoff and Gerlt, Reference Westhoff and Gerlt2013). These articles use structural economic models and random draws on a subset of the exogenous variables to introduce uncertainty, broadening the relevance of their analysis and showing how policies perform in a variety of contexts.
The stochastic simulation approach is used here to assess the possibility of Korean rice imports under various plausible market conditions. The Korean rice market can face uncertainty from either the domestic market or international market, or both. If we simulated the model with and without the TRQ changes under one possible set of market conditions, then we might not detect the potential that the TRQ would have an impact under different conditions. For example, a changed TRQ regime might still prevent imports under normal domestic and international market conditions, yet allow substantially greater imports than without the change if world prices happen to be low or domestic prices are high. The stochastic approach used here allows us to consider uncertainty regarding future yields, world rice prices, and exchange rates. If the yield is low, for example, then the supply curve can shift far to the left and the excess demand (ED) curve would shift right, possibly leading to over-quota imports (Figure 2). Uncertainty regarding world rice prices and exchange rates will affect the rice import price, potentially reducing the border price with the over-quota tariff enough to induce imports above the quota. The stochastic simulation method, as described subsequently, can examine the implications of the TRQ taking these important sources of uncertainty into account. We take 500 random draws from either the yield or border price uncertainty and simulate 500 possible market outcomes. The related equations and stochastic errors are discussed subsequently.
4. Data, estimation, and calibration
Annual data from 1998 to 2014 are obtained from MAFRA (2016) and U.S. Department of Agriculture, Foreign Agricultural Service (USDA-FAS, Reference Wailes and Chavez2018). We calibrate the model to the latest data (Table 1). The share of rice in grain consumption (λ) is assumed to be 0.6, based on the ratio of rice consumption to the sum of rice and wheat consumption (OECD, 2016). The own price elasticities of the demand and supply are −0.54 and 0.3. The overall grain demand elasticity is −0.23. Because the own price elasticity the model used consists of the overall grain demand elasticity and the share of rice [λ(1−ε)−1], the overall grain demand elasticity is calculated by the own price elasticity and the share of rice. The direct payment has been implemented since 2005, and we explicitly represent that regime change in the model, so estimated coefficients should relate to the period before or after this direct payment was introduced.
Table 1. Parameters and initial market conditions in the baseline

Sources: FAPRI-ISU (Food and Agricultural Policy Research Institute, Iowa State University, 2016), FAPRI-MU (Food and Agricultural Policy Research Institute, University of Missouri, 2016), MAFRA (Ministry of Agriculture, Food and Rural Affairs, 2016), OECD (Organization for Economic Cooperation and Development, 2016), and USDA-FAS (U.S. Department of Agriculture, Foreign Agricultural Service, 2018).
Willingness of consumers to switch among rice types is uncertain. Given the price effects of the tariff noted earlier, long-grain rice has not been available at steeply discounted prices in significant quantities. The consumer preference parameters are assumed to range from 0 to 0.5. This means that some consumers are willing to buy long-grain rice if the price of the long-grain rice is discounted by 50% below the medium-grain rice. Conversely, this choice means that nobody buys long-grain rice if the price is equal to or even 49% lower than the medium-grain rice price. The share of holdouts is 0.9, meaning that 90% of demand is assigned to medium-grain rice no matter how cheap the long-grain rice price is relative to the medium-grain rice price. These assumptions reflect a view that seems commonly held about Korean consumers—namely, that long-grain rice could be used in place of other rice in only a few instances. Long-grain rice consumption is greater than zero only if the price is half the price of medium-grain rice, and 10% of medium-grain use is replaced, at most, if the long-grain rice price is zero. Even so, we emphasize that one reviewer strongly objects to these assumptions and argues against allowing for 10% of medium-grain rice in Korea to switch to long-grain rice in the hypothetical extreme of free long-grain rice. However, evidence suggests that some degree of substitution is warranted (Choi, Dyck, and Childs, Reference Choi, Dyck and Childs2016; Kim et al., Reference Kim, Park, Jo and Son2015; Kim, Park, and Seung, Reference Kim, Park and Seung2014; Park, Cho, and Joo, Reference Park, Cho and Joo2006). These initial demand parameter assumptions are subject to sensitivity analysis.
Autoregressive models are used to estimate California medium-grain rice prices, Thailand long-grain rice prices, and Korean won–dollar exchange rates. Using an Akaike information criterion, the optimal lags are 1 year for the California milled rice price and exchange rate, and 2 years for the Thailand long-grain rice price (see the online supplementary appendix). We assume a normal distribution of errors. Error terms from autoregressive models are used to generate dynamic stochastic outcomes.
The wheat price is assumed to be determined by the world trade market because Korea relies on imports for most of the wheat consumption. In 2016–2017, the wheat imports are 4.5 million tons and domestic production is 360,000 tons (USDA-FAS, Reference Wailes and Chavez2018). The U.S. wheat price projected by the Food and Agricultural Policy Research Institute, University of Missouri (FAPRI-MU, 2016), is used as the world market price. Projected Korean wheat prices, taking into account stochastic exchange rates, vary in simulations of rice border price uncertainty but are deterministic when yield uncertainty is applied.
5. Results
5.1. Baseline results
Simulation results show that Korean over-quota rice imports are unlikely given the current policy and the assumptions underlying the baseline (Table 2). Even taking key sources of uncertainty and product differentiation that could favor imports of long-grain rice into account, as well as much cheaper than medium-grain rice, the possibility of Korean rice imports is low. Only total imports are shown to conserve space. Given the assumptions, long-grain rice imports are very small in all these cases, although sensitivity analysis later demonstrates assumptions that would lead to greater long-grain rice imports in some cases. Given this outcome from 500 simulations based on correlated draws on historical distributions of the yield, world rice prices, and the exchange rate, the model suggests that only a serious departure from historical patterns could cause imports to rise above the TRQ quantity.
Table 2. Impact of over-quota tariff rate reduction on import quantity and price

Source: Authors’ calculations.
The results imply that neither domestic yield uncertainty nor variations in border prices of rice are likely to cause over-quota imports, given historical distributions and the existing policy. Considering only Korean rice yield uncertainty, the possibility of importing rice in excess of the TRQ is low (online supplementary appendix). In the case of border price uncertainty, variations in world rice prices and the exchange rate certainly cause volatility in the prices of imported rice at the over-quota tariff rate, but the lower values of these prices never fall to a level relative to the domestic price that causes import expansion given the other assumptions of the baseline (online supplementary appendix).
Our results indicate that the projected price of imported medium-grain rice (California medium-grain rice) is lower than other price projections, including those of FAPRI-MU and Arkansas Global Rice Economics Program (AGREP). Projected imported long-grain rice (Thailand long-grain rice 100%) in the present study is higher than the price projected by AGREP and lower than projections by FAPRI-MU in 2017 and 2018. In later years, our projected imported long-grain rice is low relative to the alternative two projections (Table 3).
Table 3. Comparisons of projected world rice prices

Sources: FAPRI-MU (Food and Agricultural Policy Research Institute, University of Missouri, 2016) and AGREP (Arkansas Global Rice Economics Program; Wailes and Chavez, 2016).
5.2. Scenario results
Our scenarios are designed to reflect possible outcomes of hypothetical trade negotiations that require Korea to reduce barriers to rice imports. This is not a statement about probabilities or political reality, but instead information that might be relevant to negotiators or others who seek quantitative estimates of how trade policy changes affect the market, although other studies seem to focus on reductions in such barriers to trade (Abbott, Reference Abbott2002; Arita et al., Reference Arita, Beckman, Kuberka and Melton2014; Chen, Chang, and McCarl, Reference Chen, Chang and McCarl2011; Hranaiova and de Gorter, Reference Hranaiova and de Gorter2006). We test two separate sets of policy scenarios: (1) reduction of the over-quota tariff rate and (2) expansion in the TRQ quantity. The over-quota tariff rate scenarios assume reductions to 213% and 113%, respectively, to show the implications of reductions of 300% or 400% from the initial level of 513%. Smaller tariff reductions are not reported because they have little or no impact on rice imports. The TRQ quantity expansion scenarios are designed to generate similar additional imports to the quantities generated from the two over-quota tariff reduction scenarios.
The scenario results are based on the same assumptions used in generating the baseline results. All other exogenous data, including the stochastic draws of key variables, are reproduced from the baseline. Parameters of supply and demand, including the willingness of consumers to switch to the long-grain rice, are also unchanged from the base case, although later sensitivity analysis explores the importance of consumer preferences. The impacts of the tariff change in each scenario can be estimated by comparing the output of the scenario simulations to the output of the baseline simulations. For example, a scenario that projects falling domestic use over the projection period does not indicate that a tariff change caused domestic use to fall. Instead, we compare the scenario consumption to the baseline consumption and can conclude that the tariff reduction causes greater consumption if this difference is positive.
5.2.1. Scenario: over-quota tariff rate reduction
Reducing the over-quota tariff rate to either 213% or 113% can increase the possibility of importing rice. When the over-quota tariff rate is reduced from 513% to 213%, the average rice imports of all 500 stochastic simulations are only slightly larger than in the baseline but remain bound by the TRQ quantity in at least 90% of the simulations (Table 2). The results of reducing the over-quota tariff rate by 300% imply that the over-quota tariff rate of 213% is the threshold tariff rate at which over-quota rice imports increase. However, this is an average value from stochastic simulations; the exact threshold value of the tariff at which over-quota imports start depends on the border prices and domestic factors, like yield variations. When the over-quota tariff rate is reduced to 113%, the average imports over the 2016–2020 period of all stochastic simulations is about 270,000 metric tons greater than the baseline average. Given the prices and demand assumptions, the increase in imports is composed entirely of additional medium-grain rice, and the average import volume accounts for 10% of the domestic consumption. The 10th percentile import level in the stochastic simulation result shows that the TRQ constraint still applies under some conditions as the 113% over-quota tariff remains consequential. On the other hand, the 90th percentile import level demonstrates that imports can be well over three times the TRQ quantity despite the 113% over-quota tariff if market conditions run in the opposite direction.
The domestic rice prices are reduced as more rice is imported. At a 213% over-quota tariff, the domestic rice prices are slightly decreased because the policy change leads to a small amount of additional imports. When the over-quota tariff rate is reduced to 113%, the domestic rice prices are further reduced because of the 270,000 metric tons of additional average imports. The 10th percentile domestic rice prices in the stochastic simulation results show that the domestic rice prices can be much lower in this alternative policy scenario.
Decomposing the relative effects of yield and border price uncertainty suggests that both help to explain the potential for a lower over-quota tariff to lead to greater imports but do not contribute equally. In particular, border price uncertainty, estimated based on historical variations in world rice prices and exchange rate, has a greater potential to cause higher imports than yield uncertainty. However, yield variation does have an effect, and the combined impact with all examined sources of uncertainty consequently is associated with the greatest potential for trade and price impacts (see online supplementary appendix for more information). Of course, the study does not estimate all possible sources of uncertainty.
5.2.2. Scenario: tariff rate quota quantity expansion
In this scenario, the reduction of the over-quota tariff rate is replaced with an expansion of the TRQ quantity. The TRQ quantity is changed by an amount that is equal to the mean increase in rice imports caused as the over-quota tariff rate is reduced to 213% and 113%. These changes in average rice imports are 10,000 metric tons and 270,000 metric tons, respectively, over the 5-year period. In these scenarios, the over-quota tariff is maintained at the baseline level of 513%, so estimated market effects relative to the baseline can be attributed only to the change in the TRQ quantity. Table 4 shows only the case of an additional 270,000 metric tons because the case of an additional 10,000 metric tons has little impact.
Table 4. Comparing the impact of over-quota tariff reduction and tariff rate quota (TRQ) quantity expansion on the Korean rice price

Source: Authors’ calculations.
Expanding the TRQ quantity leads to the reduction of the average domestic rice prices. Because the TRQ quantity change is calibrated to have the same average impact on import volume as the earlier scenarios, the reduction in the average domestic rice price is approximately the same in these cases as in the corresponding over-quota tariff reduction simulations. The average domestic rice price hence is lower than in the baseline in either case.
Domestic rice price variability is decreased when the over-quota tariff rate is reduced or the TRQ quantity is increased, at least as measured by the standard deviation (Table 4). However, the variation of domestic rice prices in the case of the TRQ quantity expansion is different from the case of the over-quota tariff rate reduction even though the average domestic rice price and rice import changes are quite similar in both possible cases. In the first year of the simulations, the standard deviation of the domestic rice price is 136 won/kg in the over-quota reduction case, but the standard deviation is 120 won/kg in the TRQ quantity expansion case. These experiments show that expanding the TRQ quantity reduces the standard deviation of the domestic rice price more than reducing the over-quota tariff rate; however, both lead to a lower standard deviation in this rice price relative to the 146 won/kg standard deviation of the domestic rice price in the base case, without any change to either TRQ quantity or over-quota tariff. The simulations suggest that border price uncertainty contributes more than domestic yield variability to domestic price variation. However, if future domestic yield uncertainty is larger, or if we were to consider other domestic sources of uncertainty, such as area or demand shocks, then these results might be reversed.
5.3. Sensitivity analysis results
There are no long-grain rice imports under baseline demand assumptions—namely, that θH is 0.5 and ϕ is 0.9 (Figure 3a). These assumptions imply that at least a 50% price discount in the long-grain rice price relative to medium-grain rice price is required before any consumers are willing to buy long-grain rice and also that 90% of consumption will never shift from medium-grain rice. Even when the over-quota tariff rate is reduced, Korea imports additional medium-grain rice under these assumptions, not long-grain rice. When the holdout share is reduced below 90%, additional imports of medium-grain rice are slightly decreased, but there are no additional long-grain rice imports. Given the model parameters in this case, the required price discount for long-grain rice is still high and consumers might shift to consume substitute goods—namely, wheat—instead of long-grain rice.

Figure 3. The rice import impacts of reducing the over-quota tariff by changing θH and ϕ, 5-year averages. (a) θH = 0.5 with different ϕ. (b) θH =0.7 with different ϕ. (c) θH = 0.9 with different ϕ.
Choosing alternative consumer preference assumptions with 90% of the holdout share can change the possibility of importing long- and medium-grain rice, as seen when the long-grain rice price must be discounted by only 30% before consumers start to switch to this rice type (Figure 3b). Given this assumption, if the over-quota tariff rate is reduced to 113%, then long-grain rice imports are estimated to be approximately one-fourth as large as medium-grain rice imports. If the necessary price discount rate before rice type substitution starts is reduced further, to 10%, then long-grain rice imports are almost half of the medium-grain rice imports when the over-quota tariff is set at 113% (Figure 3c). In those cases where alternative assumptions about preferences and a reduction in the over-quota tariff lead to long-grain rice imports, medium-grain imports are at least slightly reduced relative to the results with the baseline preferences and similar tariff reductions.
Long-grain rice imports are greater if the assumption that the vast majority of consumption never substitutes away from medium-grain rice to long-grain rice (or holds out) is relaxed. When this holdout share is reduced from 90% to 80% and the price discount must be 30% before substitution starts, then long-grain rice imports are almost double the level of imports as compared with the outcome when the holdout share is 90% with 30% of the price discount. As long-grain rice imports increase in this experiment, medium-grain rice imports are decreased relative to the results with baseline demand assumptions and the same change in over-quota tariff. Moreover, in the extreme case that the price discount rate is 10% and the holdout share is reduced to 70% (Figure 3c), the size of long-grain rice imports is greater than medium-grain rice imports. Therefore, the sensitivity analysis results show that relaxing the price discount and the holdout assumptions result in more imports of long-grain rice.
Sensitivity analysis with respect to the support price suggests that trade policy impacts are not extremely sensitive to this assumption (Table E in the online supplementary appendix). The base case assumes a constant support price in nominal terms, but an alternative assumption could be constant support price in real terms. Moreover, this alternative might be consistent with the historical path of occasional increases. In any case, the results under the two alternatives explored here are similar. The higher support price can cause greater initial production. A key point is that the change in support price level does not cause a difference in how producers respond to market price changes. The support price tends to mitigate the impacts of falling internal prices on domestic production in either case, with only a portion of price decreases below the support price passed on to producers because of the partly offsetting increase in variable payments. Given similar producer response to price changes, the implications of changes in trade policy are similar.
We do not test sensitivity of results to other assumptions or possibilities. One example is the small country assumption. Although Korean rice imports represent a small share of world trade, as noted earlier, and most scenarios do not suggest that this share would rise substantially, scenarios with much greater imports would probably imply at least some increase in world rice prices. The rising world prices might moderate the import increases, at least if imports take place above the TRQ quantity at the over-quota tariff rate. The small country assumption and consequently exogenous world prices seem appropriate for the still-small import volumes in most results presented here, but extrapolations to larger policy or import changes should be preceded by further investigation on this point.
6. Conclusions
Implementation of the Korean rice TRQ in 2015 has raised questions about whether the policy change is likely to result in more rice imports. Analyzing the possibility that this policy change affects rice imports is consequently important and timely. Moreover, experiments are necessary to inform policy decisions and trade negotiations in the future that might hinge on how adjustments to this new TRQ affect rice trade. Therefore, this article explores the impact of the TRQ on the Korean domestic rice market and imports. We build the structural model to represent the Korean rice market in regard to the TRQ policy and product differentiation. In addition, a stochastic approach is used to examine the implications of uncertainty in the Korean rice market. We consider two policy scenarios: over-quota tariff rate reduction and TRQ quantity expansion.
Our results indicate that the possibility of importing rice in Korea under the new TRQ is very low. The 513% over-quota tariff rate might not allow the importation of rice beyond the TRQ quantity. Uncertainty about domestic yields and border prices does not increase the possibility of importing rice at the mean and even at the tail of distributions. Moreover, even if assumptions that favor medium-grain rice imports are relaxed, the possibility of importing rice is still very low at the 513% over-quota tariff rate. Two policy scenarios result in more rice imports.
Our model shows that rice imports increase if the over-quota rate is reduced to 213%, with an additional 10,000 metric tons annual average. If the over-quota rate is reduced to 113%, there could be 270,000 metric tons of additional rice imports. In particular, the possibility of importing medium- or long-grain rice depends on the degree of product differentiation. Sensitivity analysis shows how the assumptions of key parameters representing the consumer preference for rice affect the rice imports. Whereas the baseline assumes that Korean rice buyers are slow to substitute from medium-grain rice to long-grain rice, with a substantial share that never switches no matter the price, sensitivity analysis shows that relaxing these assumptions can lead to large volumes of long-grain rice imports. Even in this case, however, these additional imports only occur if the over-quota rate is reduced or there is some other policy change, not given the current TRQ regime.
The TRQ quantity is expanded in another policy scenario. The assumed TRQ quantity expansion is equal to the average increase in rice imports of the over-quota tariff reduction scenario. The TRQ quantity expansion can lead to the same rice imports and domestic rice prices that are consistent with the over-quota tariff rate reduction case, by construction, but stochastic model simulations show that domestic rice price variations differ. The standard deviation of the domestic rice price in the case of the over-quota reduction is larger than in the case of the TRQ quantity expansion, suggesting that TRQ quantity expansion leads to lower domestic price variation. Moreover, we can compare how certain sources of volatility affect the domestic price. In general, domestic yield variation contributes less to domestic rice price volatility, as measured by the standard deviation, than border price uncertainty. This pattern holds for the baseline with stated TRQ regime as well as both the policy scenarios that allow more imports.
This last observation suggests an area for additional research. Our stochastic results do not capture all possible sources of uncertainty. In particular, whereas border price uncertainty implicitly includes all variation in foreign demands and supplies, the simulations do not take into consideration Korean area, demand, and stock uncertainty. Including more domestic sources of market volatility might reverse the relative effects of the TRQ quantity expansion and the over-quota tariff reduction. In addition, product differentiation is uncertain because there have been no significant quantities of long-grain rice imported or consumed in Korea in the past. Thus, additional research about potential shocks to domestic demand or supply, as well as the very nature of long-grain rice demand, would improve scientific assessment of how the new TRQ or changes in the TRQ regime can affect trade.
This analysis focuses on the TRQ regime and takes into account policies that affect price transmission to producers. However, there are possible factors that could increase imports. For example, other policies are left unchanged, but a change in trade policy might be accompanied by other policy changes. Other rules governing imports could be adjusted. Our results relate to rice tariff changes with other Korean agricultural policies that create incentives that encourage farmers to switch from rice growing to other crops held exogenous in the model. Although further research is certainly warranted and could improve accuracy, our analysis provides a new focus on the TRQ and automatic responses in variable payments, taking into account the potential for some very limited consumer substitution among rice types in certain price ranges. Our results can help traders and policy makers understand that the recent policy change is unlikely to result in greater imports given current market conditions and at least a certain set of assumptions about demand and volatility. Moreover, even relaxing the TRQ regime parameters or expanding the scope for substitution to long-grain rice is unlikely to cause larger imports in these simulations unless the changes are fairly large.
Author ORCIDs
Byung Min Soon https://orcid.org/0000-0003-0571-9770
Acknowledgments
This material is based on work supported by the U.S. Department of Agriculture (USDA), Office of the Chief Economist, under Agreement #58-0111-18-024, and the USDA National Institute of Food and Agriculture, Hatch project number MO-HASS0024. Any opinion, findings, conclusions, or recommendations expressed in this publication are those of the authors and do not necessarily reflect the views of the USDA nor the University of Missouri.


 Open access