1. Introduction
Globally, about 700 million people live below the US$1.90/day poverty line, with many more balancing just above it (World Bank, 2015). This substantial part of the world population is particularly vulnerable to external shocks, including those caused by natural disasters, such as floods and droughts. Such disasters can reduce household income and destroy houses and productive capital. For example, after the 2004 floods in Bangladesh, poor households affected by the flood lost more than twice as much of their total income as non-poor households (Brouwer et al., Reference Brouwer, Akter, Brander and Haque2007). This illustrates the consistent finding that poor people are more vulnerable to disaster events (Carter et al., Reference Carter, Little, Mogues and Negatu2007). By vulnerability, we refer to the fact that poor people are more susceptible to flooding, e.g. by the fact that they lose a larger fraction of their wealth when they are affected by a natural hazard or have a higher probability of suffering mortality (see e.g. Jongman et al., Reference Jongman, Winsemius, Aerts, Coughlan de Perez, van Aalst, Kron and Ward2015), and have more difficulty coping with it. They have a lower capacity to deal with shocks than non-poor households, due to lower access to savings, borrowing, or social protection (Kundzewicz and Kaczmarek, Reference Kundzewicz and Kaczmarek2000; Masozera et al., Reference Masozera, Bailey and Kerchner2007; Highfield et al., Reference Highfield, Peacock and Van Zandt2014). By exposure we mean the location of people in flood-prone areas.
Natural disasters are a key factor for pushing vulnerable households into poverty and keeping households poor (Sen, Reference Sen2003; Krishna, Reference Krishna2006). Just as importantly, exposure to natural hazards may reduce incentives to invest and save, since the possibility of losing a home due to a flood, or livestock due to a drought, makes these investments less attractive (Elbers et al., Reference Elbers, Gunning and Kinsey2007; Cole et al., Reference Cole, Gine, Tobacman, Topalova, Townsend and Vickery2013). This vulnerability of poor people to natural disaster risk is particularly worrying in the context of climate change, which may change the frequency, intensity, and spatial distribution of floods and droughts (IPCC, Reference Field, Barros, Stocker, Qin, Dokken, Ebi, Mastrandrea, Mach, Plattner, Allen, Tignor and Midgley2012). Therefore, future climate change may represent a significant obstacle to eradicating poverty (Hallegatte et al., Reference Hallegatte, Bangalore, Bonzanigo, Fay, Kane, Narloch, Rozenberg, Treguer and Vogt-Schilb2016).
Several previous studies have investigated statistical relationships between national-level economic indicators and reported disaster losses on a global scale to find out if poor countries are more affected by natural hazards (Kahn, Reference Kahn2005; Toya and Skidmore, Reference Toya and Skidmore2007; Ferreira et al., Reference Ferreira, Hamilton and Vincent2011; Shepherd et al., Reference Shepherd, Mitchell, Lewis, Lenhardt, Jones, Scott and Muir-Wood2013; Jongman et al., Reference Jongman, Winsemius, Aerts, Coughlan de Perez, van Aalst, Kron and Ward2015). Whilst these studies have found statistical relationships between experienced flood impacts and average income, they have not investigated the spatial or socioeconomic distribution of the losses within countries. Recent advances in the global spatial modelling of floods (Pappenberger et al., Reference Pappenberger, Dutra, Wetterhall and Cloke2012; Hirabayashi et al., Reference Hirabayashi, Mahendran, Koirala, Konoshima, Yamazaki, Watanabe, Kim and Kanae2013; Wada et al., Reference Wada, van Beek, Wanders and Bierkens2013; Winsemius et al., Reference Winsemius, Van, Jongman, Ward and Bouwman2013, Reference Winsemius, Aerts, van Beek, Bierkens, Bouwman, Jongman, Kwadijk, Ligtvoet, Lucas, van Vuuren and Ward2015a) and droughts (Prudhomme et al., Reference Prudhomme, Giuntoli, Robinson, Clark, Arnell, Dankers, Fekete, Franssen, Gerten, Gosling, Hagemann, Hannah, Kim, Masaki, Satoh, Stacke, Wada and Wisser2014; Schewe et al., Reference Schewe, Heinke, Gerten, Haddeland, Arnell, Clark, Dankers, Eisner, Fekete, Colón-González, Gosling, Kim, Liu, Masaki, Portmann, Satoh, Stacke, Tang, Wada, Wisser, Albrecht, Frieler, Piontek, Warszawski and Kabat2014) have led to improved estimates of the global population exposed to natural hazards, but these assessments have not addressed different income groups.
To our knowledge, the relationship between poverty and exposure to floods and droughts has only been studied on a case-study basis for a few countries. A literature review of 13 of such studies, conducted in this paper, shows that poor people are often disproportionately overrepresented in hazard-prone areas. As shown in figure A2 (online appendix), only one of the 13 studies finds that non-poor people are more exposed than poor people. Although these cases highlight a possible relationship between poverty and exposure, evidence on the global representativeness of these case-study results and general figures on the exposure of poor people is lacking.
In this paper, we analyse global exposure of poor and non-poor people to river floods and droughts under current and future climates. To do this, we combine hazard maps from global river flood and hydrological drought models with detailed household wealth and income datasets for 52 countries. At this stage, we have not yet included coastal flooding, which would result in additional flood impacts. Poverty is defined here using the distribution of wealth amongst households within a given country. We explore whether there is a significant exposure bias for either poor or non-poor people to river floods and droughts and whether their exposure will increase in the future. As data limitations create certain constraints on the analysis, this study should be treated as a first-cut exploration.
2. Review
In this section, we review the complex relationship between poverty and exposure to natural hazards. The relationship between poverty and exposure may go in both directions. First, poor people may be more likely to settle in flood- and drought-prone areas. Second, households affected by floods and droughts have a higher risk of falling into poverty or being trapped in poverty. Both aspects are discussed below.
Localization choices across regions and cities are driven in the first place by socioeconomic considerations (housing prices, proximity to jobs, amenities) much more than by natural hazards (Hallegatte, Reference Hallegatte2012). Households may be willing to accept high levels of risk to get access to opportunities. For example, in Mumbai, households in flood areas report that they are aware of the flood risks, but accept them due to the opportunities offered by the area, such as access to jobs, schools and health care facilities (Patankar, Reference Patankar2016). Compounding this incentive for people to reside in flood zones and close to opportunities is the reality that transport is often unreliable, unsafe, or expensive (Dudwick et al., Reference Dudwick, Hull, Katayama, Shilpi and Simler2011; Gentilini, Reference Gentilini2015). In some rural areas, proximity to water offers cheaper transport opportunities and regular floods may increase agricultural productivity (Loayza et al., Reference Loayza, Olaberría, Rigolini and Christiaensen2012). People may also settle in risky areas to benefit from opportunities with industries driven by exports in coastal areas (Fleisher and Chen, Reference Fleisher and Chen1997). These opportunities attract all people –rich and poor –to places that are exposed to natural hazards.
However, at the city or neighbourhood level, where the opportunity factors are broadly similar but risk of floods may be different from neighbourhood to neighbourhood, poor people might be more exposed due to lower housing prices in flood zones (Bin and Landry, Reference Bin and Landry2013). A meta-analysis of 37 empirical studies, mostly in developed countries, found that prices between flood-exposed and non-flood-exposed houses varies widely, ranging between −7 per cent to +1 per cent (Beltran et al., Reference Beltran, Maddison and Elliott2015). Poorer people, with fewer financial resources to spend on housing and a lower willingness and ability to pay for safety, are more likely to live in at-risk areas. This factor is more likely to exist for floods than for droughts, due to the small-scale variability in flood hazard. For example, with floods, impacts can be very different in areas 100 meters apart.
Alternatively, causality may go from flood and drought exposure to poverty. Evidence shows that floods affect household livelihood and prospects, and increase local poverty levels, through the loss of income and assets (see e.g. Rodriguez-Oreggia et al., Reference Rodriguez-Oreggia, De La Fuente, De La Torre and Moreno2013 for an analysis in Mexico). Exposure to droughts has been found to increase poverty ex-post (Dercon, Reference Dercon2004; Carter et al., Reference Carter, Little, Mogues and Negatu2007). Furthermore, the impact of disaster risk on poverty occurs through both the visible ex-post channel (the losses when a disaster occurs), as well as the less obvious ex-ante channel: households exposed to weather risk have been shown to reduce investment in productive assets and to select low-risk, low-return activities (Elbers et al., Reference Elbers, Gunning and Kinsey2007; Cole et al., Reference Cole, Gine, Tobacman, Topalova, Townsend and Vickery2013). This link from natural hazard exposure to poverty may create a feedback loop, in which poor households have no choice but to settle in at-risk zones and therefore face increased challenges to escaping poverty.
3. Data and methods
We examine relationships between poverty and exposure to river floods and hydrological droughts by combining flood and drought hazard maps from a global hydrological model with household level poverty data for 52 countries. River floods are identified from larger rivers (in the order of 10,000 km2 upstream area and above) only, and hydrological droughts are defined as climatological anomalies in river flows. The household data are taken from household surveys from the Demographic and Health Surveys (DHS), which are carried out by ICF International and hosted by the United States Agency for International Development (USAID).
In brief, per country we first analyse the wealth of households in all areas, and then the wealth of households in areas prone to river floods and/or hydrological droughts, and examine the difference between them. We do this by checking for each individual household whether its geographical position is within a flood/drought prone area or not. Using a precise geographical location is important in particular for floods, as floods can be a very local phenomenon. In the following subsections we describe the data and methods used. More detailed information about data and methods can be found in a background paper by Winsemius et al. (Reference Winsemius, Jongman, Veldkamp, Hallegatte, Bangalore and Ward2015b). The overall workflow is shown in figure 1, for the example of Colombia.
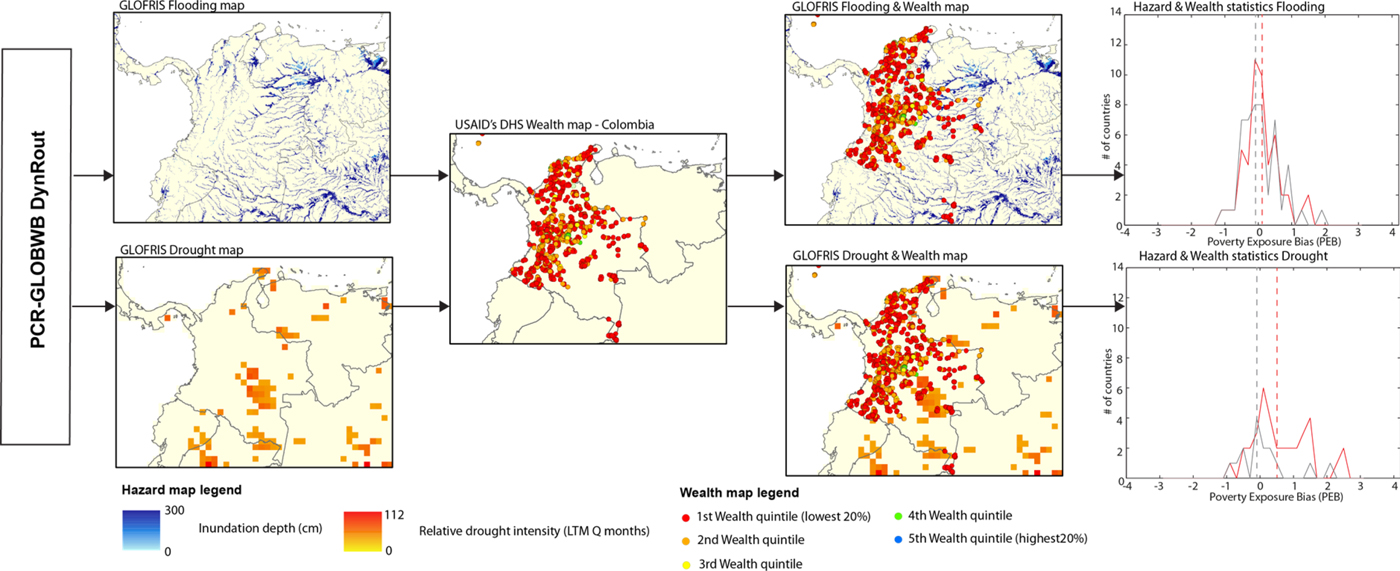
Figure 1. Flow-chart visualizing the modelling and analysis procedure for Colombia. The hazard maps show the distribution of flood and drought events as simulated using the global hydrological model PCR-GLOBWB under the EU-WATCH (1960–1999) scenario, with a return period of 100 years.
3.1 Deriving the flood and drought indicators
We use a global hydrological model, PCRGLOB-WB (Winsemius et al., Reference Winsemius, Van, Jongman, Ward and Bouwman2013) run with the EU-WATCH Forcing Data (Weedon et al., Reference Weedon, Gomes, Viterbo, Shuttleworth, Blyth, Österle, Adam, Bellouin, Boucher and Best2011) to derive maps showing indicators of flood and drought hazard. PCRGLOB-WB in brief estimates globally, at 0.5×0.5 degree resolution (about 50×50 km at the equator) on a daily basis over a given run time, how much rainfall runs off to rivers, and how this runoff accumulates in the river network and travels downstream. We use the WATCH Forcing Data, providing 0.5 degree gridded meteorological data needed to drive the model (precipitation, temperature and potential evaporation), to run this model over a 40-year period (1960–1999). From the resulting discharge and water depth time series at 0.5 degree resolution, we derive the hazard indicators for floods and droughts for several return periods (i.e., one divided by the average exceedance probability per year of a flood or drought event of a given magnitude, further described below). An event with associated return period should be interpreted as follows: an event with a very high return period (i.e., an event happening very infrequently) is more severe than an event with a low return period (i.e., a more frequently occurring event). Below we provide a brief description of the model cascade and derivation of flood and drought maps. We provide a more elaborate description in online appendix A. For simplicity, we focus on results for 10 and 100-year return periods.
3.1.1 Flood hazard
Flood hazard is represented by flood inundation depth maps at 30″ (arc seconds) ×30″ resolution (approx. 1 km × 1 km at the equator) from the GLOFRIS model cascade, which uses PCRGLOB-WB for its hydrological boundary conditions. In short, the water depths, associated with a given return period (see section 3.1) at 0.5 degree resolution, are downscaled to a much finer resolution using a much more granular elevation dataset. To define whether there is a flood hazard, we applied a threshold set at 0 m (i.e., any flooding occurring is hazardous). GLOFRIS is described in detail in Winsemius et al. (Reference Winsemius, Van, Jongman, Ward and Bouwman2013) and applied at the global scale in several studies (Ward et al., Reference Ward, Jongman, Weiland, Bouwman, van Beek, Bierkens, Ligtvoet and Winsemius2013; Jongman et al., Reference Jongman, Winsemius, Aerts, Coughlan de Perez, van Aalst, Kron and Ward2015; Winsemius et al., Reference Winsemius, Aerts, van Beek, Bierkens, Bouwman, Jongman, Kwadijk, Ligtvoet, Lucas, van Vuuren and Ward2015a). The method does not consider flood protection, as this is relatively low in developing countries. It also does not include coastal floods and flash floods. More details on the derivation of flood hazard maps from the runs with PCRGLOB-WB are provided in online appendix A2.
3.1.2 Drought hazard
We applied a variable monthly threshold method (namely the 80 per cent exceedance probability of discharge, Q 80) to estimate the yearly maximum cumulative discharge deficit, that is, the accumulated amount of discharge under the Q 80 threshold over a continuous period of time, per grid cell at 0.5° resolution as a measure of hydrological drought (Lehner and Döll, Reference Lehner, Döll, Lehner, Henrichs, Döll and Alcamo2001; Wada et al., Reference Wada, van Beek, Wanders and Bierkens2013; Wanders and Wada, Reference Wanders and Wada2015), using outputs from PCR-GLOBWB. Figure A3 in the online appendix shows the definition of droughts in a graphical form.
The resulting maps express the intensity of droughts relative to long-term mean discharge and can be interpreted as the amount of time a long-term mean discharge would be needed to overcome the maximum accumulated deficit volume occurring with a certain return period. We assumed that hazardous conditions occur when this value exceeds 3 months, and tested the robustness of our results using 1-month and 6-month thresholds. The indicator does not include information on groundwater availability or upstream water use. The resulting drought values should therefore be interpreted as conservative (underestimating drought hazard). Naturally, much more sophisticated drought indicators can be derived by accounting for season, rain-fed or irrigation based agriculture, locally specific demands, but these would all require much more local information and cannot easily be used at the global level.
3.1.3 Future flood and drought hazard
The model was also used to estimate future climate change impacts on flood and drought hazard, for different time periods (1960–1999, 2010–2049, 2030–2069, and 2060–2099), using meteorological outputs from five Global Climate Models (GCMs), forced by two representative concentration pathways (RCPs) (Van Vuuren et al., Reference Van Vuuren, Edmonds, Kainuma, Riahi, Thomson, Hibbard, Hurtt, Kram, Krey, Lamarque, Masui, Meinshausen, Nakicenovic, Smith and Rose2011), which represent scenarios of future concentrations of greenhouse gases (RCP 2.6 and 8.5, consistent with a 2 and 4°C increase, respectively). By ‘forced,’ we mean that the GCM outputs are generated by running the GCMs with the concentration of greenhouse gases in the atmosphere prescribed in the RCP scenarios. We have used RCP 2.6 and 8.5 so that we show two very contrasted developments in climate change. Note that climate change does not make floods and drought risks become more severe everywhere. In some regions, floods become less severe and frequent due to reduction in rainfall (shown e.g. by Hirabayashi et al., Reference Hirabayashi, Mahendran, Koirala, Konoshima, Yamazaki, Watanabe, Kim and Kanae2013; Winsemius et al., Reference Winsemius, Aerts, van Beek, Bierkens, Bouwman, Jongman, Kwadijk, Ligtvoet, Lucas, van Vuuren and Ward2015a); in others, increase in precipitation reduces drought severity. Since the GCMs used contain bias due to unrepresented intra-annual and inter-annual variability, we use the difference in annual exposed people between GCM-forced model runs in the future and the past to establish changes in exposure.
3.2 Poverty data sets
A comprehensive spatial database to examine the distribution of poverty within and across countries is not yet available at the required spatial resolution.Footnote 1 However, household surveys contain some spatial information to approximate the location of a household, which we employ in this analysis. Our main analysis is undertaken using the ‘wealth index’ (e.g. Barros et al., Reference Barros, Ronsmans, Axelson, Loaiza, Bertoldi, França, Bryce, Boerma and Victora2012; Fox, Reference Fox2012; Ward and Kaczan, Reference Ward and Kaczan2014) from the USAID's DHS surveys. This index is available across 52 countries that contain geo-referenced household-level data. These countries represent about 23 per cent of the world's population. There are typically 500–1,000 survey clusters for each survey, with each cluster containing approximately 25 households.
All households in each country are classified in five quintiles (with quintile 1 having the lowest wealth, and quintile 5 the highest). We furthermore classified urban and rural households into quintiles, which enabled us to investigate the exposure across urban and rural populations separately.
3.3 Analysing the relationships between poverty and floods/droughts
To investigate the global exposure of poor people to floods and droughts, we define a ‘poverty exposure bias’ (PEB) that measures the fraction of poor people exposed, compared to the fraction of all people exposed per country. When estimating the number of people exposed, we multiply the exposed households by their household size and use household weights to ensure the representativeness of our results at the national level. The household weight is a measure of the representativeness of the household related to all other households. We compute the PEB using:
 $$I_{{\rm p}} =\displaystyle{{f_{{\rm p}} }\over{f}}-1,$$
where I p is the PEB, f p and f are the fraction of people exposed to floods/droughts in the country (estimated by individually overlaying household location with our flood/drought maps, see section 3) in the poorest household quintile within a country and in the entire population, respectively. If I p is lower than zero, poor people are less exposed to floods/droughts than average. If I p is above zero, poor people are more exposed than average. Since the wealth index is comparable only within and not between countries, the PEB quantifies whether poor people are more or less exposed compared to the entire population within a specific country. Aggregation of all wealth index data for all countries and computation of a single global PEB is not possible with the data currently available. We tested our method for robustness regarding uncertainty in the geographical location and sample size using the methods described in online appendix A4, and robustness estimates are used in the description of our results.
4. Results and discussion
All results are summarized in table 1. Below we describe and analyse the distribution of the results for floods and droughts.
Table 1. Poverty exposure bias and increase in exposure for floods and droughts
Notes: For countries where none of the households within the DHS survey were exposed, not available (NA) is stated. Significant results appear in bold type.
4.1 Geographic distribution of the PEB under present-day climate
4.1.1 Floods
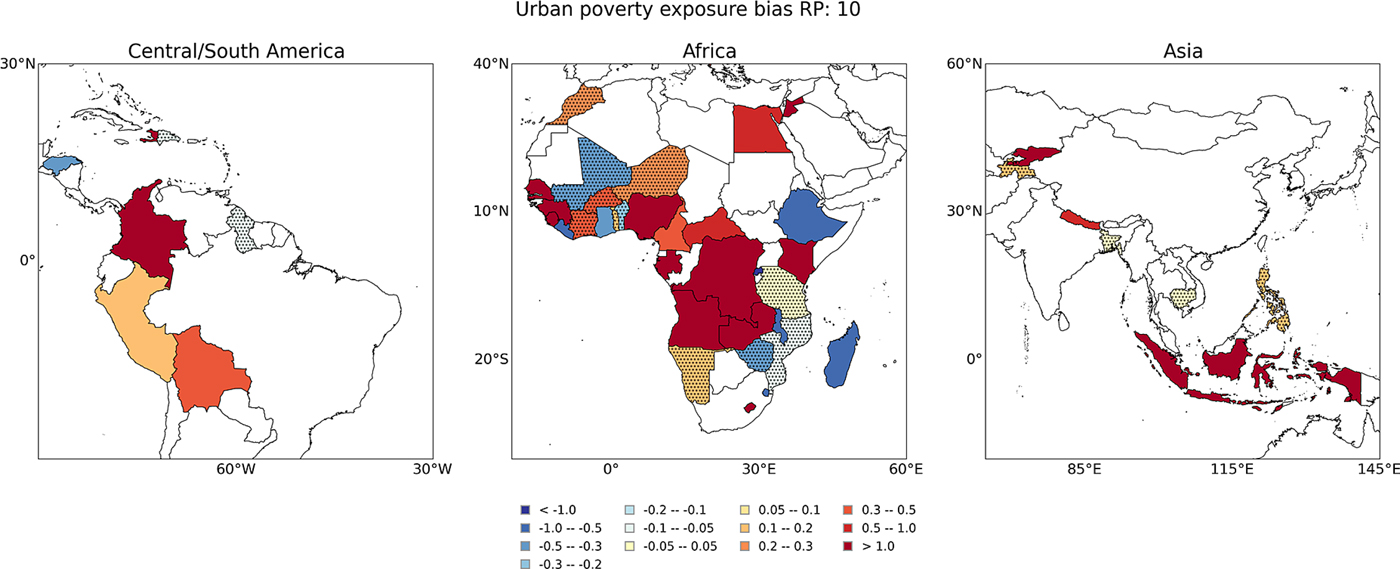
Figure 2 shows the PEB for floods with a return period of 10 years. The results for a higher return period of 100 years exhibit very similar patterns (not shown here). For floods at the national-level, under present-day climate conditions, 34 out of the 52 countries show a significant result when testing the exposure bias by means of bootstrapping. Of these 34, half (17) exhibit a disproportionally high exposure of poor people to floods. This result supports the general notion that the relationship between poverty and disaster exposure is impacted by multiple channels and is therefore complex. For instance, where non-poor are more affected by floods, this could mean that the regions investigated offer amenities to richer households, or that the areas are equipped with flood protection to facilitate households. Using country-level population data (World Bank, 2015), we find that these 17 countries include 60 per cent of the analysed population.
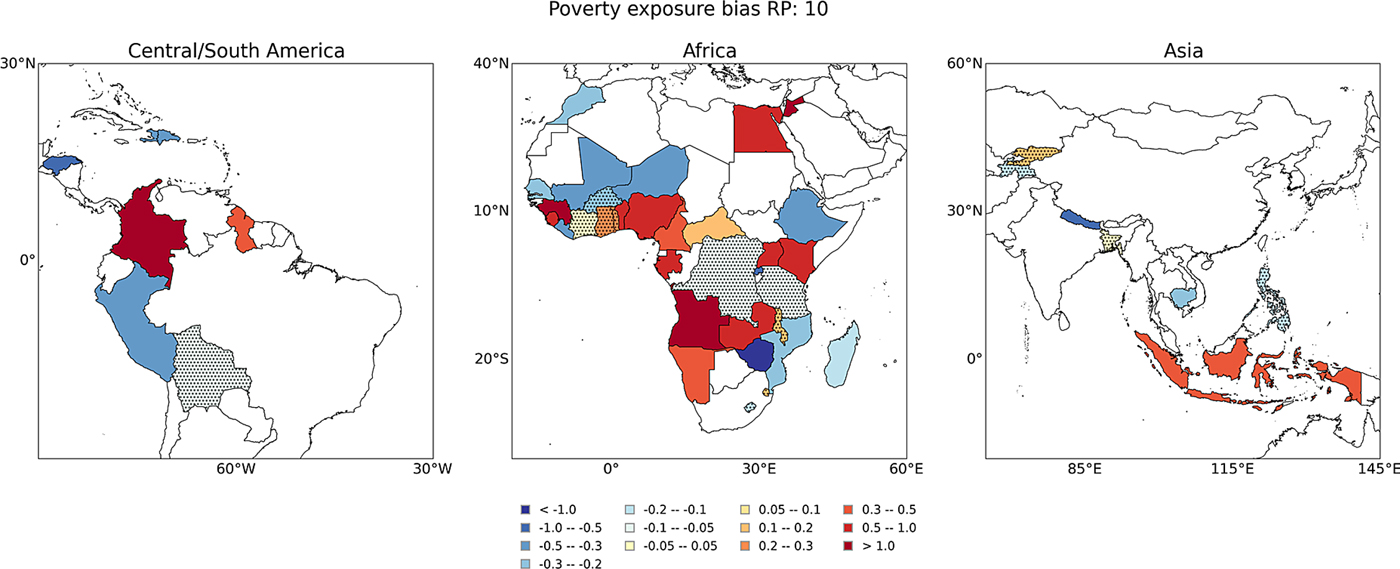
Figure 2. PEB for 10-year return period floods. White areas are not part of the 52 country sample. Areas are dotted when there is a lower than 95% confidence that the sign of the exposure bias is as estimated.
Moreover, regional patterns become visible. In particular, countries in Southern Africa, the Horn of Africa (except Ethiopia, Rwanda, Zimbabwe and Mozambique), and Egypt have a disproportionally high exposure of poor people to floods, although not all countries show significant results (Tanzania and Democratic Republic of Congo). In Western Africa, the results are mixed, although in countries with larger rivers and delta areas (notably Benin, Nigeria and Cameroon) there appears to be a tendency towards poor people being disproportionally exposed to floods. In Asia, poor people are disproportionally exposed (by a moderate but significant amount) in Indonesia; the same can be seen for Central and South America in Colombia and Guyana.
There are also several countries where poor people are less exposed to floods than average. These include some of the Asian countries in our sample (Cambodia, Nepal and Philippines, although the PEB for the last is insignificant), some West African countries, and most of the countries investigated in Central and South America.
The same analysis was performed using a quintile subdivision over only rural and urban households (that is, examining the PEB only within urban areas and only within rural areas). The results for urban households demonstrate a clear difference: in most countries poor urban households are clearly more exposed to floods than the average urban population (figure 3). Of the 30 countries with significant results, 22 exhibit a positive exposure bias (73 per cent in population terms). This suggests that the national poverty exposure bias may be largely driven by the wealth differences and hazard exposure differences between rural and urban households. There is no such strong signal for rural households, suggesting that different mechanisms may be at play in rural and urban settings. For instance, land scarcity may be more acute in urban areas (than in rural areas), creating a stronger incentive for poor people to settle in risky areas due to lower prices. We have also tested how spatially variable the overrepresentation of poor people can be, by performing an additional assessment on a much more local scale for Morocco and Malawi (see online appendix B). This suggests that very local differences in exposure may be experienced as well.

Figure 3. PEB for 10-year return period floods, for urban households only. Note that the quintile subdivision used is based on urban households only. White areas are not part of the 52 country sample. Areas are dotted when there is a lower than 95% confidence that the sign of the exposure bias is as estimated.
4.1.2 Droughts
Figure 4 shows country level PEB for droughts with a return period of 100 years. Again, the results for other return periods are similar, although the very low return period results yielded no exposed households in many countries. Of 30 countries with significant results, 24 exhibit a disproportionally high exposure of poor people (85 per cent in population terms). In all countries studied in Asia and in many countries in Southern and Western Africa, we find a clear signal that poor households are more exposed to droughts than average. For instance, Ghana, Togo, Benin, Nigeria and Cameroon in a row all show a signal of higher exposure to droughts of poor households compared to average. Other countries to the north and west show the opposite result, i.e., more exposure to droughts for non-poor households. In Central and South America, poor people appear less exposed in Bolivia and Peru, but more exposed in Colombia, Guyana and Honduras.
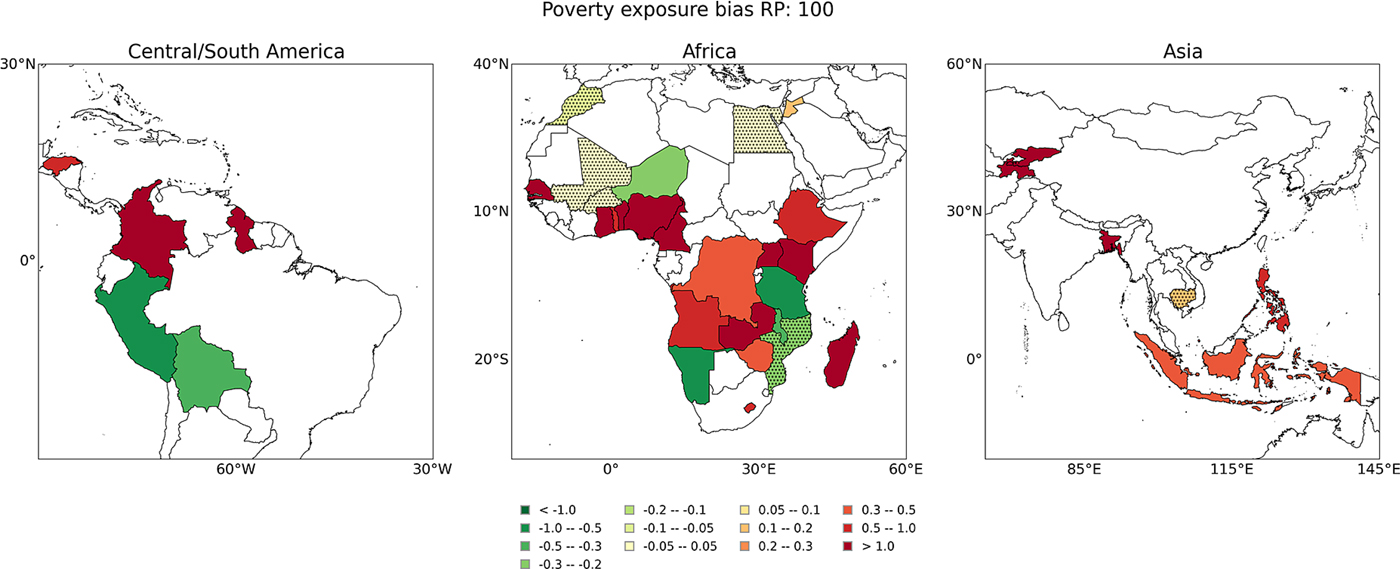
Figure 4. PEB for 100 year return period droughts. White areas are not part of the 52 country sample or have no exposure to droughts at all.
Many Sub-Saharan African countries show a positive PEB for droughts as well as floods. In many parts of Africa, many poor people are subsistence farmers, and therefore very dependent on reliable rainy seasons, which makes them more vulnerable to drought. A similar analysis for rural and urban households does not reveal significant differences with the country-scale analysis (see figures A4 and A5, online appendix). This may be due to the different scales of flood and drought hazards. Our flood indicator (and flood processes in general) has a higher spatial resolution (and variability) than drought.
4.2 The impact of climate change
Climate change is likely to increase the number of people exposed to floods and droughts. To estimate the range of increase in population exposure, we overlay future projected flood and drought hazard maps with present-day population density data.Footnote 2 We use a high-emissions pathway consistent with a 4°C increase in global temperatures, the Representative Concentration Pathway (RCP) 8.5. We run the analysis for five GCMs.Footnote 3 Across the GCMs, for droughts we find that the number of people exposed could increase by 9–17 per cent in 2030 and 50–90 per cent in 2080. For floods, the number of people exposed to floods could increase by 4–15 per cent in 2030 and 12–29 per cent in 2080.
To assess how poverty exposure may change in the future due to climate change, we calculate PEB for a low-emissions pathway RCP 2.6 (consistent with a 2°C increase) and high-emissions pathway RCP 8.5 (consistent with a 4°C increase) and for five GCMs. To ensure that we only see the impact of climate on exposure, we do not include compounding effects such as migration and population growth.
The PEB does not change significantly under the two different future climate scenarios and is therefore not displayed. Of course, hazard does not drive exposure and exposure bias alone. The expectation is that PEB will change in the future due to other driving mechanisms not assessed in this paper, such as migration, changes in the spatial distribution of poverty, or the general increase in income within countries. Countries with rapid urbanization may exhibit major changes in flood exposure patterns in the coming decades, independently of climate change and other changes in hazards.
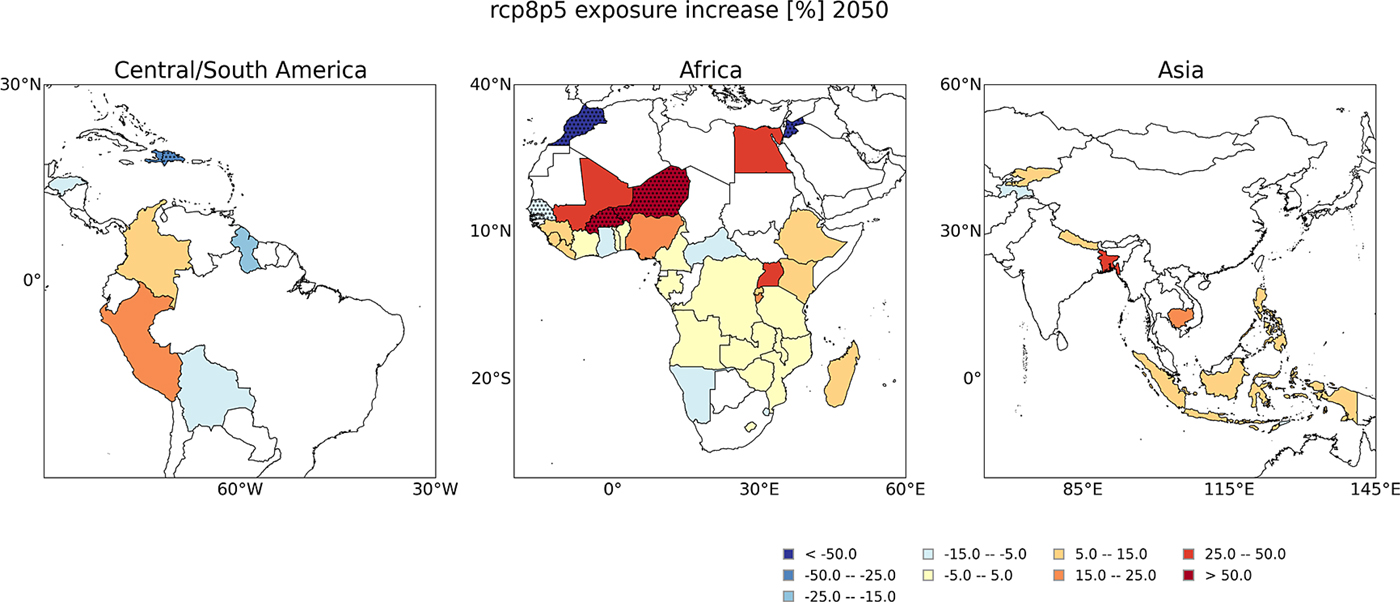
Regions where climate change causes an increase in the annual expected number of people exposed to floods and droughts, and where poor people are already more exposed than average (i.e. I p > 0), should be treated as highly climate-sensitive regions for poor people. To locate these, figure 5 shows the percentage change per country in the annual expected number of people exposed to floods between 1980 and 2050, based on the household data and RCP 8.5, and figure 6 shows the same for droughts (table 1 also reproduces results for all countries). RCP 2.6 shows similar changes in exposure, although it takes longer before these changes are reached. In some countries, the number of flood-exposed people under climate change rises rapidly; this is the case in the Horn of Africa, parts of West Africa, Egypt, Bangladesh, Colombia, and Bolivia. For droughts, the different GCMs show more disagreement in drought extremes, causing less significant results. However, if we use the GCM ensemble mean we see that West African countries in particular show an increase in the number of exposed people.

Figure 5. Percentage change in nationwide average annual number of flood-exposed people in our sample of 52 countries following RCP 8.5 from 1980 until 2050. The GCM ensemble average is shown. Countries where the GCM ensemble standard deviation is higher than 50% of the GCM mean are dotted.
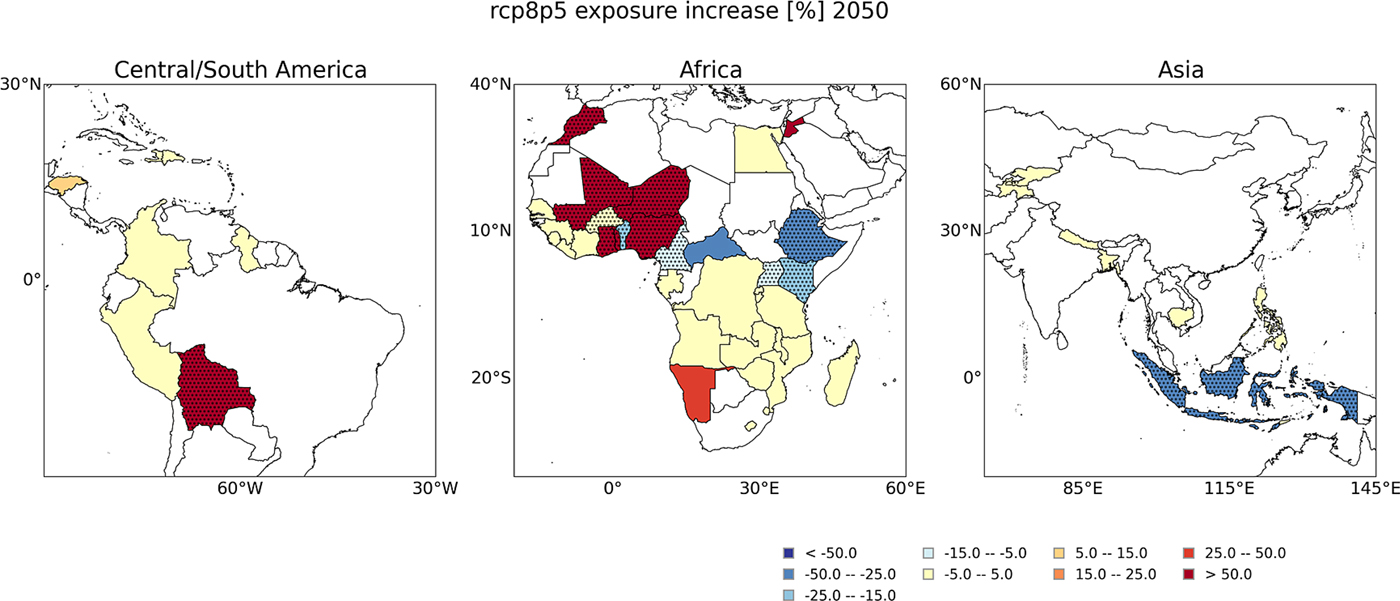
Figure 6. Percentage change in nationwide average annual number of drought-exposed people in our sample of 52 countries following RCP 8.5 from 1980 until 2050. The GCM ensemble average is shown. Countries where the GCM ensemble standard deviation is higher than 50% of the GCM mean are dotted.
Finally, we have determined countries where a combination of disproportionally exposed poor and exposure increase is observed. We have determined these as countries with a PEB larger than 10 per cent (i.e., poor people are disproportionally exposed) and an increase in the amount of total exposed people larger than 10 per cent. Under RCP 8.5, in 2050, the marked countries include Egypt, Guinea, Kenya, Nigeria, Sierra Leone, Uganda and Bangladesh. For droughts, only Nigeria, Ghana and Togo are facing this situation.Footnote 4 These are predominantly African countries, located above the equator. Here, climate change-induced flooding will likely hit poor people the hardest, although less than half of the countries have both an overexposure of poor people to floods and an expected increase in flood risks due to climate change.
5. Limitations and recommendations for further research
We found a high variability in results between countries; poor people are not over-exposed to natural hazards everywhere. However, the analysis is limited by data availability, as the DHS samples are too small to look at regions and within-country variability. The limited number of households per country has implications for the results for droughts in particular: in many countries, there is no overlap between zones with extreme drought conditions (e.g. a minimum of 3 months drought, at 100 year return period, yielded only 15 countries with significant results) and households, meaning that no estimate of the PEB for droughts could be made in these cases. A larger number of observations per country would therefore make the results of our analysis more robust.
A related limitation is the spatial scale of the analysis. DHS samples are rarely representative within sub-national regions, which limits our ability to examine the poverty exposure bias within specific regions of a country. Higher-resolution data (e.g. poverty maps within a city) would be able to better capture dynamics at the local level, where lower land prices may push poorer people into more risky areas. Furthermore, the DHS data are clustered with between 500–1000 clusters per country. This modest number of clusters means that some areas that are flood or drought prone may not be covered by the DHS data, limiting our ability to test robustness.
Ideally, we would compare our results across countries and not just within them. However, the wealth index calculated by DHS is country-specific, meaning that the same value for the wealth index across two different countries may imply a different level of wealth. While some authors have recently suggested that the DHS wealth index may be compared across countries (Rutstein and Staveteig, Reference Rutstein and Staveteig2014), country-to-country comparability remains difficult. This is one reason why we use relative thresholds (e.g. quintiles) rather than absolute ones. Another reason for the use of relative numbers is that, in case of an absolute poverty threshold in some countries, an overwhelming majority of the population would be classified as poor, hampering the envisaged analysis.
In this study, we have not investigated factors that influence the vulnerability of households to flooding, such as the building quality, or other determinants of flood impacts such as flood duration (Parker et al., Reference Parker, Green and Thompson1987; Dang et al., Reference Dang, Babel and Luong2010), and its impact on indirect losses such as loss in output and revenue and economic disruption (Lekuthai and Vongvisessomjai, Reference Lekuthai and Vongvisessomjai2001) and flood-related health issues; and flood level rise rate which is especially important in terms of mortality (Jonkman et al., Reference Jonkman, Maaskant, Boyd and Levitan2009). More research is required to examine how these could impact on poverty (for a review, see Hallegatte et al., Reference Hallegatte, Vogt-Schilb, Bangalore and Rozenberg2017).
Similarly, households that are highly vulnerable to droughts (e.g. with assets strongly relying on water) may experience problems even during a one-month drought condition, although others may only experience problems if the drought lasts three months or more. To assess the robustness of the drought indicator applied, we also tested our results using a one-month and six-month threshold (shown in Winsemius et al., Reference Winsemius, Jongman, Veldkamp, Hallegatte, Bangalore and Ward2015b). More people are exposed with a one-month threshold than with a six-month threshold. For the aggregated PEB results, we could only find a significant number of exposed households in six countries using a six-month drought threshold with a return period of 10 years. This increases to up to 50 countries when considering one-month droughts as a threshold with a 100 year return period. Notably, median PEB values are above zero for the 100 year return-period drought, and decrease toward and below zero for lower return-period (10 years) droughts and higher drought thresholds.
This suggests that the small sample sizes make it difficult to find a robust exposure bias pattern in many countries. Nonetheless, we found consistent results on the sign of the PEB for sub-Saharan Africa (Nigeria, Cameroon, Democratic Republic of Congo, Togo, and Benin (not significant for a one-month threshold)), Southeast Asia (Philippines, Indonesia (not significant for a six-month threshold)) and Colombia (when comparing the one, three and six-month threshold results under the 100-year return period). Other countries showed mixed results over the different threshold values and therefore results over these countries should be treated with lower confidence.
6. Conclusions
The general conclusion of this study is that, in a large number of the countries investigated, poor people are disproportionally exposed to droughts and urban floods. But the situation differs strongly between countries, within countries, and based on the type of hazard. However, there are geographical patterns: the countries where the strongest bias in exposure of poor is found are concentrated in Africa for both perils. Thirteen out of 23 countries in Africa with significant results show a positive PEB, most of which are found in the region under 10°N latitude. For droughts, we found significant results in only 30 out of 52 countries, due to the low amount of sample observations for our estimate of PEB. Nonetheless, of these 30 countries, 24 (representing 85 per cent of the population within the countries with significant results) show a positive PEB to droughts.
We find that in urban areas, poor people are disproportionally exposed to floods compared to average, while such a signal is not found for rural households. This is particularly noticeable in Africa, with the exception of several western African countries. In some countries, the absence of disproportionate exposure of poor at the national level may be due to the large gap in wealth between cities and rural areas, combined with the fact that flood hazard is often high in cities. The urban-rural gaps in income and flood risk may thus hide the fact that poor people are more exposed.
A particular concern is the fact that some of the countries where poor people are overexposed will also experience more frequent flooding or droughts in the future due to climate change. We see this in Burkina Faso, Burundi, Egypt, Ethiopia, Guinea, Kenya, Nigeria, Sierra Leone and Uganda for floods. For drought, Nigeria and Ghana were found to be in this situation, although results for Ghana were found to be less robust.
Exposure, the topic of this paper, is only one component of risk. Almost everywhere, the other risk components—from protection to vulnerability to the ability to cope and recover—are also biased against poor people (Hallegatte et al., Reference Hallegatte, Bangalore, Bonzanigo, Fay, Kane, Narloch, Rozenberg, Treguer and Vogt-Schilb2016), which means that even in places without a poverty bias, poor people may still experience higher risk. Protection levels and quality are lower in poor countries and lower in poor neighbourhoods and regions. Poor people live in low quality houses that suffer more damage in case of floods, and they have most if not all of their assets in material form, making them more vulnerable to floods. Finally, poor people have limited access to recovery support, such as social protection and credit.
A recent report (Hallegatte et al., Reference Hallegatte, Vogt-Schilb, Bangalore and Rozenberg2017) assessing the well-being impacts from natural disasters suggests that when including all these dimensions—exposure, vulnerability, and the ability-to-adapt—the impact of extreme weather on poverty is more devastating than previously understood, responsible for annual consumption losses of US$520 billion and for pushing 26 million people into poverty every year. The results from this paper on the distribution of the poverty exposure bias across countries were used as an input to the report's analysis, and are one example of an application of this paper's findings.
Disaster risk management and poverty reduction go hand in hand. In countries where poor people are disproportionally exposed to floods and droughts, it is particularly important to integrate risk management policies within poverty reduction strategies, to understand the underlying drivers of the exposure bias, and to correct it through better land-use regulation and other supporting policies. Critically, such policies should support the access of poor people to opportunities, and not stifle them. In locations where hazards will become more frequent or more intense, implementing risk-sensitive land-use policies that protect poor people, such as flood zoning and land entitlement, should be a priority.
Supplementary material
The supplementary material for this article can be found at https://doi.org/10.1017/S1355770X17000444.
Acknowledgements
We thank Adrien Vogt-Schilb and Anne Zimmer for their careful review of this paper, and Tom Pullum, Ruilin Ren, and Clara Burgert from ICF International for their very helpful guidance on using the DHS data. We are grateful for financial support from the Global Facility for Disaster Reduction and Recovery (and thank Alanna Simpson as being the main counterpart from GFDRR) and the World Bank, under the work program on ‘Poverty and Climate Change,’ led by the Office of the Chief Economist of the Climate Change Group. We also acknowledge support from Earth2Observe, EU FP7 project grant agreement no. 603608. Furthermore, P.J. Ward received additional financial support from a VIDI grant for the Netherlands Organisation for Scientific Research (NWO) (grant number 016.161.324).