


Impact Statement
There is increasing demand for energy, yet we must drastically cut emissions to mitigate climate change. This will require significant changes to energy systems and land use. In this work, we extend a web-based digital twin to combine a geospatial description of crop growth and data about biomass energy content and yield, with a description of the energy supply system in the UK. The design of the digital twin is universal—it can and will be extended to share other data for other sectors—and provides a tool to support data-driven decision making in complex environments. For example, how to best use land to provide resilient food and energy supplies, whilst supporting biodiversity and caring for the environment?
1. Introduction
The population of the world is projected to increase to 9.7 billion by 2050, rising to a peak of 11 billion in 2100 (United Nations, 2019). This will lead to land use change as more people migrate to cities in search of a better quality of life (United Nations, 2018). Moreover, it is predicted that there will be an increase in energy demand and therefore increased potential for greenhouse gas emissions (Weber and Sciubba, Reference Weber and Sciubba2019). Increasing population is known to cause stress on the environment, including resource depletion, biodiversity loss, and deforestation (National Academy of Sciences, National Academy of Engineering and Institute of Medicine, 1986).
The global average temperature has risen by over 1°C since 1880 (The Earth Observatory, 2020). In December 2015 in Paris, 197 countries pledged to aggressively curb their greenhouse gas emissions and work together to limit the increase in global temperature to 2°C by the end of the 21st century (United Nations, 2021). In 2019, the UK became the first major economy to pass a law to cut its emissions to net zero by the year 2050 (Great Britain, 2019). More recently, the UK Government has pledged to “build back greener” from the Covid-19 pandemic (Department for Environment, Food & Rural Affairs [United Kingdom] and The Rt Hon George Eustice MP, 2020), and to cut emissions by 78% by 2035 relative to 1990 levels (UK Government, 2021).
The increasing global demand for energy coupled with the drive of society to cut emissions presents a formidable problem because these two goals are at odds with one another. It is well understood that solving this dual challenge will involve the widespread deployment of renewable technologies including, solar photovoltaics, wind turbines, and bioenergy (Climate Change Committee, 2019). The deployment of these technologies has significant implications for land use and cannot be considered in isolation from the impact on food production and biodiversity (MacKay, Reference MacKay2009; Berners-Lee, Reference Berners-Lee2019).
Over the last decade the cost of solar photovoltaic systems has fallen by more than 74%, owing primarily to government policies supporting research and development (International Renewable Energy Agency [IRENA], 2019). At present, the efficiency of single-junction solar cells in converting solar radiation to electricity is confirmed to be as high as 29.1% (Green et al., Reference Green, Dunlop, Hohl-Ebinger, Yoshita, Kopidakis and Ho-Baillie2020). Recent advances in the fabrication of multijunction photocells has led to efficiencies as high as 39.2% being observed (Green et al., Reference Green, Dunlop, Hohl-Ebinger, Yoshita, Kopidakis and Ho-Baillie2020). With sustained research into novel materials and fabrication methods, the efficiency associated with solar photovoltaic systems is projected to increase further (Nayak et al., Reference Nayak, Mahesh, Snaith and Cahen2019). Despite the significant cost reductions and efficiency increases, solar photovoltaics only generated 4% of the UK’s electricity in 2019 (Department for Business, Energy & Industrial Strategy [United Kingdom], 2020b). Like many renewables (Brouwer et al., Reference Brouwer, van den Broek, Seebregts and Faaij2014), solar photovoltaics suffer from intermittency and rarely operate at full capacity (Statista, 2021a). This means that solar photovoltaic electricity generation is variable such that solar photovoltaic systems on their own are not suitable to provide baseload electricity requirements.
The UK is regarded to have the best wind resources in Europe (Department of Energy & Climate Change, 2011). In 2019, wind power was responsible for generating almost 20% of the UK’s electricity, with approximately equal contributions from onshore and offshore wind (Department for Business, Energy & Industrial Strategy [United Kingdom], 2020b). Costs associated with onshore and offshore wind have fallen by 40 and 29%, respectively over the last decade (International Renewable Energy Agency [IRENA], 2020). These cost reductions have resulted in onshore wind becoming the most cost-effective technology amongst all electricity generation methods in the UK (Renewable UK, 2018). However, until recently, the growth of onshore wind power has been stifled by restrictions on new projects (BBC, 2020). This resistance to onshore developments coupled with the favorable wind conditions at sea has led to the UK becoming the world leader in offshore wind capacity (Statista, 2021b). Dogger Bank Wind Farm (Dogger Bank Wind Farm, 2021) is being developed in the North Sea by ENI (2021), Equinor (2021), and SSE Renewables (2021). On completion, it will be the largest offshore wind farm in the world, capable of producing 3.6 GWe.
The use of biomass to generate electricity is proposed by the Committee on Climate Change as being crucial in helping the UK to achieve net zero (Climate Change Committee, 2019). In fact, the use of biomass to generate electricity is one of the few renewable energy sources which could be used to supply the UK’s baseload electricity requirements (Matek and Gawell, Reference Matek and Gawell2015). Biomass generated 11.5% of the UK’s electricity in 2019 (Department for Business, Energy & Industrial Strategy [United Kingdom], 2020b). The largest single user of biomass in the UK is Drax power station (Drax, 2021; Independent, 2021), which has an installed capacity of 2.6 GWe for biomass and 1.3 GWe for coal (Department for Business, Energy & Industrial Strategy [United Kingdom], 2020a) and which supplies 5% of the UK’s electricity (Drax, 2020). The coupling of Bioenergy with Carbon Capture and Storage, known as BECCS, is a net negative technology that results in the removal of carbon dioxide from the atmosphere. The retrofitting of Carbon Capture and Storage (CCS) technologies on bioenergy plants comes at a cost, reducing the plant efficiency between 6 and 15% (Bhave et al., Reference Bhave, Taylor, Fennell, Livingston, Shah, Dowell, Dennis, Kraft, Pourkashanian, Insa, Jones, Burdett, Bauen, Beal, Smallbone and Akroyd2017) as energy is required to capture the carbon dioxide. The Climate Change Committee (2021) recommended that UK Government policies support the deployment of BECCS technologies to help realize their climate goals (Climate Change Committee, 2018). However, bioenergy is not a universal solution and is not without its controversies. One common example is the “Food versus Fuel” debate relating to the diversion of land used for the cultivation of food crops to bioenergy crops (Tenenbaum, Reference Tenenbaum2008). Photosynthesis in plants has a maximum efficiency of 2% (MacKay, Reference MacKay2009). Consequently, large areas of land are required to grow biomass to generate sufficient electricity and this can lead to a loss in biodiversity (Immerzeel et al., Reference Immerzeel, Verweij, Hilst and Faaij2014).
Care must be taken when committing land to deploy these technologies to ensure that they complement one another and contribute to solving the problem holistically. This is a complex challenge and the ability to explore and assess different options can be aided through digitalization (Inderwildi et al., Reference Inderwildi, Zhang, Wang and Kraft2020). Dynamic knowledge graph technology developed as part of the World Avatar project (Eibeck et al., Reference Eibeck, Lim and Kraft2019; The World Avatar, 2021a) has been shown to provide an architecture that is suitable for implementing a Universal Digital Twin that can support the analysis of choices involving complex systems that is inherent to this type of challenge (Akroyd et al., Reference Akroyd, Mosbach, Bhave and Kraft2021; CMCL Innovations, 2021). In this approach, autonomous computational agents interact to perform tasks including updating the knowledge graph to ensure that it remains current in time, simulating the behavior of systems and sending responses back to the physical world. It has been shown how this architecture can be used to implement digital twins that provide information about the state of the world, provide intelligent control using computational agents to model the behavior of complex systems and provide support for intelligent design via what-if scenario analysis (Eibeck et al., Reference Eibeck, Chadzynski, Lim, Aditya, Ong, Devanand, Karmakar, Mosbach, Lau, Karimi, Foo and Kraftand2020; Akroyd et al., Reference Akroyd, Mosbach, Bhave and Kraft2021). The World Avatar approach employs Semantic Web technologies (Berners-Lee et al., Reference Berners-Lee, Hendler and Lassila2001; W3C, 2015) to provide a uniform method to query and host distributed data. The data are represented using ontologies and are stored as Linked Data (Berners-Lee, Reference Berners-Lee2006; Bizer et al., Reference Bizer, Heath, Berners-Lee and Sheth2011) so that it is possible to understand the context of the data (i.e., ask what it is) and find related data by traversing the knowledge graph. The computational agents can also be described in the knowledge graph, enabling the possibility to search for agents and understand their functionality. These capabilities enable the cross-domain sharing and reuse of interoperable models and data. The expressivity of ontologies means that the approach is readily extensible to other data and other domains. However, it still remains necessary to develop the ontologies in order to populate the digital twin.
The purpose of this article is to create an ontological description of land use, and to apply the ontologies to provide a geospatial description of the land use in England as part of a knowledge-graph-based Universal Digital Twin. The article is structured as follows. Section 2 provides an overview of the relevant technologies and surveys ontologies and data sets relating to land use. Section 3 describes the development of ontologies to represent land use within a knowledge graph. Section 4 presents two cross-domain use cases that demonstrate the potential of the Universal Digital Twin to integrate data across sectors. The first use case combines data about land use in the digital twin with a geospatial analysis of scenarios for energy provision. The second illustrates how the Universal Digital Twin could use the land use data as part of a cross-domain analysis of flood risk. Conclusions are drawn in Section 5.
2. Background
2.1. The World Avatar
The World Avatar project aims to create a dynamic world model that is generic and all-encompassing, with a focus so far geared toward the decarbonization of energy and the process industries (Pan et al., Reference Pan, Sikorski, Kastner, Akroyd, Mosbach, Lau and Kraft2015, Reference Pan, Sikorski, Akroyd, Mosbach, Lau and Kraft2016; Kleinelanghorst et al., Reference Kleinelanghorst, Zhou, Sikorski, Foo, Aditya, Mosbach, Karimi, Lau and Kraft2017; Zhang et al., Reference Zhang, Romagnoli, Zhou and Kraft2017; Devanand et al., Reference Devanand, Karmakar, Krdzavac, Rigo-Mariani, Foo, Karimi and Kraft2020, Reference Devanand, Karmakar, Farazi, Krdzavac, Lim, Foo, Karimi and Kraft2021; Atherton et al., Reference Atherton, Xie, Aditya, Zhou, Karmakar, Akroyd, Mosbach, Lim and Kraft2021), city planning (Chadzynski et al., Reference Chadzynski, Krdzavac, Farazi, Lim, Li, Grisiute, Herthogs, von Richthofen, Cairns and Kraft2021; von Richthofen et al., Reference von Richthofen, Herthogs, Kraft and Cairns2021), and chemistry (Krdzavac et al., Reference Krdzavac, Mosbach, Nurkowski, Buerger, Akroyd, Martin, Menon and Kraft2019; Farazi et al., Reference Farazi, Akroyd, Mosbach, Buerger, Nurkowski, Salamanca and Kraft2020a; Mosbach et al., Reference Mosbach, Menon, Farazi, Krdzavac, Zhou, Akroyd and Kraft2020; Zhou et al., Reference Zhou, Nurkowski, Mosbach, Akroyd and Kraft2021).
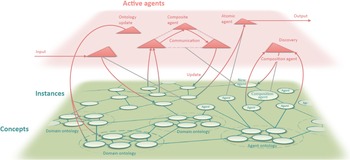
The world model is implemented as a dynamic knowledge graph that is built using Semantic Web technologies. The dynamic knowledge graph combines an ontological description of the concepts and instances (i.e., data) that are known to the world model with automated computational agents that operate on the knowledge graph. The computational agents are described as part of the knowledge graph and can perform actions on both concepts and instances. The design concept is illustrated in Figure 1.
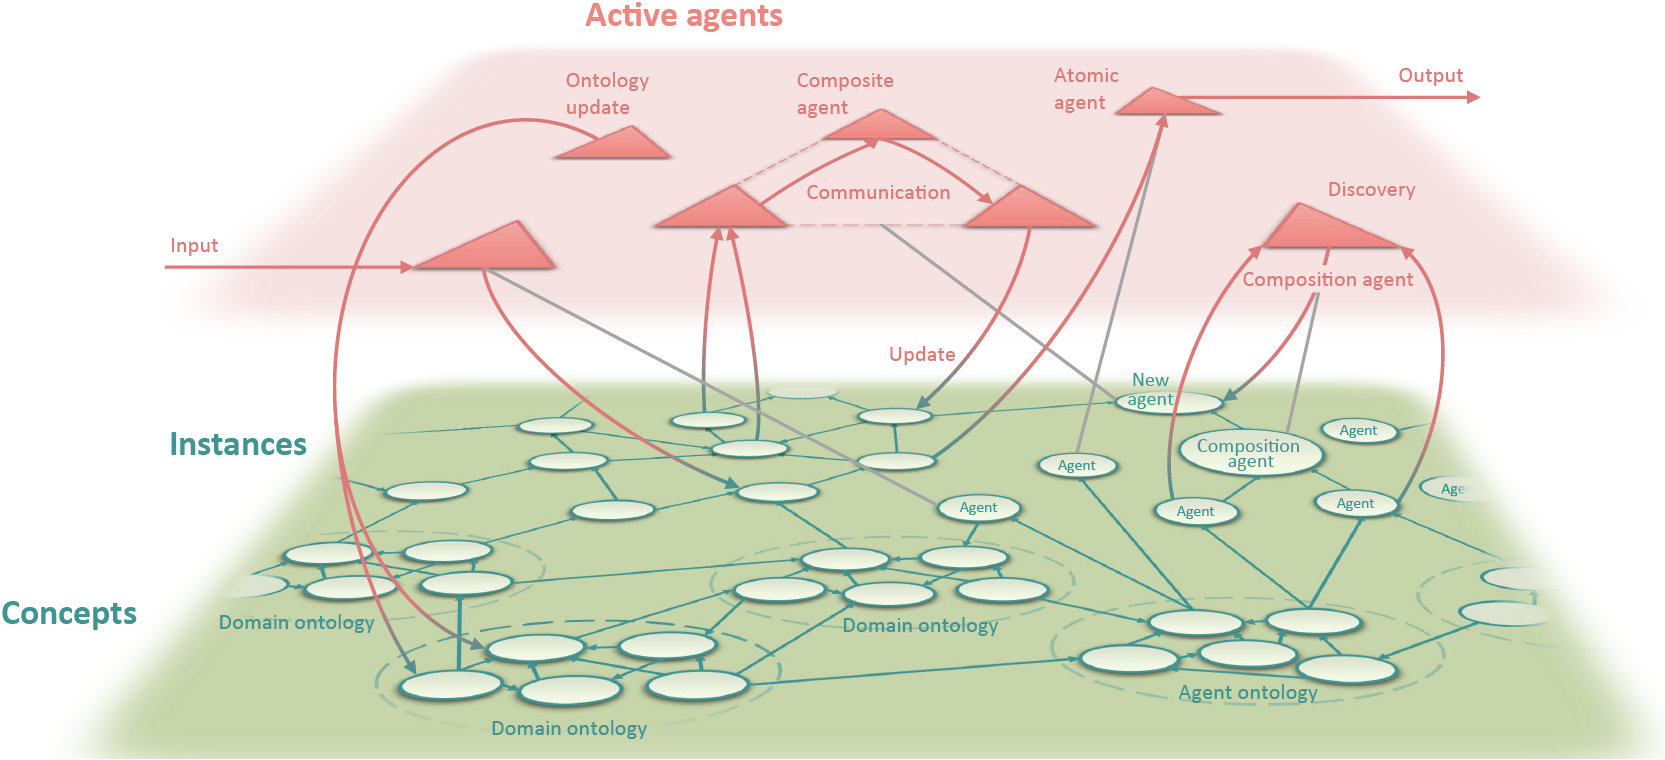
Figure 1. The design of the World Avatar dynamic knowledge graph. Image reproduced from Akroyd et al. (Reference Akroyd, Mosbach, Bhave and Kraft2021) under a CC BY 4.0 license.
The design of the World Avatar is intended to confer versatility by allowing the agents acting on the knowledge graph to perform a number of different types of task, including:
-
• Implementing data pipelines to ensure that the knowledge graph remains current in time, for example updating instances in the knowledge graph with data feeds from sensors or smart infrastructure.
-
• Sending signals back to the real world, for example to control an actuator.
-
• Providing an interface to computational models to calculate quantities, for example estimates of air quality (Farazi et al., Reference Farazi, Salamanca, Mosbach, Akroyd, Eibeck, Aditya, Chadzynski, Pan, Zhou, Zhang, Lim and Kraft2020c), and updating the instances in the knowledge graph.
-
• Restructuring the knowledge graph by adding instances, for example to explore the consequences of design choices (Devanand et al., Reference Devanand, Kraft and Karimi2019; Eibeck et al., Reference Eibeck, Chadzynski, Lim, Aditya, Ong, Devanand, Karmakar, Mosbach, Lau, Karimi, Foo and Kraftand2020), or by adding concepts and relationships between concepts and instances, for example using ontology matching to improve the coverage of the knowledge graph.
-
• Discover and compose new agents simply by reading from and writing to the knowledge graph so as to combine existing agents to form composite agents to perform more complex tasks (Zhou et al., Reference Zhou, Eibeck, Lim, Krdzavac and Kraft2019).
The Semantic Web technologies that are fundamental to the World Avatar are summarized below. The application of these technologies to facilitate creating a Universal Digital Twin, as part of the World Avatar project, is also discussed.
2.1.1. Ontologies
Ontologies are fundamental to the Semantic Web. An ontology, in this context, is a semantic model created using classes (also known as concepts), object properties, and data properties to represent information about a domain of interest. Object properties link an instance of a class (the domain of the property) to an instance of a class (the range of the property); data properties link an instance of a class (the domain of the property) to a data element (the range of the property).
The classes in an ontology may be arranged to form a hierarchy, where concepts belonging to a class can be specified as subclasses of a common parent class. Similarly, object properties and data properties may form a hierarchy of properties and subproperties. An example could be “CoalPowerStation,” “GasFiredPowerStation,” and “BiomassPowerStation,” which could all be considered as subclasses of “PowerStation.” The properties of the parent class will also apply to all subclasses.
When discussing ontologies, it is common to refer to a Terminological Component (TBox) and an Assertion Component (ABox). The TBox specifies the classes, object and data properties that can exist in the ontology. The ABox defines instances of classes, relationships with other instances (through object properties) and data associated with instances (through data properties). In the above example of power plants, the TBox would define the existence of concepts and the associated properties for different types of power plant, whereas the ABox would define the instances of the power plants, for example all of the power plants in the UK.
A number of formats exist to represent ontologies including the Resource Description Framework (RDF) (Allemang and Hendler, Reference Allemang and Hendler2011), Turtle (W3C, 2014), and Web Ontology Language (OWL) (W3C, 2012). OWL was developed to enable the representation of ontologies with complex logical formulae to meet the data publishing requirements of different domains (Bechhofer et al., Reference Bechhofer, Harmelen, Hendler, Horrocks, McGuinness, Patel-Schneijder and Stein2004). It is possible to verify the consistency of an ontology represented in OWL (or other formats) and infer indirect subclass-of relations using reasoners like HermiT (Data & Knowledge Group, 2019). The interested reader is referred to Allemang and Hendler (Reference Allemang and Hendler2011) for more detail.
2.1.2. Linked Data and knowledge graphs
Linked Data (Berners-Lee, Reference Berners-Lee2006) refers to the idea of linking Semantic Web data. Linked Data uses the logical and semantic capability of RDF to represent instances, classes, and links. The links take the form of internationalized resource identifiers (IRIs) and play a pivotal role in enabling the discovery of Linked Data.
Knowledge graphs express Linked Data as a directed graph, where the nodes of the graph are the concepts and instances, and the edges of the graph are the links between related concepts and instances. Typically, the number instances would far exceed the number of concepts. The ontological basis of knowledge graphs is such that reasoners, for example HermiT (Data & Knowledge Group, 2019), can be used to infer insights from existing facts. Linked Data and knowledge graphs offer a useful approach to storing information because they can be navigated to find related data and can be created with an open license to provide a collective, readily accessible knowledge base.
2.1.3. Data storage, queries, and updates
RDF data (and therefore knowledge graphs) can be hosted in graph databases, often referred to as RDF stores or triple stores, that store RDF statements in “subject,” “predicate,” and “object” columns (in fact, many triple stores are actually quad stores and store an additional “context” column that can be used to provide additional information about a statement). The data hosted in a store can be queried and updated via endpoints identified by IRIs. Operations can be executed over multiple endpoints by employing federated queries. SPARQL updates and queries can be carried out for individual triple stores through their own Application Programming Interfaces (APIs).
SPARQL Protocol and RDF Query Language (SPARQL) (W3C, 2013a) is a query language designed to query semantic information, for example querying instances of an ontological class, querying instances that are connected via links of interest or querying data linked to an instance. SPARQL Update (W3C, 2013b) is an update language designed to insert and delete statements from a triple store. It allows statements to be added to a triple store, or copied or moved from one triple store to another. Though SPARQL query and update operations can be performed on individual triple stores through their own APIs, the Jena-JDBC API (Jena-JDBC, 2011) provides a scalable high-performance triple-store-agnostic means to perform SPARQL queries and updates.
2.1.4. Geospatial data
Several standards for the RDF encoding of geospatial data have been published, including the GeoSPARQL Open Geospatial Consortium (2012) standards developed by the Open Geospatial Consortium (OGC) and guidelines from the Infrastructure for Spatial Information in Europe (INSPIRE) (ARE3NA, 2017). Ontologies that provide definitions for Geography Markup Language (GML) (Open Geospatial Consortium, 2021) properties and objects also exist, for example the Ontology for Geography Markup Language (GML3.0) (Durante, Reference Durante2017).
GeoSPARQL extends the SPARQL query language to support the querying of and reasoning about geospatial information. However, the GeoSPARQL support offered by different triple stores remains limited and inconsistent (Chadzynski et al., Reference Chadzynski, Krdzavac, Farazi, Lim, Li, Grisiute, Herthogs, von Richthofen, Cairns and Kraft2021; Jovanovik et al., Reference Jovanovik, Homburg and Spasić2021), for example RDF4J (Eclipse Foundation, 2021a) offers “partial GeoSPARQL support” (Eclipse Foundation, 2021b) whilst Blazegraph (2021), which is used in this work, does not support GeoSPARQL, but offers simple geospatial reasoning via a custom interface.
2.1.5. A Universal Digital Twin
The World Avatar uses a dynamic knowledge graph to instantiate semantic models of the domains of interest and of computational agents. By doing so, it aims to link information to create knowledge repositories on the World Wide Web through the standards laid out by the World Wide Web Consortium (W3C), resulting in a delocalized system of organized knowledge that is machine-readable and where entities are identified by unique IRIs (W3C, 2008). Unlike typical databases, the World Avatar contains an ecosystem of autonomous computational agents that continuously update it, where the semantic annotation of the data and agents seeks to enable cross-domain interoperability (Eibeck et al., Reference Eibeck, Lim and Kraft2019).
The design of the World Avatar has been demonstrated as one way to implement a comprehensive Universal Digital Twin, for example a digital twin of the UK (Akroyd et al., Reference Akroyd, Mosbach, Bhave and Kraft2021). The design confers a number of advantages which include the adoption of a distributed architecture that supports a uniform interface to query multiple data sources, the ability to use logical reasoning to verify the consistency of semantic models (Devanand et al., Reference Devanand, Karmakar, Farazi, Krdzavac, Lim, Foo, Karimi and Kraft2021), and a mechanism that allows computational agents to interact to answer questions (Zhou et al., Reference Zhou, Eibeck, Lim, Krdzavac and Kraft2019, Reference Zhou, Lim and Kraft2020). The use of Linked Data helps address ambiguity, facilitates the discovery and reuse of information and enables the linking of related information.
The World Avatar, and the digital twins based on it, include the idea of a “base world” that describes the real world and that is kept current in time by computational agents that input data from the real world into the knowledge graph and that simulate the behavior of the world, and of “parallel worlds” that support what-if scenario analysis (Eibeck et al., Reference Eibeck, Chadzynski, Lim, Aditya, Ong, Devanand, Karmakar, Mosbach, Lau, Karimi, Foo and Kraftand2020). The parallel worlds capability allows exploring consequences of alternative design and policy choices to support decision making in complex environments.
Work to develop a dynamic-knowledge-graph-based Universal Digital Twin of the UK (Akroyd et al., Reference Akroyd, Mosbach, Bhave and Kraft2021; CMCL Innovations, 2021) is ongoing. The digital twin currently includes a description of all the power plants in the UK (Atherton et al., Reference Atherton, Xie, Aditya, Zhou, Karmakar, Akroyd, Mosbach, Lim and Kraft2021). Work to establish data pipelines to describe buildings (Chadzynski et al., Reference Chadzynski, Krdzavac, Farazi, Lim, Li, Grisiute, Herthogs, von Richthofen, Cairns and Kraft2021), the gas transmission network, geospatial climate data and the potential for solar and wind power in the UK is underway. The representation of biomass availability and land use within this digital twin will enrich the description of the UK provided by the base world. This will support parallel world analyses that consider the role of land use in supporting decarbonization.
2.2. Land use and biomass
The following sections review data from the Crop Map of England (Rural Payments Agency, 2019a) and ontologies that describe biomass availability, land cover, and land use, and assesses their potential application in a digital twin of the UK. Data for the energy content and yield of crops are also surveyed. Comments on other data sources are given in Supplementary Appendix A.1.
2.2.1. The Crop Map of England
The Crop Map of England (CROME) (Rural Payments Agency, 2019a) describes land use in England. The data are published annually on behalf of the UK Government by the Rural Payments Agency (RPA). The land use is classified using a combination of data from the Sentinel-1 (radar images) (European Space Agency, 2021a) and Sentinel-2 (optical images) (European Space Agency, 2021b) satellites, and ground truth data from land declarations submitted by farmers, woodland owners, foresters, and land managers when applying for the Basic Payments Scheme (Rural Grants & Payments, 2020) and Countryside Stewardship (Rural Grants & Payments, 2021) grants. Automatic image classification is performed using a supervised Random Forest (Breiman, Reference Breiman2001) machine learning algorithm. The algorithm learns by associating satellite images with the ground truth data. The accuracy of the classification technique has been estimated as 95.4% (Rural Payments Agency, 2019a) based on a comparison of ground truth data versus the corresponding Random Forest classification (sample size, n = 4,833). The resulting data are published on a regular grid consisting of approximately 32 million hexagonal cells, each with an area of 4,156 m2. Figure 2 shows a sample of the 2019 data.
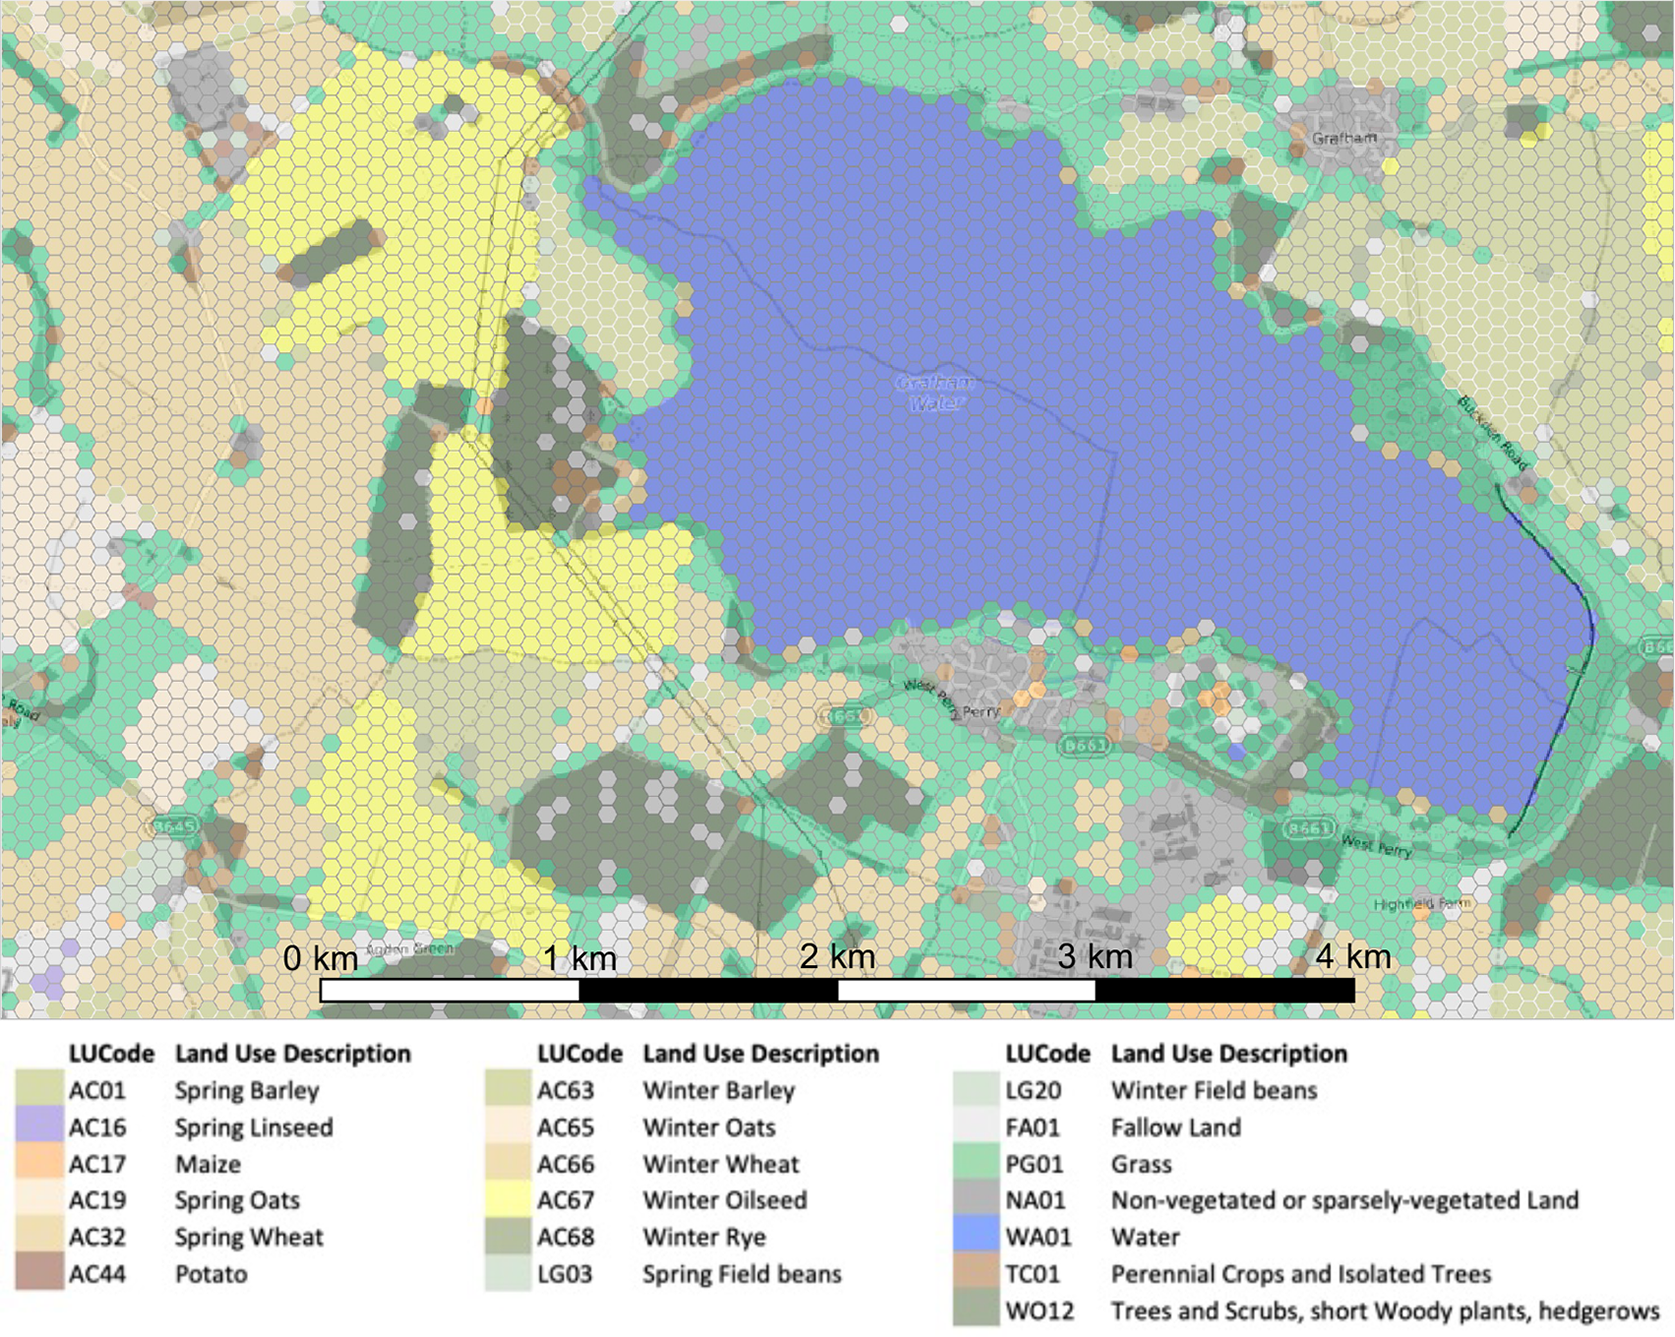
The land use in each cell is described by means of an alphanumeric Land Use Code (LUCode). There are 81 LUCodes used in the CROME data set (Rural Payments Agency, 2019a), however, more LUCodes exist and the RPA publishes a definitive list (Rural Payments Agency, 2019b). The LUCodes belong to land cover categories of Cereal Crops, Leguminous Crops, Energy Crops, Grassland, Nonagricultural Land, Water, Trees, and Unknown Vegetation or Mixed Vegetation. Example LUCodes and their associated land cover categories and descriptions are given in Supplementary Table A.1.
The CROME data is available for download (Rural Payments Agency, 2019a) in the form of 46 files covering different regions of England. The files are available in Geography Markup Language (GML) (Open Geospatial Consortium, 2021) and Geospatial JavaScript Object Notation (GeoJSON) (Internet Engineering Task Force [IETF], 2016) format. The GML data is 30.1 GB in size, while the GeoJSON is 16.0 GB, where the difference is a result of the format as opposed to the content. A description of the schema used in the CROME 2019 data set is given in Supplementary Table A.2.
The CROME data offers several advantages. The data are available under an open government license (The National Archives, 2021) and are published annually in a machine-readable format. It is further assumed that the data are likely to continue to be available in future years. However, there are also a few issues. Firstly, there are instances in which land use is misclassified when a hexagonal cell overlaps two different land use types. Secondly, although CROME is produced by the RPA, the LUCodes that appear in the CROME data (Rural Payments Agency, 2019a) and the LUCodes published by the Rural Payments Agency (2019b) exhibit some minor differences. For example, CROME defines TC01 as “perennial crops and isolated trees” (Rural Payments Agency, 2019a), whereas the RPA defines TC01 as “permanent crops other than nursery crops and short rotation coppice” (Rural Payments Agency, 2019b). Thirdly, it was found that there were no instances of LUCode SR01. This corresponds to “short rotation coppice” which is an energy crop. This is surprising because short rotation coppice certainly exists, and the reason for the absence of SR01 remains unexplained. Finally, the CROME data only cover England, rather than the whole of the UK.
A further challenge relates to coordinate systems. CROME uses EPSG:27700 (Maptiler, 2019a) (also known as OSGB36 or British National Grid), an easting–northing system commonly used in topographic mapping of the UK. However, the geospatial capability offered by Blazegraph (2021) requires EPSG:4326 (Maptiler, 2019b) (latitude–longitude, also known as WSG84), a standard system for satellite navigation and GPS. This means that the processing of the CROME data must include a coordinate transformation if the digital twin is to use the geospatial capability of Blazegraph.
2.2.2. Energy and yield data
This section surveys data that can be used to estimate the power associated with different types of biomass to support a use case relating to electricity generation. Data relating to the power available from crops are typically expressed in the form of the power per unit area of land (W/m2) (MacKay, Reference MacKay2009). However, energy content and yield data that can be used to derive the power per unit area are desired because this will provide a broader scope for the ontology. Although the energy content and yield of a crop will of course vary spatially and temporally due to different environmental conditions and farming techniques, the data surveyed here do not provide this level of information and it is not attempted to account for such variations at this iteration of the digital twin. Rather, the data provide typical values. Table 1 summarizes the surveyed data and evaluates its suitability for inclusion in an ontology that can be used to support estimates of the power available from biomass.
Table 1. Comparison of surveyed data resources for energy content and yield of crops.
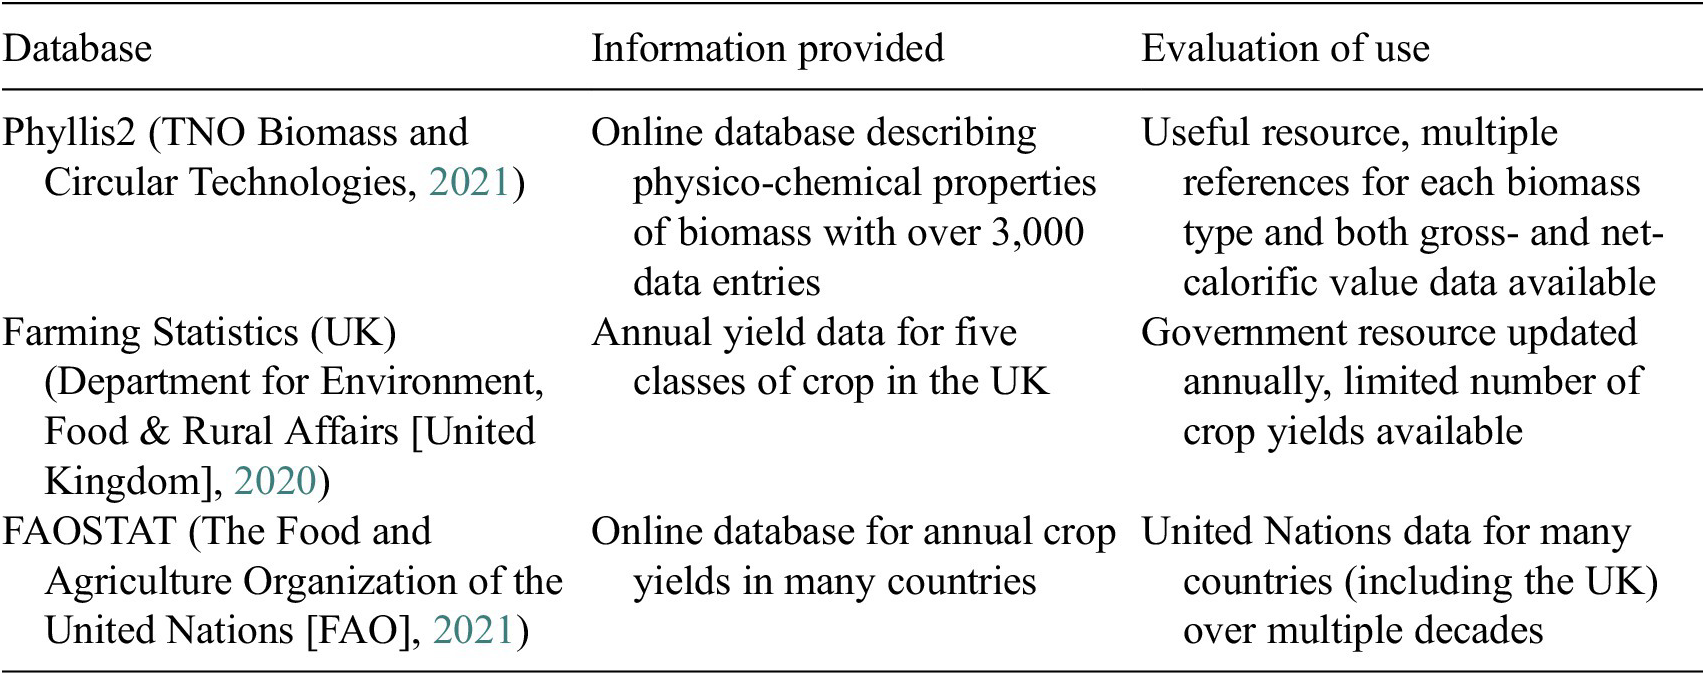
Phyllis2 (TNO Biomass and Circular Technologies, 2021) is an online database for the physico-composition of biomass. It contains over 3,000 data entries and is updated and extended regularly. The entries include information about the gross- and net-calorific value associated with each biomass type, including distinguishing between different forms of biomass type, including, “As Received,” “Dry,” and “Dry and Ash Free.” The database contains information relating to 17 crops that appear in the CROME data set. The data can be downloaded in Comma Separated Variable (CSV) format.
The UK Government publishes farming statistics that include yields of common crops (Department for Environment, Food & Rural Affairs [United Kingdom], 2020), including wheat, barley, oilseed, oats, and minor cereals (rye, maize, and triticale). There is overlap with 11 crops in the CROME data set. The data is updated annually and is specifically concerned with the UK. However, the data is published in PDF format so additional work would be required to make it machine-readable. Two further sources were found to extend the yield data to include miscanthus (Forest Research, Forestry Commission, UK, 2021a) and sunflower (YARA International, 2018).
The Food and Agriculture Organization of the United Nations (FAO) has created an online FAOSTAT database (The Food and Agriculture Organization of the United Nations [FAO], 2021) that includes data about the yields of crops in many countries. There is overlap with 30 crops in the CROME data set. The database is updated annually and includes historic data going back to 1961. The data can be downloaded in CSV format. The availability of data for many countries is likely to be of further value in the future to describe the yield of crops grown outside of the UK.
2.2.3. Existing ontologies
Ontologies that describe biomass availability and land use have been surveyed. Consideration was given to the coverage of the ontologies and their applicability to the data surveyed in the previous sections. A summary of the survey is given in Table 2.
Table 2. Comparison of ontologies related to biomass availability and land use.
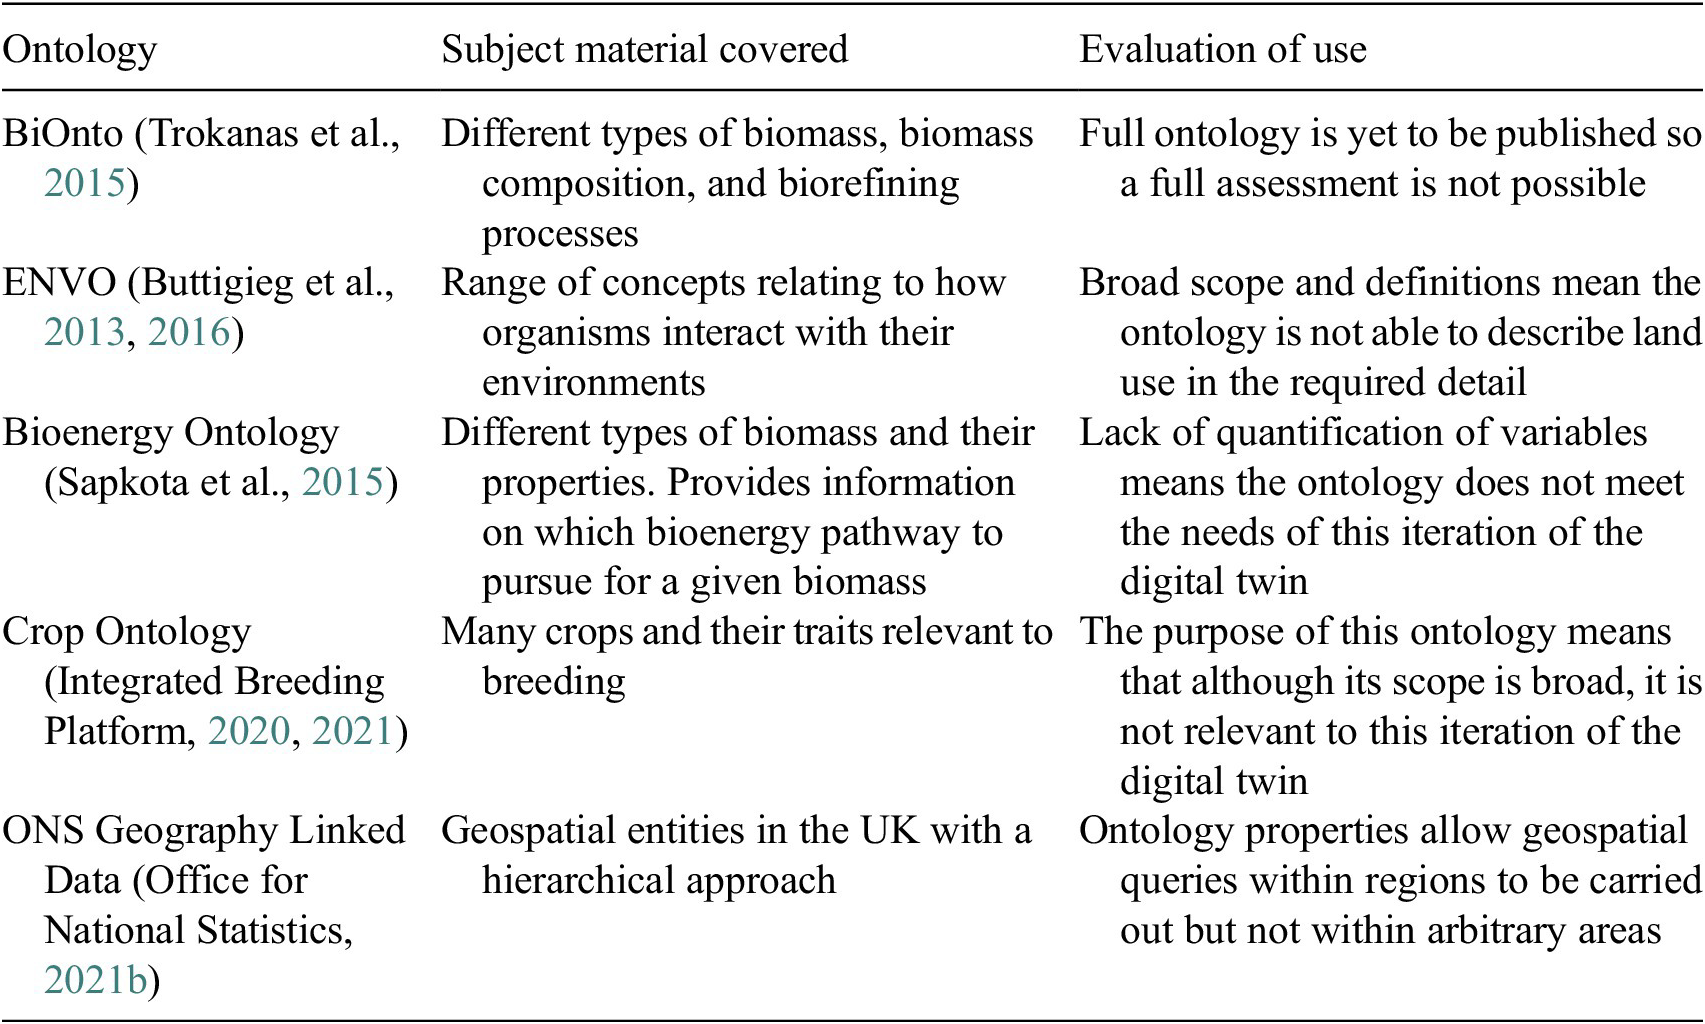
BiOnto was developed in 2015 to describe biomass types, biomass composition, and biorefining process technologies (Trokanas et al., Reference Trokanas, Bussemaker, Velliou, Tokos, Cecelja, Gernaey, Huusom and Gani2015). An ontology describing biomass, the type and composition of biomass would be valuable information. It appears that BiOnto may provide only qualitative descriptions of some things, for example, heating values are described as “low,” “medium,” or “high.” However, the full ontology is yet to be published, so it is not possible to make a full assessment.
The Environmental Ontology (ENVO) was created in 2013 to ontologise a range of concepts relating to environmental classification (Buttigieg et al., Reference Buttigieg, Morrison, Smith, Mungall and Lewis2013). Relevant concepts in the ontology include land descriptions such as grassland and woodland. As of 2016, the objective of ENVO was to describe the interactions of organisms with their environments (Buttigieg et al., Reference Buttigieg, Pafilis, Lewis, Schildhauer, Walls and Mungall2016). Whilst this focus is clearly of considerable value, ENVO is not able to describe land use in the level of detail required for the current iteration of the digital twin.
The Bioenergy Ontology (Sapkota et al., Reference Sapkota, Raju, Chapman, Byrne and Melville2015) was published in 2015 to describe different types of biomass and its properties. The ontology aims to help farmers and other stakeholders make decisions about the best bioenergy pathway to pursue for a given biomass. The ontology describes the major biomass types: agricultural residues, municipal waste, wood and crops, which are further divided into subcategories. This hierarchical classification is useful. However, the individual biomass types are described qualitatively in terms of properties such as consistency, phase, and moisture content, whereas a quantitative description is required to estimate the power available from the biomass.
Development of the Crop Ontology (Integrated Breeding Platform, 2021) began in 2008 and is ongoing. The ontology describes many crops, perhaps in part owing its longevity and its open-source nature. It is part of the Integrated Breeding Platform (2020) and focuses on traits relevant to breeding. Again, whilst clearly valuable, this does not meet the needs of the current work.
The Office for National Statistics (ONS) publishes “Geography Linked Data” (Office for National Statistics, 2021b) which describes various geographical entities in the UK, for example, town, district, and regional boundaries. Each entity has a geometry defined by a hasGeometry property. A hierarchy is created using the within property, which states that one geographic entity is within another. This approach is extremely useful. However, it cannot support arbitrary geospatial queries so it will still be necessary to encode additional geospatial data if it desired to answer such queries, for example to identify all resources within a particular distance of some location. The ONS data, along with data from several branches of UK government (Department for Environment, Food & Rural Affairs [United Kingdom], 2021; Ministry of Housing, Communities & Local Government [United Kingdom], 2021; Office for National Statistics, 2021a; The Scottish Government, 2021), is published using the PublishMyData platform (Swirrl, 2021).
The broad scope of the ontologies surveyed here mean they may be useful in the future. However, they do not provide the classification of land use nor the support for geospatial queries required by the current use case. This means that it will be necessary to create new ontologies.
3. Methodology
3.1. Ontology development
Ontologies have been created for the following domains: land use classification; representation of geospatial land use data; relation of land use to its constituent biomass and associated energy content. The ontologies provide a geospatial description of land use and biomass that the existing ontologies surveyed in Section 2.2.3 could not.
Ontologies can be developed using either a “top-down” or “bottom-up” approach (Lim et al., Reference Lim, Liu and Chen2015). The top-down approach involves defining high-level concepts that can be widely applied before defining increasingly specific terminologies, often involving manual work to define nontrivial relationships and concepts. The bottom-up approach is application focused, resulting in ontologies that cover the necessary concepts rather than having broad scope. In this work, we adopt a bottom-up methodology.
The following sections describe the development of the ontologies and their interconnections. Whilst some aspects of the ontologies mirror the structure of the resources identified in Sections 2.2.1 and 2.2.2, the ontologies were constructed to maximize their generality wherever practicable. The names of ontological classes and properties are written in italics, for example the LandUseCode and LandUseCodeType classes that are related through the hasLandUseType object property. A formal description logic (Baader et al., Reference Baader, Calvanese, McGuinness, Nardi and Patel-Schneider2007) representation of the ontologies is provided in Supplementary Appendix A.2. An archived version of the ontologies are provided as part of the Research Data associated with this article.
3.1.1. OntoLandUse
OntoLandUse was developed to provide an ontology to describe land use classification based on the approach taken by the RPA and CROME. The ontology uses LUCodes and their associated definitions to distinguish land uses. OntoLandUse was instantiated to represent the union of the 217 LUcodes defined by the RPA and 81 LUCodes used by CROME (77 of which overlap with the RPA definitions) using OWL. The design of the ontology is intended to generalize to allow land use codes defined by other jurisdictions. Figure 3 shows the structure of the OntoLandUse ontology.
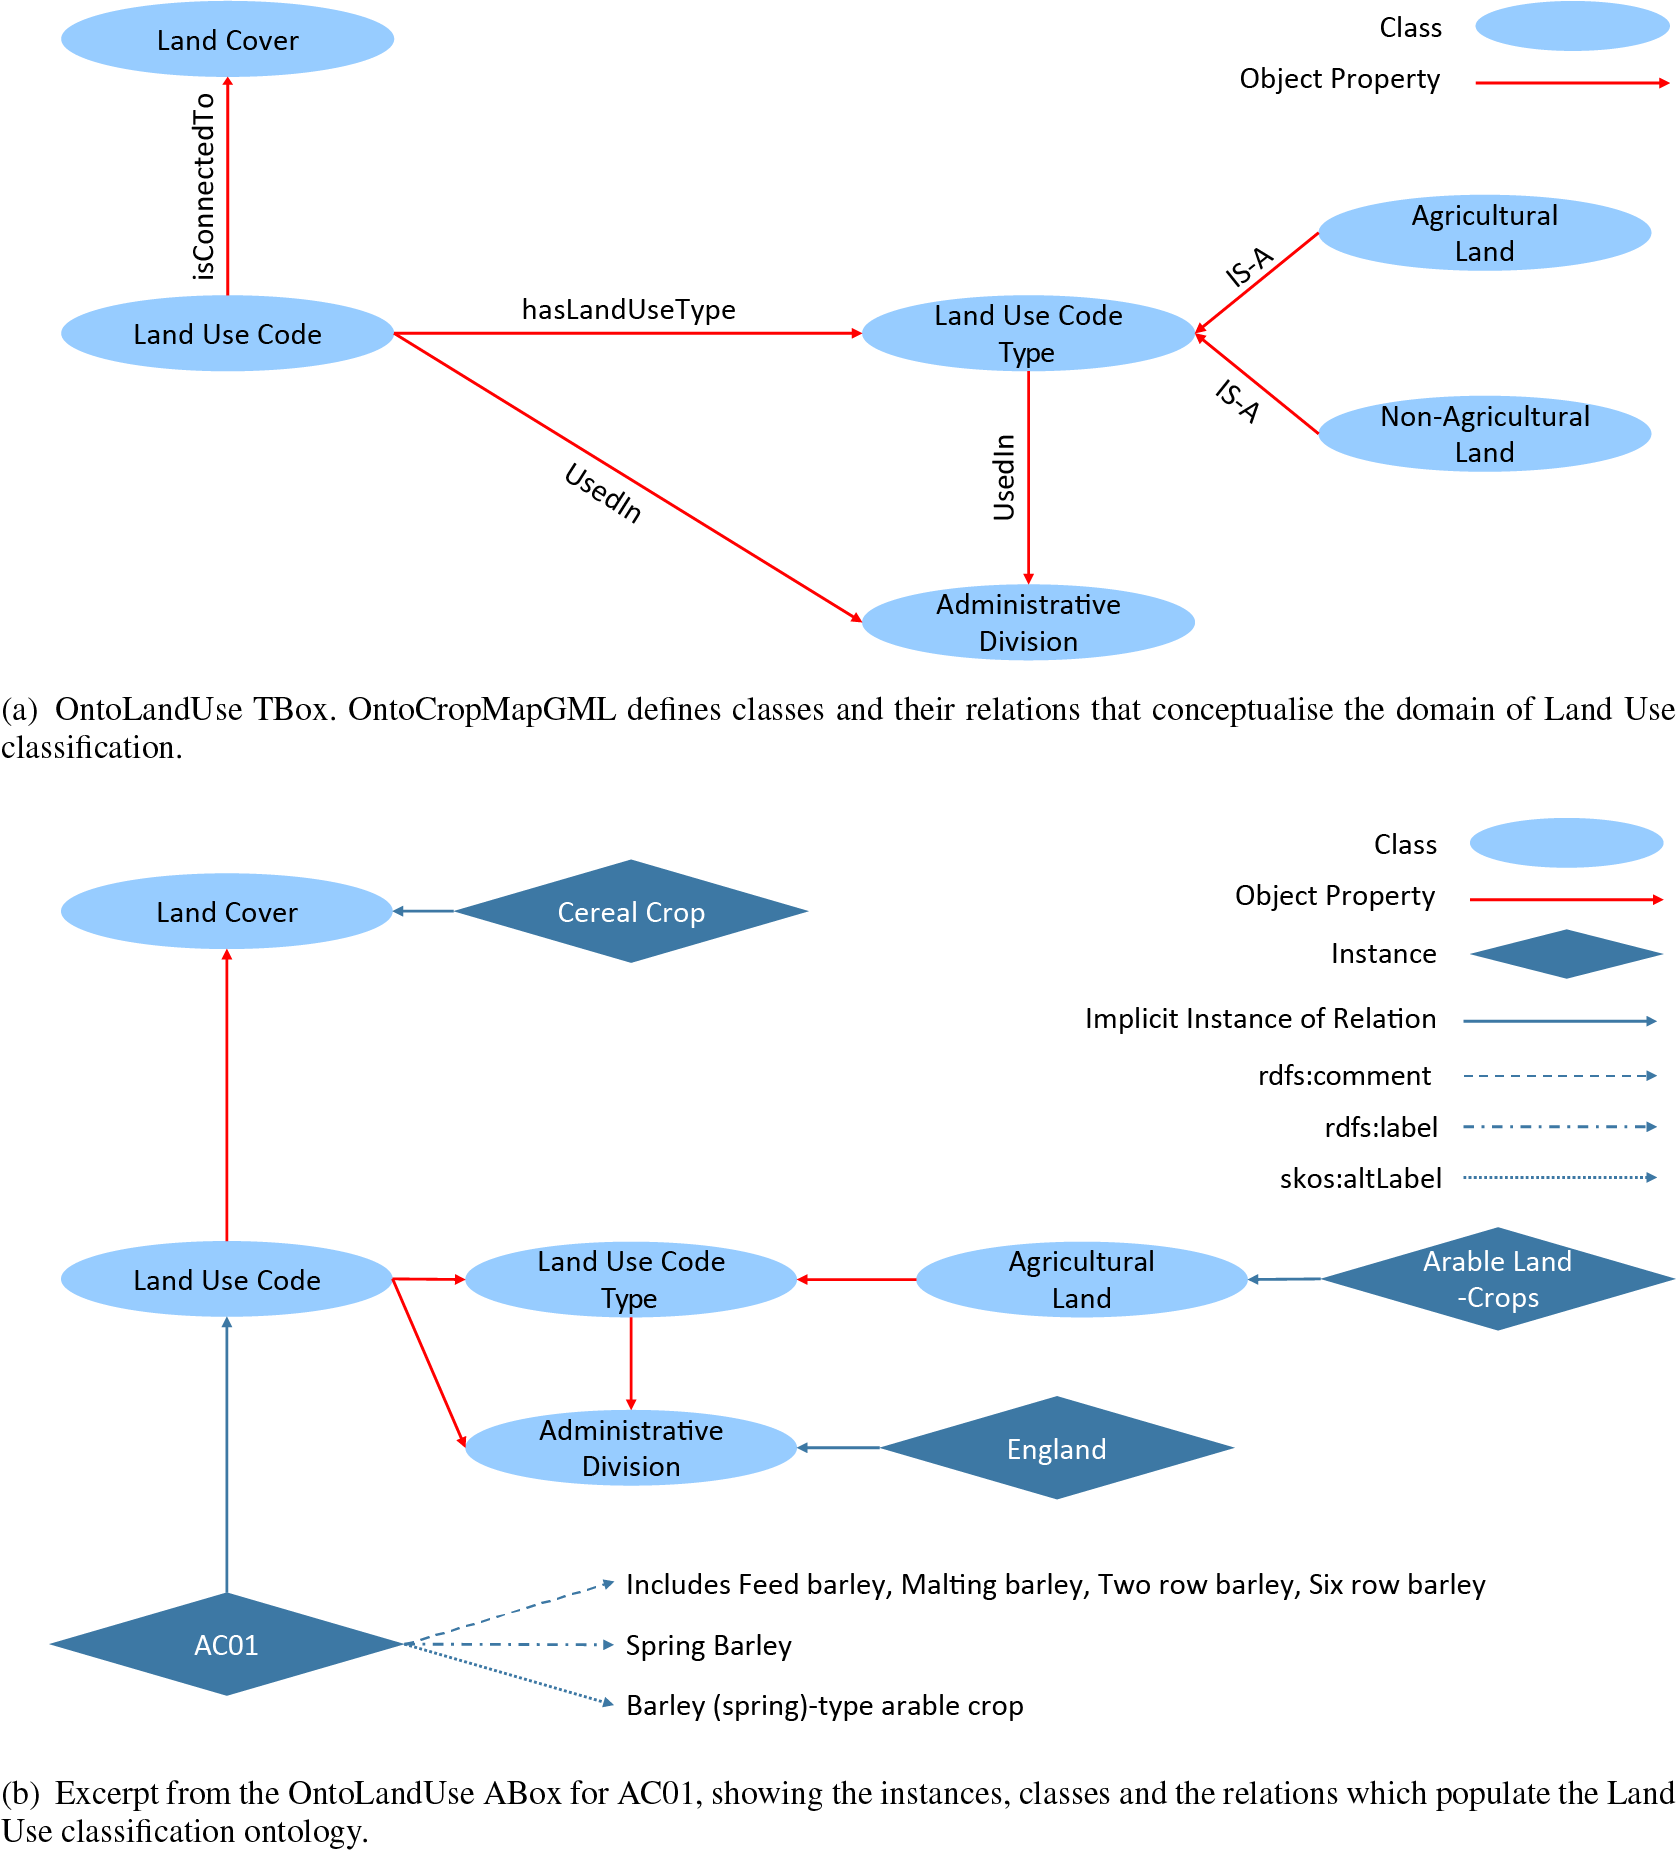
Figure 3. Structure of the OntoLandUse ontology.
Figure 3a shows the structure of the OntoLandUse TBox. The LandCover categories follow from the CROME data. Examples include “Cereal Crops,” “Trees,” “Grassland,” and “Leguminous Crops.” These are general and could be used to describe land use anywhere. The LandUseCode follows from the definitions provided by the RPA and CROME. The LandUseCodeType allows for the grouping of LUCodes. The groups that contain the most LUCodes and with the most relevance to land use classification are “Agricultural Land” and “Nonagricultural Land” (Rural Payments Agency, 2019b). Subclasses of LandUseCodeType are created for these categories. The ontology also allows the specification of the AdministrativeDivision in which the LandUseCode and LandUseCodeType are used. This is intended to allow the extension of OntoLandUse to describe other countries and regions.
Figure 3b shows an excerpt from the ABox for spring barley (LUCode AC01). The rdfs:label data property is used for the primary description of the LUCode provided by CROME. The “Land Use” name and “Description” of the LUCode provided by the RPA (Rural Payments Agency, 2019b) are captured using skos:altLabel and rdfs:comment properties, respectively. Although not shown in Figure 3, the TBox imposes cardinality restrictions that limit the number of range instances (of classes) that can be related to a domain instance by a given object property. For example, an instance of LandUseCode can only be linked to one instance of LandCover by the isConnectedTo object property.
3.1.2. OntoCropMapGML
OntoCropMapGML establishes a vocabulary for the geospatial terminology that appears in the (Geography Markup Language format) CROME data to enable geospatial queries.
Figure 4 shows the TBox of OntoCropMapGML. It incorporates properties and ranges described by a number of general-purpose ontologies, including data and object properties defined by OntoCityGML (Chadzynski et al., Reference Chadzynski, Krdzavac, Farazi, Lim, Li, Grisiute, Herthogs, von Richthofen, Cairns and Kraft2021), which defines terms used to describe built environments that can appropriately describe certain geospatial elements of the CROME data. The classes and relationships that have been defined elsewhere are prefixed with the namespace of their native ontologies. For example, the OntoCityGML:boundedBy object property is defined by OntoCityGML. This is consistent with best-practice because the sharing of common terminologies from high-level top-down ontologies that define abstract concepts promotes interoperability with other ontologies. A full list of namespaces is provided in Supplementary Appendix A.3.
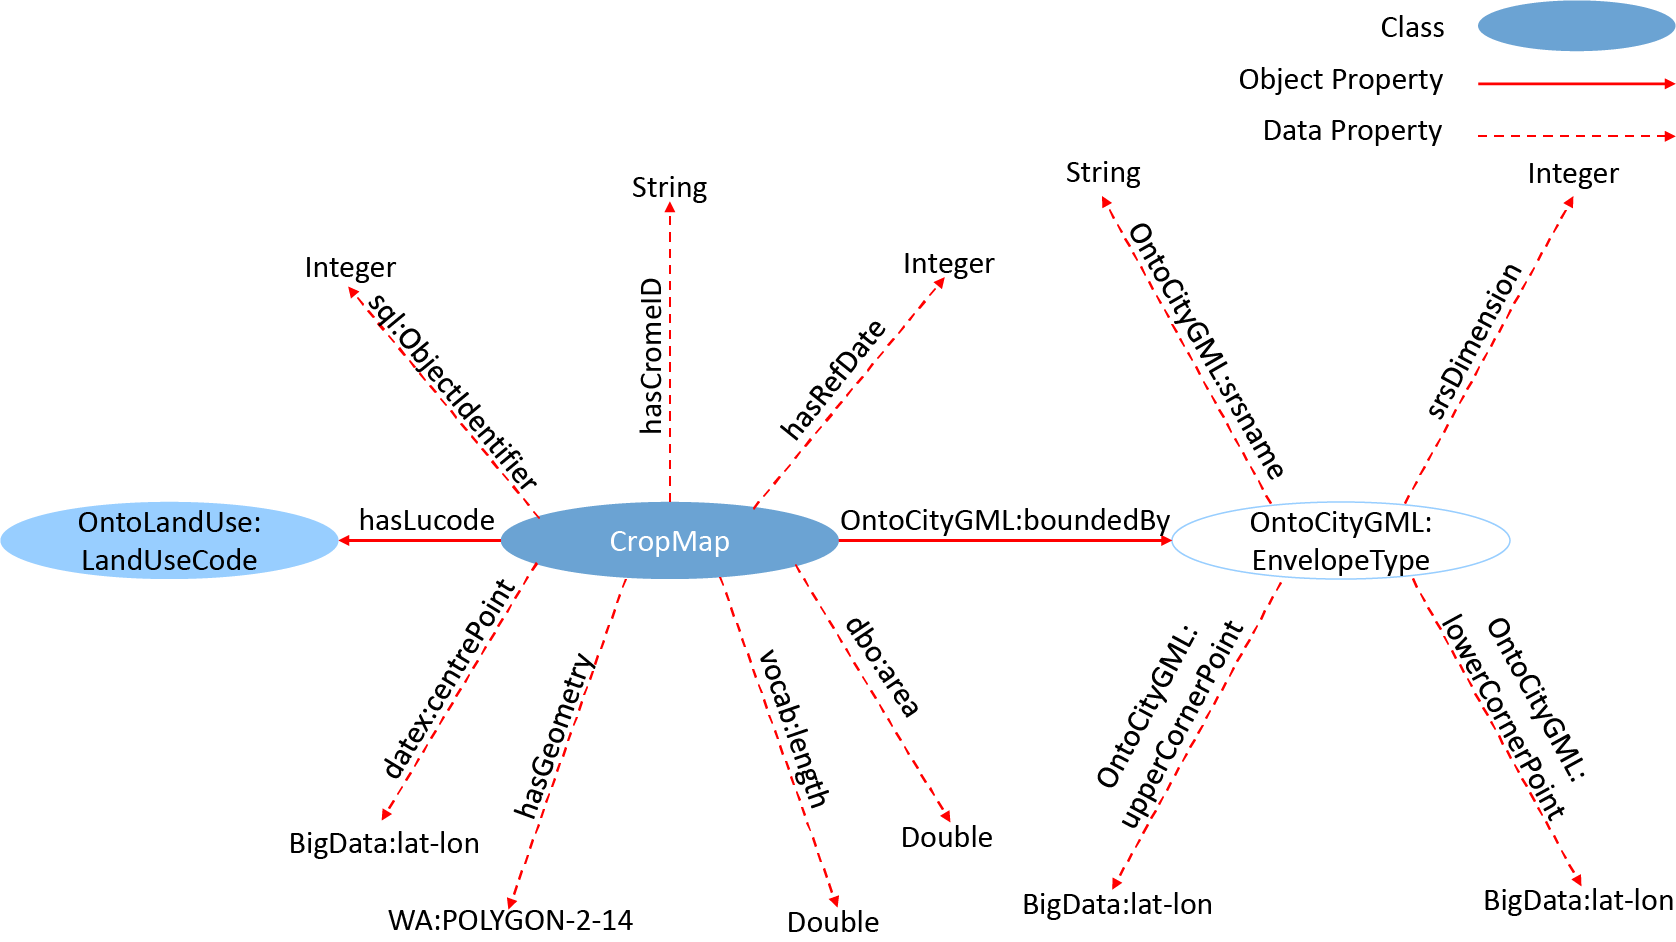
Figure 4. OntoCropMapGML TBox. OntoCropMapGML links the description of land use classification provided by OntoLandUse with a geospatial description of land use.
Each instance of the CropMap class, also referred to as a feature member, derives from one entry (i.e., one hexagonal cell) in the CROME data set. The data properties associated with an instance of CropMap describe its centrepoint location, geometry and associated metadata. The center point is encoded via a datex:centrePoint object property that links to an instance of the BigData:lat–lon class, whilst the geometry of the (hexagonal) cell boundary in encoded via a hasGeometry object property that links to an instance of a WA:POLYGON-2-14 class. Both enable geospatial queries via Blazegraph (2021). This choice of how to encode the geospatial data and its implications are discussed later in Section 4. The hasLucode object property links to an instance of the OntoLandUse:LandUseCode class, allowing geospatial queries levied via OntoCropGML to retrieve data about land use. The OntoCityGML:boundedBy object property links to an instance of the OntoCityGML:EnvelopeType class that describes the bounding region to which the instance of CropMap belongs. The bounding coordinates and other metadata about the OntoCityGML:EnvelopeType are described by further data properties.
OntoCropMapGML was instantiated to represent the full CROME data set using OWL. The instantiation was complicated by the need to convert the geospatial data elements from the EPSG:27700 (Maptiler, 2019a) to the EPSG:4326 (Maptiler, 2019b) coordinate system. EPSG:27700 uses easting and northing references to a two-dimensional projection of Great Britain, whereas EPSG:4326 includes a more advanced geodesy with angles of latitude and longitude specifying a location on the surface of an ellipsoidal model of Earth. The conversion is nonlinear and the conversion procedure inherently iterative and nonexact, with some procedures resulting in significant errors that vary with geographical position. Permitting such conversion errors would run counter to the objective to develop a high-quality digital twin and would negate the accuracy of the raw CROME data. The conversion was performed using pyproj (Whitaker, Reference Whitaker2021), which provides accurate conversion (error $ \ll 1 $
m) at acceptable computational cost.
$ \ll 1 $
m) at acceptable computational cost.
3.1.3. OntoCropEnergy
OntoCropEnergy has been created to provide an ontology to define the minimum terminology required to allow land use to be related to the biomass made available by the land, and to estimate the energy content and rate of production of the biomass. This enables quantitative calculations surrounding land use. Although analyses of energy provision frequently focus on power per unit area (MacKay, Reference MacKay2013; Antonini and Caldeira, Reference Antonini and Caldeira2021), it was decided to distinguish between crop yield (mass productivity per unit area of biomass) and calorific value (energy content per unit mass) to broaden the scope of OntoCropEnergy. For example, food production applications can use OntoCropEnergy in a way that would not be possible it solely defined concepts related to power generation from biomass.
Figure 5 shows an excerpt from the OntoCropEnergy TBox. The Crop class is so named to maintain a consistent nomenclature with OntoLandUse and OntoCropMapGML. The full TBox defines 23 subclasses of Crop, however for the sake of clarity, Figure 5 shows only Barley. The OntoCropMapGML:hasLucode object property allows an instance of Crop (or a subclass of Crop) to be linked to an instance of OntoLandUse:LandUseCode in order to enable queries relating to land use to resolve information about the crop. The Crop class has object properties that allow links to GrossCalorificValue, NetCalorificValue, and CropYield classes, each of which have data and object properties to allow the specification of a numerical value and associated units, and a URL and access date to provide information about the provenance of the data. The OM namespace refers to a fork of the Ontology of units of Measure 2.0 (Rijgersberg, Reference Rijgersberg2021a, Reference Rijgersbergb) (where the fork was necessary to define new units). The properties and classes used to encode web links are imported from OntoSpecies (Farazi et al., Reference Farazi, Krdzavac, Mosbach, Menon, Nurkowski and Kraft2020b; The World Avatar, 2021b), which was developed as part of the World Avatar. A full list of namespaces is provided in Supplementary Appendix A.3.
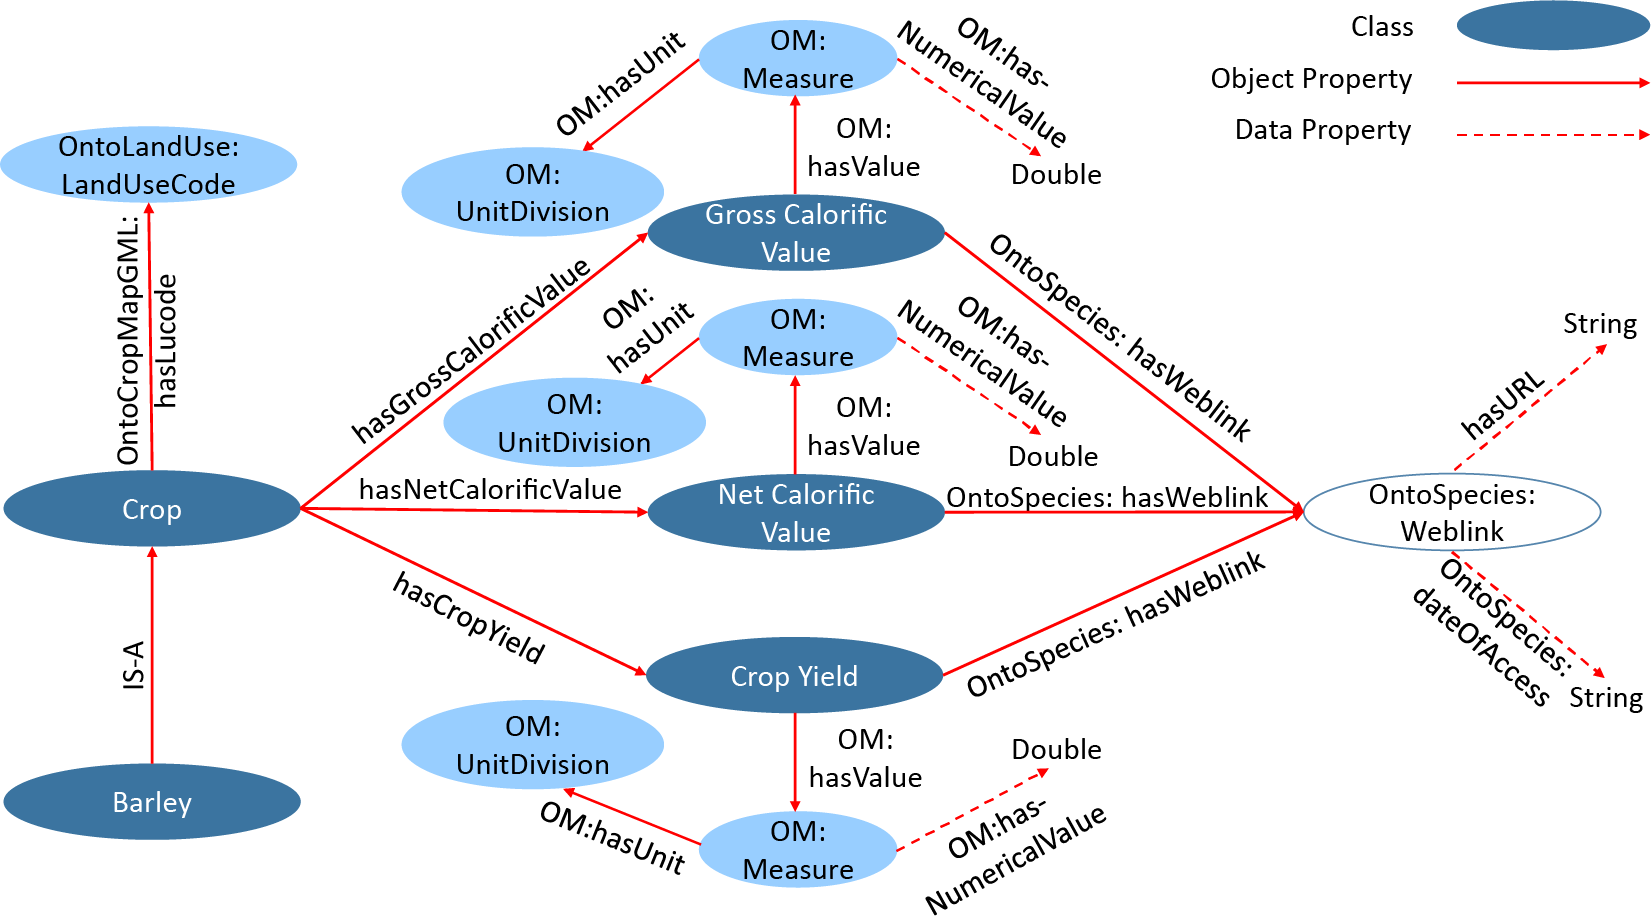
Figure 5. Excerpt from OntoCropEnergy TBox. OntoCropEnergy links the land use classification provided by OntoLandUse with data describing the energy content and yield of different crops.
OntoCropEnergy was instantiated to represent data for 33 crops using OWL. The yield data were sourced from FAOStat (The Food and Agriculture Organization of the United Nations [FAO], 2021), except for miscanthus (Forest Research, Forestry Commission, UK, 2021a), sunflower (YARA International, 2018) and maize (Department for Environment, Food & Rural Affairs (United Kingdom), 2020). The calorific value data were sourced from Phyllis2 (TNO Biomass and Circular Technologies, 2021), wherever possible using the “As Received” value given that the yield data does not account for further treatment of the crop. It was necessary to choose between different data sources for the calorific value and use a country-averaged mass productivity per unit area for each crop. This is not the most accurate approach. Ideally, the factors affecting the crops would be described via links to more detailed ontologies that included things such as climate (including temperature, rainfall, and solar intensity variation), soil condition, nutrient availability as well as agronomical effects. This is beyond the scope of this work, although it represents an opportunity for valuable future work. Nevertheless, OntoCropEnergy offers quantitative information that was lacking from the ontologies surveyed in Section 2.2.3. These data extend the scope of possible queries of OntoLandUse and OntoCropMapGML to address quantitative questions relating to land use.
3.1.4. Interconnection between ontologies
OntoLandUse, OntoCropMapGML, and OntoCropEnergy are interconnected in order to enable geospatial queries of land use, and to enable the results of such queries to be related information about the biomass available on that land.
Figure 6 shows the interconnection between the ontologies. The LandUseCode concept is central to the ability to relate information provided by one ontology to that provided by the others. OntoLandUse uses LandUseCode to classify land (based on the LUCodes defined by the RPA and CROME). OntoCropMapGML encodes (a feature member from the CROME data representing) a parcel of land as a CropMap that is related to a LandUseCode by a hasLucode property. OntoCropEnergy defines the relationship between a Crop and a LandUseCode using the same hasLucode property. In this manner, the interconnection enables the land represented by a CropMap to be associated with a Crop.
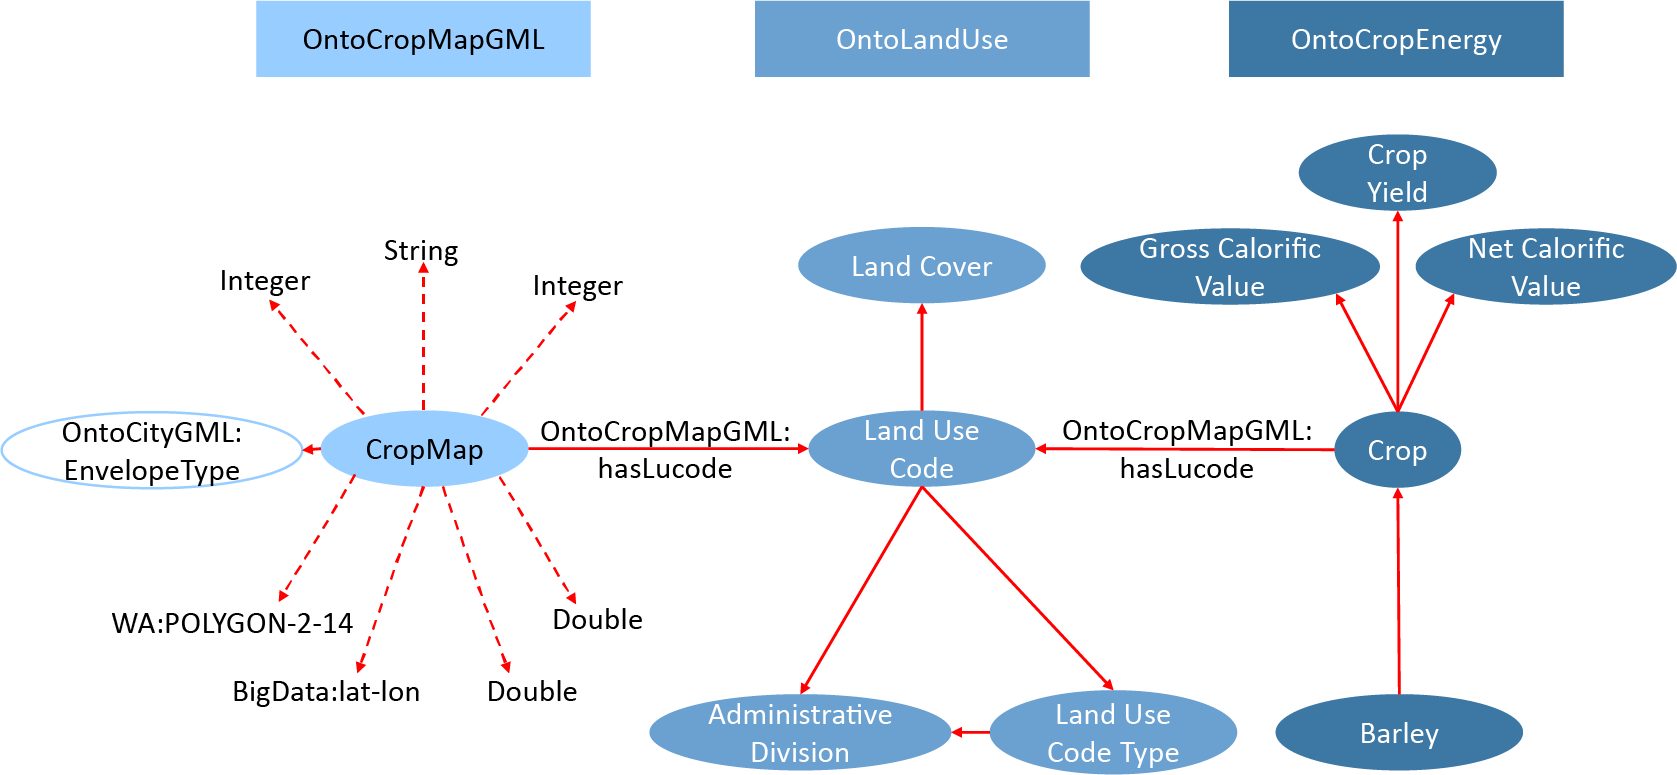
Figure 6. Interconnection between OntoLandUse, OntoCropMapGML, and OntoCropEnergy.
The structure of the ontologies is such that they can incorporate land use and biomass data from other sources, including for other countries and regions of the world. The inclusion of terminologies specifying the energy content and mass productivity per unit area (and thus the available power per unit area) of crops enables the ontologies to be used to support calculations regarding the use of biomass for energy (and food).
4. Use Case
4.1. Knowledge graph deployment
The OntoLandUse, OntoCropMapGML, and OntoCropEnergy ontologies described in Section 3 have been deployed in a knowledge graph hosted using an instance of Blazegraph (https://kg.cmclinnovations.com/blazegraph_geo). The deployed data describe the land use in the counties of Cambridgeshire, Norfolk, and Suffolk in South East England. The data consist of approximately 33 million RDF triples and are 4.6 GB in size.
The native geospatial capability of Blazegraph is limited to queries of 2D or 3D points. In order to semantically represent the hexagonal cells in the CROME data, Blazegraph was extended by integrating a custom vocabulary to define a POLYGON-2-14 data type that can be linked by data properties to classes. The name POLYGON-2-14 was an arbitrary choice, but was chosen to indicate that the data type represents a 2D object described by 14 data values (seven pairs of latitude and longitude coordinates to represent a hexagon, where the first and last pair of coordinates are the same for a closed shape). This method of defining and naming custom data types is extensible and mirrors the approach developed by Chadzynski et al. (Reference Chadzynski, Krdzavac, Farazi, Lim, Li, Grisiute, Herthogs, von Richthofen, Cairns and Kraft2021), where a family of custom data types were used for the purpose of describing 3D city data. An archived version of the custom vocabulary and data type is provided as part of the Research Data associated with this article.
4.2. Example geospatial queries
Blazegraph provides native support for geospatial queries via inRectangle and inCircle search methods. The following examples illustrate the native and extended geospatial capability of the knowledge graph. The limitations of the capability is discussed.
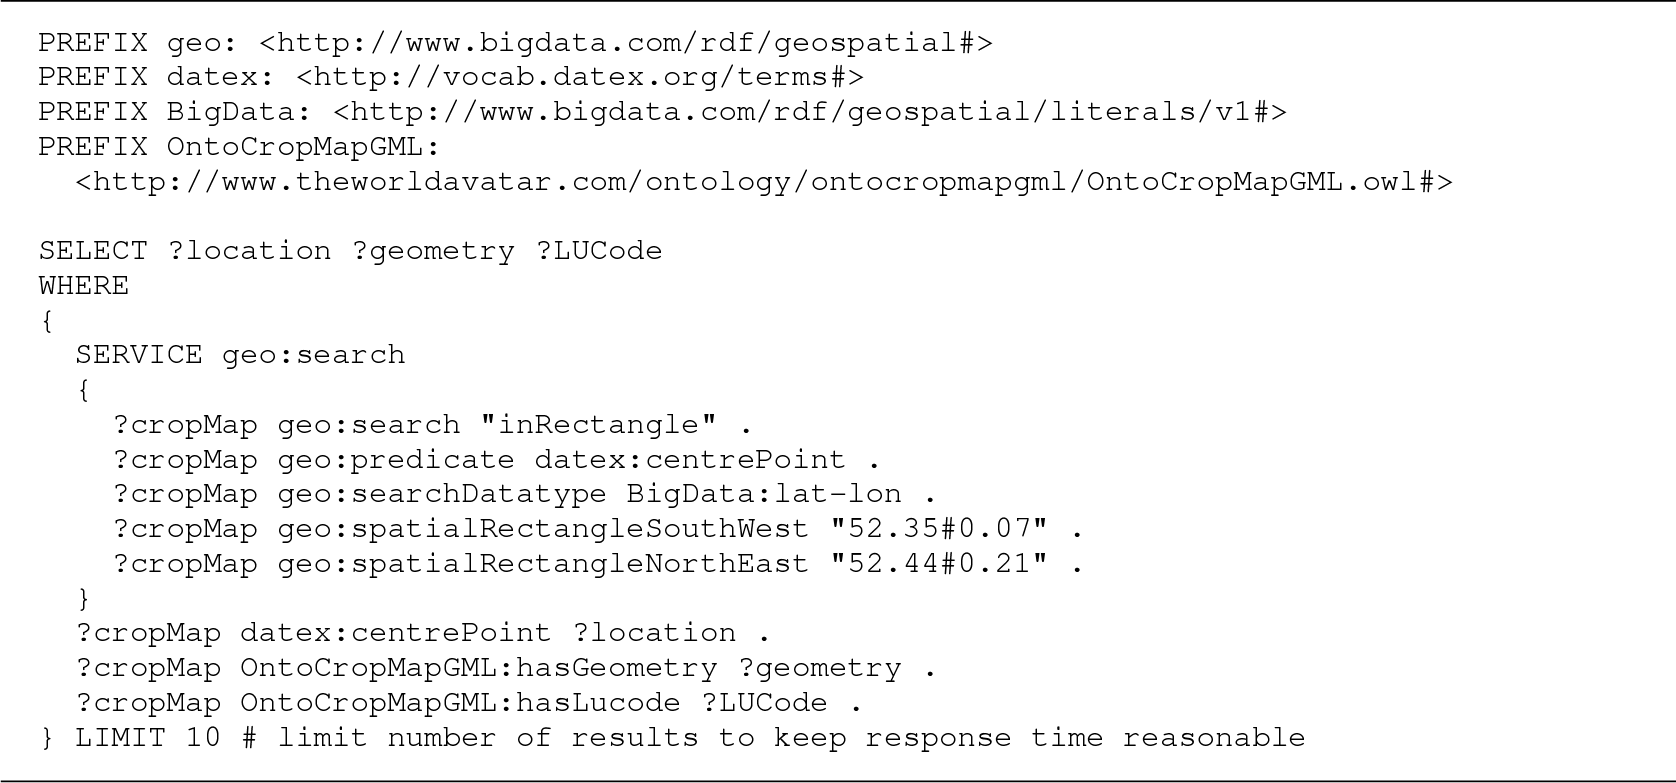
Query 1 shows an example that uses the native inRectangle method to retrieve the location, geometry and land use code of land features. Blazegraph resolves the query by using (non-GeoSPARQL) geospatial reasoning to find features with center points (described by the BigData:lat–lon type) located inside the search area. The south-west and north-east points that define the search area must be specified as BigData:lat–lon points. Queries A.1 and A.2 in Supplementary Appendix A.4 show similar queries using the inCircle method.
Query 1. Geospatial SPARQL query to retrieve the location (lat#lon), geometry ( POLYGON-2-14 ) and LUCode of land features located in a region defined by the south-west and north-east corners of a rectangle. Blazegraph resolves the query by performing geospatial reasoning against the center points of the land features.
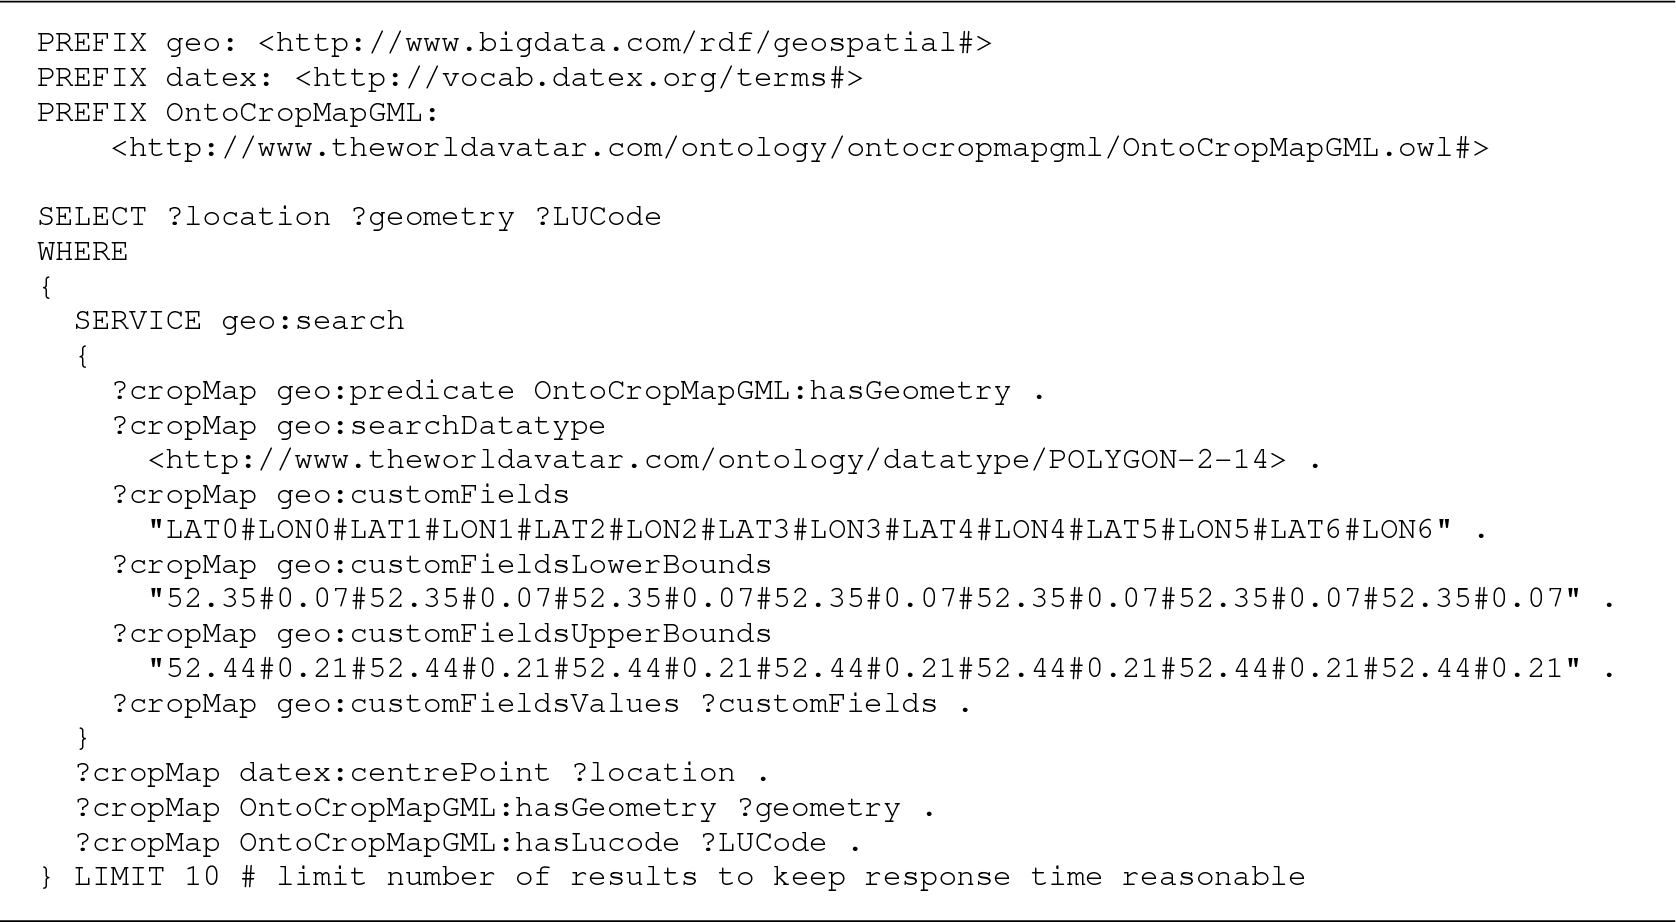
Query 2. shows an example that uses the extended geospatial capability of Blazegraph to retrieve the location, geometry and land use code of land features. The query is resolved by using geospatial reasoning to find features described by the custom POLYGON-2-14 type. Searching against a custom geospatial data type that consists of more than one geospatial point requires the specification of a search area using the geo:customFields, geo:customFieldsLowerBounds, and geo:customFieldsUpperBounds predicates. The number of items specified for each predicate must match the number of items specified in the custom type linked to the vocabulary (so 14 items to conform with POLYGON-2-14 in this case). Likewise, the names (e.g., LAT0 and LON0) specified for geo:customFields must also match the names specified in the custom type. Despite the more complex syntax, the coordinates used to specify the search area in Query 2 consist of seven repeats of the coordinates used in Query 1, so both examples actually search the same area.
Query 2. Geospatial SPARQL query to retrieve the location (lat#lon), geometry (POLYGON-2-14) and LUCode of land features located in a region defined by the south-west and north-east corners of a bounding box. Blazegraph resolves the query by performing geospatial reasoning against instances of the custom POLYGON-2-14 data type. The corners of the bounding box are specified using the geo:customFields, geo:customFieldsLowerBounds and geo:customFieldsUpperBounds predicates. The number of items specified in the predicates must conform with the number of items in the specification of the custom type, so each must have 14 items to conform with POLYGON-2-14.
Query 3 shows an example that uses a standard SPARQL query to retrieve data from an irregular area. The query uses the instance of OntoCityGML:EnvelopeType for Cambridgeshire that is linked to OntoCityGML:CropMap by OntoCityGML:boundedBy to define the scope of the query (see Figure 4 for a reminder of the structure of OntoCropMapGML).
Query 3. SPARQL query to retrieve the location (lat#lon) and LUCode for all land features located in Cambridgeshire.
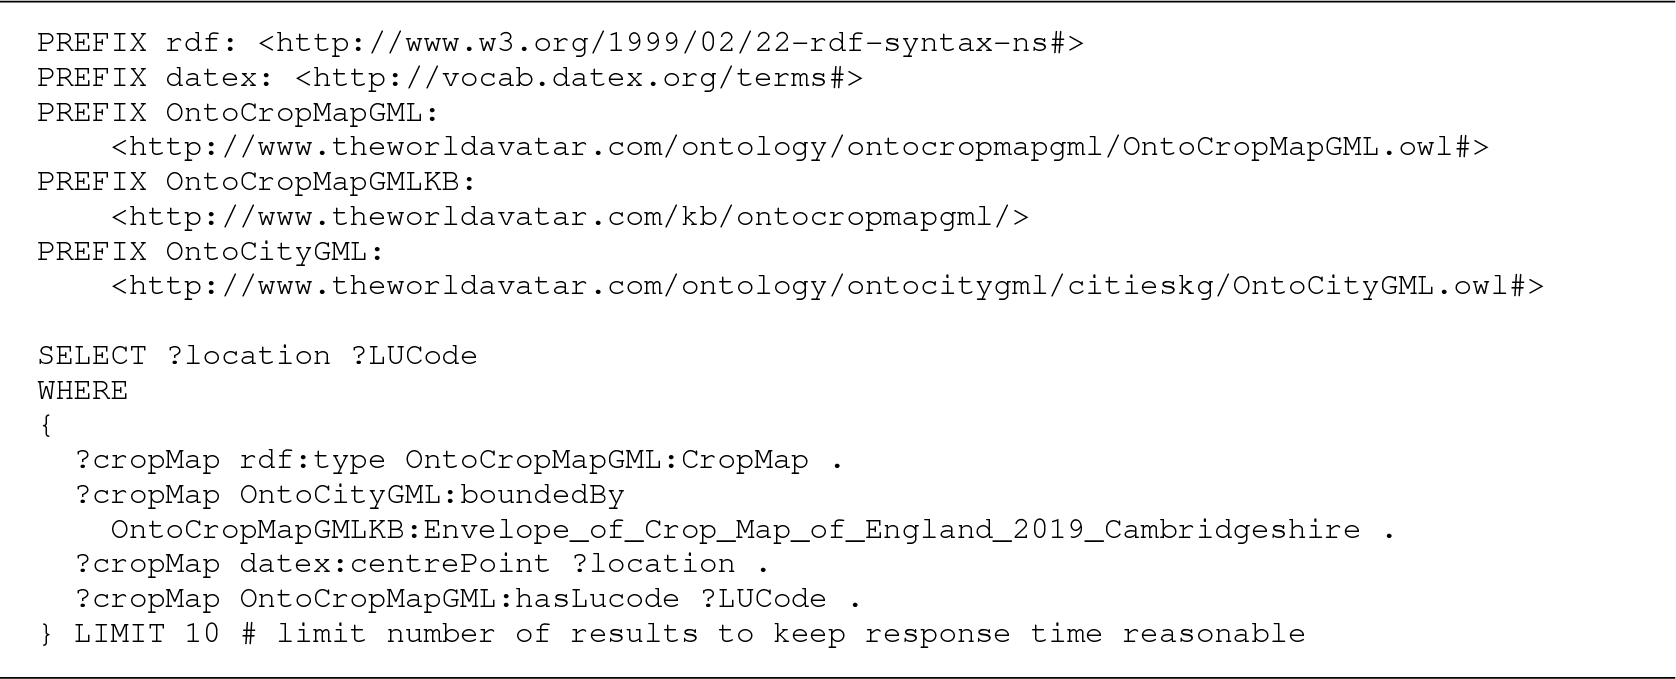
Figure 7 shows the land use in Cambridgeshire, Norfolk, and Suffolk. The data were retrieved using Query 4.2 for Cambridgeshire, and analogous queries for Norfolk and Suffolk. The query output was written to GeoJSON files and visualized using Mapbox (2021). The limitation of the approach in Query 3 is that it is necessary to know that the instance of OntoCityGML:EnvelopeType is named “Envelope_of_Crop_Map_of_England_2019_Cambridgeshire” to formulate the query. In the future, it is recommended to use within properties, analogous to the approach used by the ONS. In this case, linking to the Geography Linked Data (Office for National Statistics, 2021b) regions published by the ONS would enable simple queries to retrieve data from OntoCropMapGML for any region of the UK.
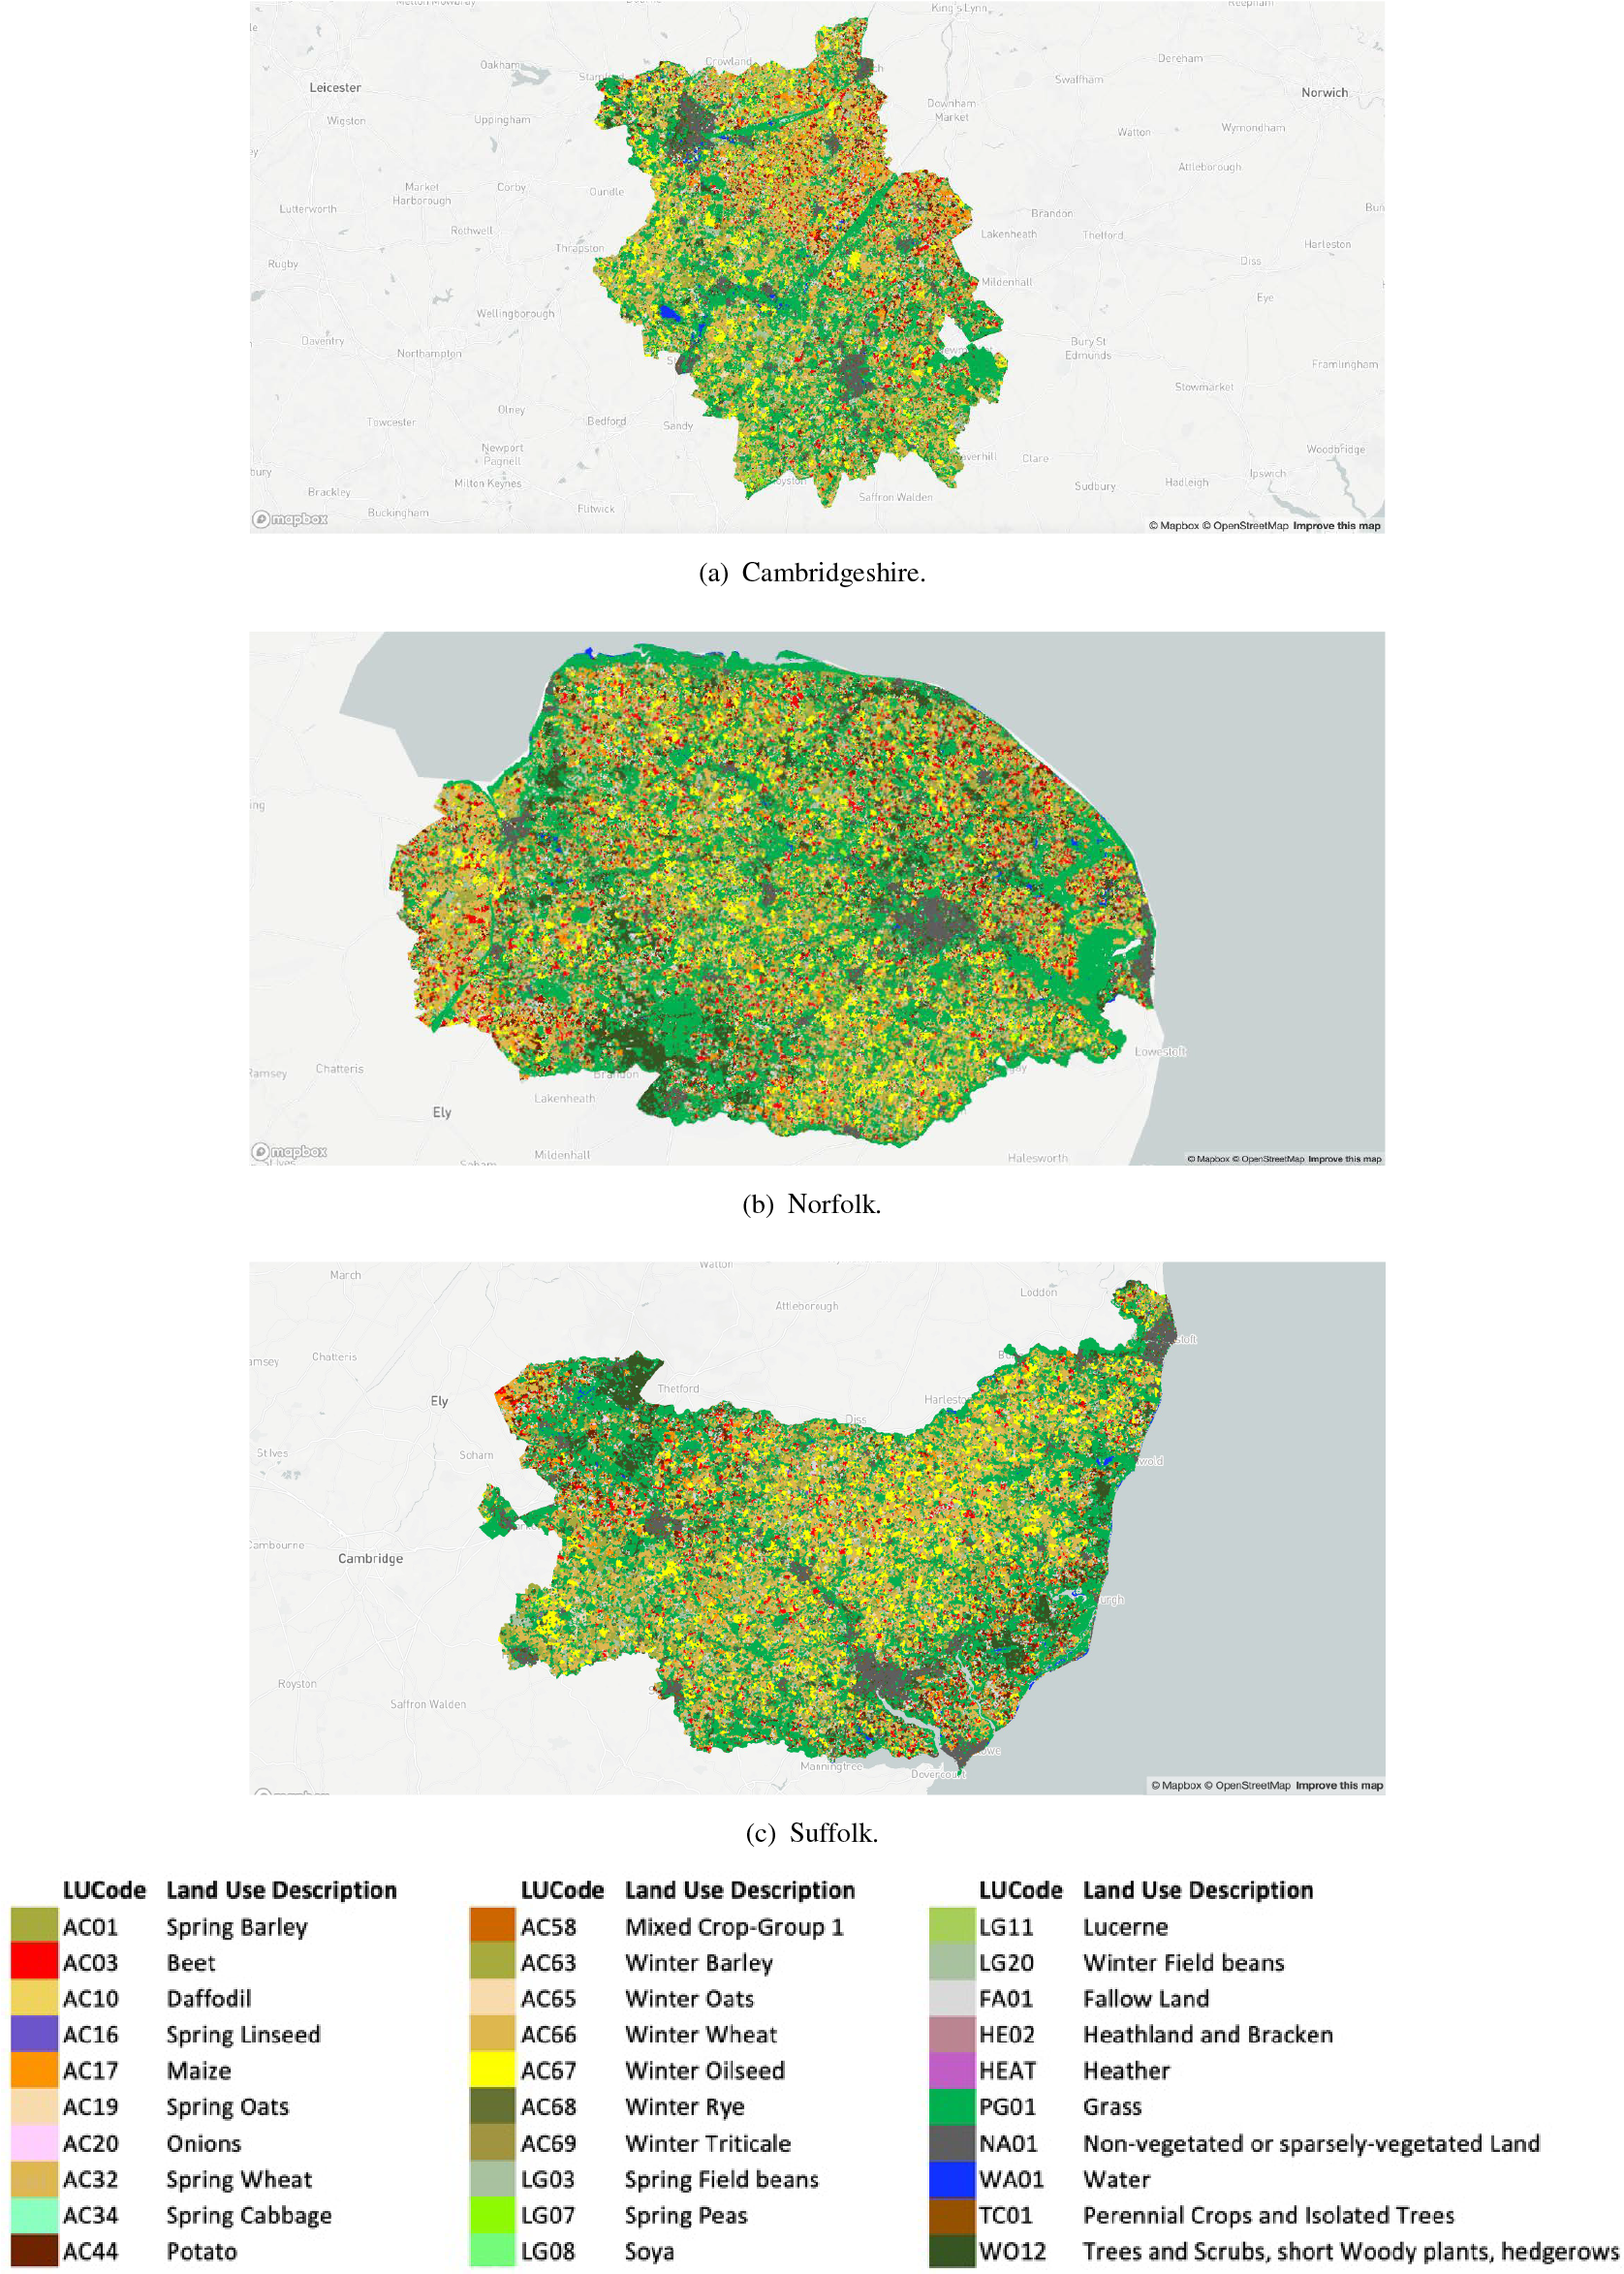
Figure 7. The complete land use data set for Cambridgeshire, Norfolk, and Suffolk.
4.3. Elean Power Station
This section presents an example use case that uses the knowledge graph to identify the minimum radius from Elean Power Station that would be required to source enough biomass for it to operate at it maximum generation capacity. This is a cross-domain use case. It requires knowledge of the electrical power system and land use, and the properties of the biomass grown on the land. The ability to support such a cross-domain case highlights the benefit of the knowledge graph approach to digital twins, in this case for solving problems relating to the decarbonization of the energy system.
Elean Power Station is a bioenergy plant located in Ely, Cambridgeshire. It was commissioned in the year 2000 and is fuelled using wheat, oilseed, and miscanthus (Engineering Timelines, 2000). It has a maximum generation capacity of 38 MWe (Engineering Timelines, 2000) and an efficiency of 32.5% (Select Committee on Science & Technology, House of Lords, 2004). The power that could be generated from Elean Power Station was estimated using a combination of geospatial queries to identify crops grown within a certain distance from the power station, and the corresponding yield, net calorific value and power available from the crops. An example calculation and details of the relevant SPARQL queries are given in Supplementary Appendices A.5 and A.6. The calculation uses typical values of the energy content and yield of the crops (see Section 2.2.2). The design of the Universal Digital Twin is such that the knowledge graph could be extended to include climate and weather data, and agent(s) that use this data to inform the spatial and temporal variation of the energy content and yield, but this is unnecessary for the current order-of-magnitude calculation.
Figure 8 shows the geospatial distribution of crops that can be used by Elean Power Station as a function of radius around the power station. Figure 9 shows the corresponding electrical power estimated using Supplementary Equation (A.2). The total wheat, miscanthus and oilseed grown within a 17.1 km radius of Elean Power Station would be sufficient for it to operate at its maximum generation capacity of 38 MWe. Clearly this is significantly less than the actual 100 km radius used to source biomass for Elean (Select Committee on Science & Technology, House of Lords, 2004) because biomass supply chains are not determined on geometric grounds alone! Nevertheless, it provides a useful illustration of the type of problem that can be addressed using the knowledge graph.
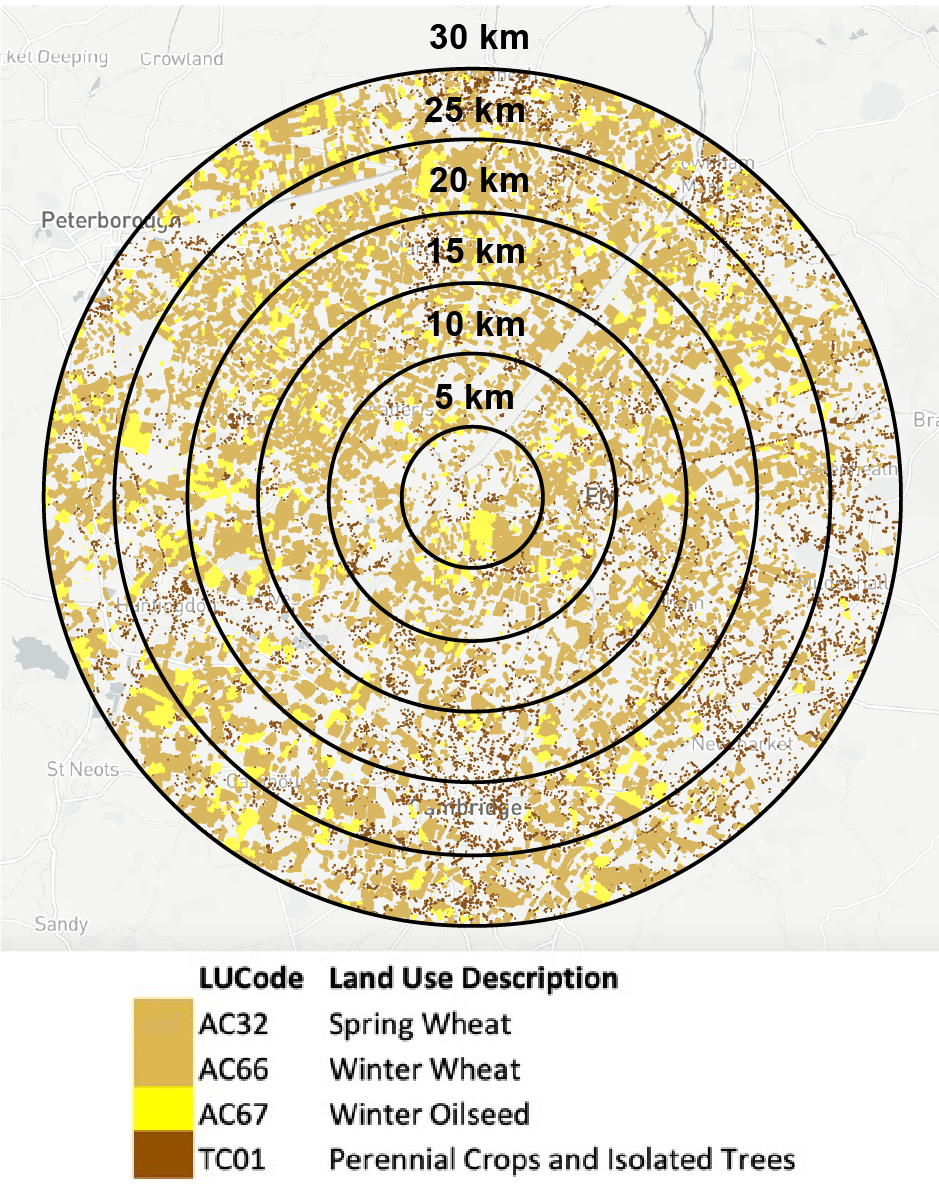
Figure 8. The results from a geospatial query of crops grown in the vicinity of Elean Power Station. The query was restricted to the types of crops (wheat, miscanthus, and oilseed) that can be used by the power station.
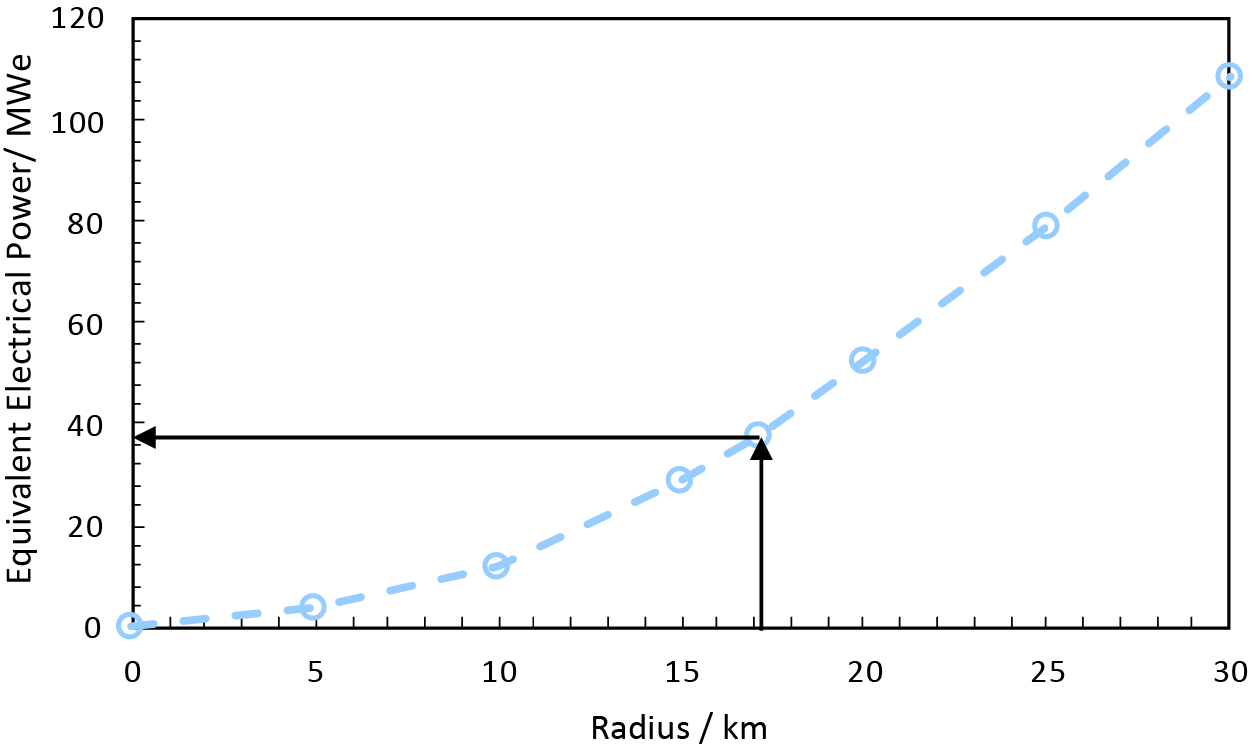
Figure 9. Estimated electrical power that could be generated using all the wheat, miscanthus, and oilseed crops grown within a given radius of Elean Power Station. The points show calculated values, the line serves as a guide to the eye.
Careful consideration must be employed when making decisions concerning land use and biomass resources. The total land area associated with the crops required for Elean Power Station to generate 38 MWe is approximately 300 km2. If this land was instead used to produce food or used for other types of renewables, it is estimated that it would be sufficient to grow food for approximately 60,000 people, generate approximately 300 MWe using wind power (Berners-Lee, Reference Berners-Lee2019) or 1,020 MWe using solar photovoltaics (Berners-Lee, Reference Berners-Lee2019; Global Solar Atlas, 2021; Statista, 2021a). This glosses over many other important considerations including the fact that solar and wind power are intermittent, and that bioenergy with carbon capture and storage can produce negative emissions. Nevertheless, these numbers highlight the “premium” associated with using land to grow crops for bioenergy.
Future developments of digital twin will extend the knowledge graph to include solar, wind, and population data, and will seek to automate this type of analysis using computational agents. It will also seek to link to ontologies that enable biodiversity to be considered in the assessments and to generalize the natural language capability of the knowledge graph (see Zhou et al., Reference Zhou, Nurkowski, Mosbach, Akroyd and Kraft2021) to make it easier to search for and retrieve data.
4.4. Flood risk
The approach to developing digital twins demonstrated in this article provides a uniform method both to query and share heterogeneous data from different sectors. The data may be distributed, so held on different computer systems and published by different entities. The value of such data sharing has been recognized (National Infrastructure Commission, 2017) and resulted in the creation of a National Digital Twin programme in the UK (Centre for Digital Built Britain, 2018). The programme seeks to develop the digital infrastructure required for stakeholders to create a large-scale National Digital Twin that enables a data-centric approach to decision making.
Figure 10 shows an example of how such an approach could be used to support the cross-domain analysis of flood risk. The shaded regions show flood data (Environment Agency, 2021) that provide the best estimate of land areas that have 1 in 100 (1%) or greater chance of annual fluvial (river) flooding, or a 1 in 200 (0.5%) or greater chance of annual tidal (sea) flooding in the absence of flood defenses.
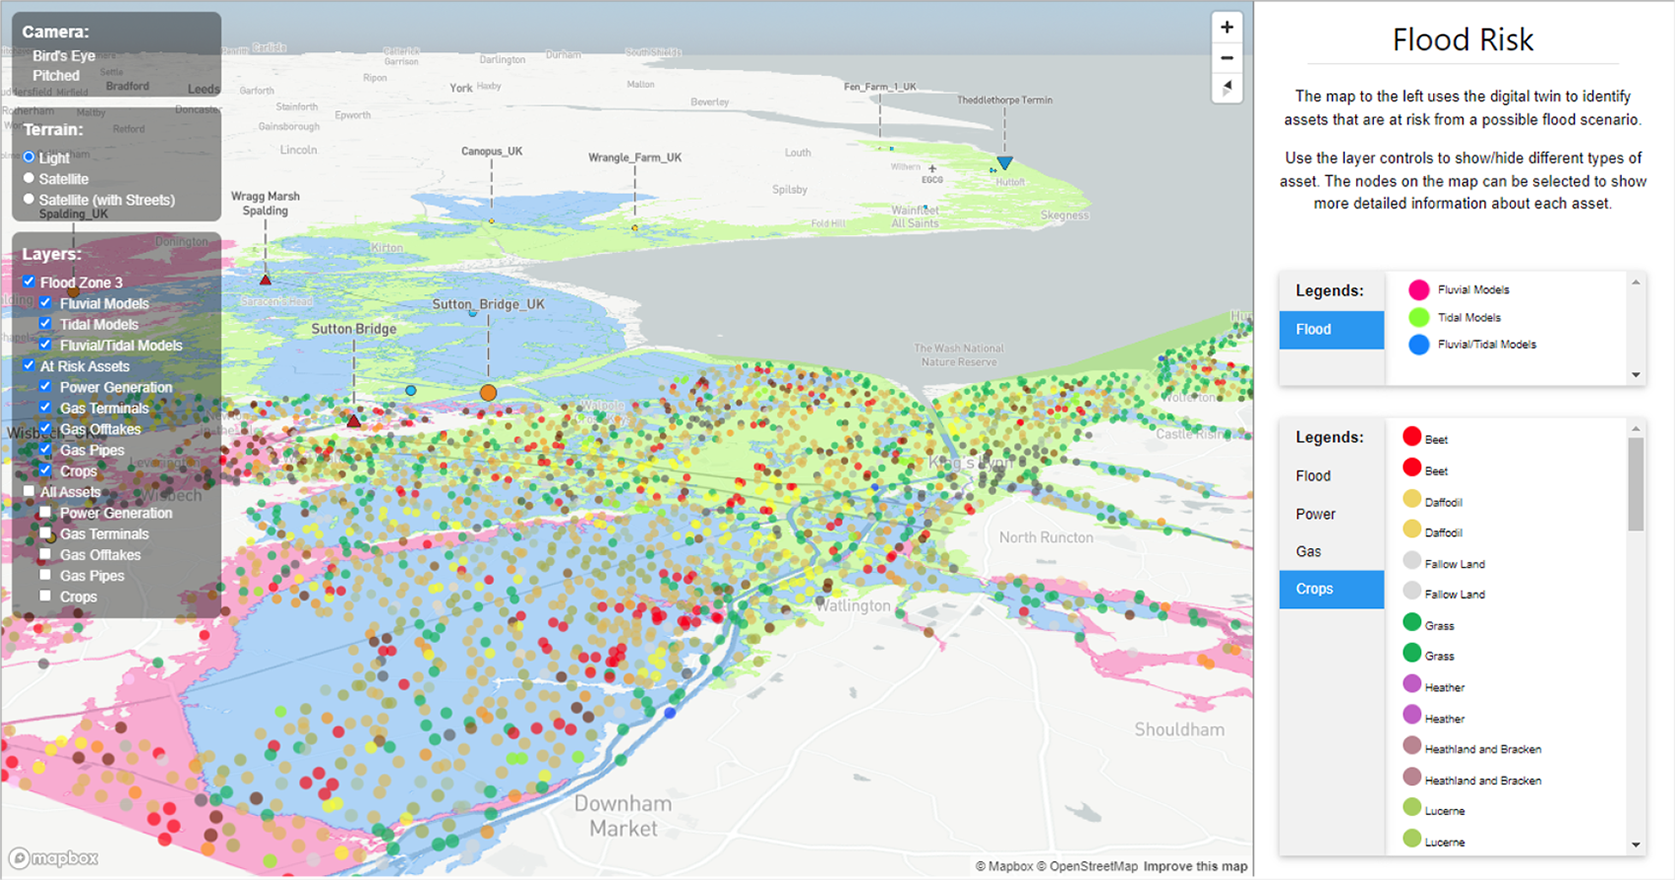
Figure 10. Crops at risk from flooding in the vicinity of King’s Lynn, UK. The flood region is based on the Flood Map for Planning (Rivers and Sea)—Flood Zone 3 (Environment Agency, 2021), which is the best estimate of land that in the absence of flood defenses has more than a 1 in 100 (1%) of flooding each year from rivers (a fluvial flood) or more than a 1 in 200 (0.5%) or greater chance of flooding each year from the sea (a tidal flood). Located at https://kg.cmclinnovations.com/explore/digital-twin/flood-risk. Flood Zone data: Environment Agency copyright and/or database right 2018. All rights reserved. Crown copyright and database rights 2018 Ordnance Survey 100024198.
The figure is overlaid by details of the crops grown within the Norfolk part of the flood region, in addition to data for the pipes, intakes, and offtakes to and from the national gas transmission system (Savage et al., Reference Savage, Akroyd, Mosbach, Krdzavac, Hillman and Kraft2022a) and power generation assets (Atherton et al., Reference Atherton, Xie, Aditya, Zhou, Karmakar, Akroyd, Mosbach, Lim and Kraft2021), queried from the knowledge graph. The data are identified using a combination of geospatial queries based on the methods described in Section 4.2 and spatial analysis using geopandas (Jordahl et al., Reference Jordahl, den Bossche, Fleischmann, Wasserman, McBride, Gerard, Tratner, Perry, Badaracco, Farmer, Hjelle, Snow, Cochran, Gillies, Culbertson, Bartos, Eubank, Bilogur, Rey, Ren, Arribas-Bel, Wasser, Wolf, Journois, Wilson, Greenhall, Holdgraf and Leblanc2020) to identify the assets within the flood zone. It is apparent that significant agricultural land and infrastructure would be affected by a flood and is potentially at risk. The next questions to ask are, what is the vulnerability of critical infrastructure to a flood and what would be the cascade of consequences? Would the loss of power cause the loss of other critical infrastructure? What would be the social and economic cost of the loss of crops? How could we increase resilience?
The developments in this article contribute to the ability to create large-scale digital twins that combine data about the built and natural environments to support holistic data-centric analyses. The ability to incorporate real-time data feeds, for example describing the flow of gas into the national transmission system (Savage et al., Reference Savage, Akroyd, Mosbach, Krdzavac, Hillman and Kraft2022a), extends the possibility to include operational data and considerations in the analyses. Likewise, the ability to include socioeconomic data extends the possibility to include social considerations, for example to analyze how policy changes toward domestic heating might affect the household energy costs and fuel poverty (Savage et al., Reference Savage, Akroyd, Mosbach, Hillman, Sielker and Kraft2022b). These capabilities demonstrate the potential of the Universal Digital Twin to break down data silos and cross-domain borders.
5. Conclusions
A set of ontologies has been developed to allow a geospatial description of land use to be incorporated into a dynamic-knowledge-graph-based Universal Digital Twin. The benefit of this strategy has been demonstrated through a cross-domain use case that shows an example of how such a knowledge graph could be used to support decision making about how to balance the use of land resources to meet increasing demand for energy whilst cutting emissions.
Resources that provide data about land coverage and biomass, and existing ontologies that describe these subject domains were critically examined. The Crop Map of England (CROME) published by the UK Government was found to provide a detailed geospatial description of land use in England. The data are updated annually and are available under an Open Government Licence in a choice of machine-readable formats. However, no ontologies capable of describing the data were found.
Three new ontologies were developed to support a geospatial description of land use.
-
1. OntoLandUse provides an ontology to describe land use classification based on the use of alphanumeric land use codes alongside natural language descriptions of the land use (the socioeconomic function of the land) and land cover (the observed to coverage of the land). The ontology is structured to allow the description of land use codes from multiple countries and regions, and was instantiated to represent all the land use codes used by the UK Government.
-
2. OntoCropMapGML provides a definition of the terminology required to provide a geospatial description of land use. It was instantiated to represent the full CROME data set, providing a geospatial description of land use across the whole of England.
-
3. OntoCropEnergy was developed to define the minimum terminology required to allow land use to be related to the yield (mass productivity per unit area) and calorific value (energy content per unit mass) of the biomass made available by the land. It was instantiated to provide data for 33 crops.
Ontologies for a subset of the instantiated data were deployed in a knowledge graph that is hosted using an instance of the Blazegraph graph database (https://kg.cmclinnovations.com/blazegraph_geo). The deployed data consist of approximately 33 million RDF triples and describe the land use in the counties of Cambridgeshire, Norfolk, and Suffolk in South East England. The native geospatial capability of Blazegraph is limited to point-wise data. The geospatial capability of Blazegraph was extended by integrating a custom vocabulary to allow the semantic representation of the boundaries of the hexagonal cells used to discretize the geospatial description of land use in the CROME data. The extended geospatial capability of Blazegraph was critically assessed. The custom geospatial queries could only be formulated in terms of a single custom data type. This was not an issue for the CROME data (because the features of interest were uniformly hexagonal), but will clearly be limiting in other cases.
The capability of the Universal Digital Twin has been demonstrated in two illustrative cross-domain use cases. The first use case concerned a bioenergy plant in Cambridgeshire. The use case combined information in the knowledge graph about UK power plants with a geospatial analysis of land use to estimate the minimum land required to provide enough biomass to operate the bioenergy plant. It is trivial for this type of analysis to be performed for any region described in the knowledge graph (in this case anywhere in England). Comparisons with alternative uses for the land highlighted the complexities and trade-offs that will be required when making decisions about the best way to use land to meet our future energy needs whilst achieving net zero. The second use case illustrated how the Universal Digital Twin could combine data about the built and natural environments to support the analysis of flood risk, demonstrating the potential of the Universal Digital Twin to cross data silos and domain borders.
Opportunities for future work to expand the data coverage and capabilities of the digital twin have been identified. Potential improvements to OntoCropEnergy have been highlighted, with a view to enabling the digital twin to take into account more detailed data about the factors influencing the yield and energy content of biomass. Potential improvements to how to encode geospatial data have been discussed.
Nomenclature
- ABox
-
Assertional Component (of an ontology)
- API
-
Application Programming Interface
- BECCS
-
Bioenergy with Carbon Capture and Storage
- CCS
-
Carbon Capture and Storage
- CROME
-
Crop Map of England
- CSV
-
Comma Separated Variable
- DL
-
Description Logic
- DUKES
-
Digest of UK Energy Statistics
- ENVO
-
Environmental Ontology
- FAO
-
Food and Agriculture Organization of the United Nations
- FC
-
Forestry Commission
- FCA
-
Forestry Contracting Association
- GeoJSON
-
Geospatial JavaScript Object Notation
- GeoSPARQL
-
Geographic Query Language for RDF Data
- GML
-
Geography Markup Language
- IRI
-
Internationalized Resource Identifier
- LUCode
-
Land Use Code
- OGC
-
Open Geospatial Consortium
- ONS
-
Office for National Statistics
- OWL
-
Web Ontology Language
- RDF
-
Resource Description Framework
- RPA
-
Rural Payments Agency
- SPARQL
-
SPARQL Protocol and RDF Query Language
- TBox
-
Terminological Component (of an ontology)
- W3C
-
World Wide Web Consortium
Acknowledgment
M.K. gratefully acknowledges the support of the Alexander von Humboldt Foundation.
Supplementary Materials
To view supplementary material for this article, please visit http://doi.org/10.1017/dce.2021.21.
Data Availability Statement
Research data supporting this publication are openly available in the University of Cambridge data repository (doi:10.17863/CAM.68278).
Author Contributions
Conceptualization: J.A., A.B., S.M., M.K.; Data curation: Z.H., D.S., F.F., S.M.; Formal analysis: J.A., Z.H., D.S., F.F., S.M., M.K.; Funding acquisition: J.A., A.B., S.M., M.K.; Investigation: J.A., Z.H., D.S., F.F., S.M., M.K.; Methodology: J.A., Z.H., D.S., F.F., S.M., M.K.; Project administration: J.A., S.M.; Resources: J.A., S.M.; Software: J.A., Z.H., D.S., F.F., S.M.; Supervision: J.A., F.F., S.M., M.K.; Validation: J.A., Z.H., D.S., F.F.; Visualization: J.A., Z.H., D.S., F.F.; Writing—original draft: Z.H., D.S.; Writing—review and editing: J.A., F.F., A.B., S.M., M.K. All authors approved the final submitted draft.
Funding Statement
This research was supported by the National Research Foundation, Prime Minister’s Office, Singapore under its Campus for Research Excellence and Technological Enterprise (CREATE) programme. Part of the research was also funded by the European Commission, Horizon 2020 Programme, DOME 4.0 Project, GA 953163. The funders had no role in study design, data collection and analysis, decision to publish, or preparation of the manuscript. Part of this work was supported by Towards Turing 2.0 under the EPSRC Grant EP/W037211/1 & The Alan Turing Institute.
Competing Interests
The authors declare no competing interests exist.


 Open access
Comments
No Comments have been published for this article.