


Impact Statement
The concept and technologies for creating a digital twin for ship structures (DTSS) were developed. Structural performances such as deformation, stress, and cumulative fatigue damage over the whole ship structure can be reproduced by hull monitoring using a limited number of sensors and data assimilation. The primary aim of DTSS is to reduce uncertainties in the structural integrity assessment of ships in operation and establish a more optimal design, construction, and operation framework for the maritime industry. In addition to reproducing structural performances, methods for predicting extreme responses in harsh environments and long-term cumulative fatigue damage over the ship service period were developed for decision support for navigation and maintenance. Several utilization scenarios for DTSS in the maritime industry were proposed. DTSS can predict wave states as well as structural responses, and thus has the potential to reproduce any ship performance in waves, including ship motions, cargo responses, and so forth.
1. Introduction
With the rapid progress of technologies such as IoT, AI and big data, there are growing expectations for digital transformation (DX) in the maritime industry, as represented by autonomous ships, smart shipbuilding, and remote inspection and maintenance. The project on the digital twin for ship structures (DTSS) is one such challenge for realizing maritime DX in the near future. A digital twin (DT) is a virtual representation of a physical object in cyber space, incorporating monitoring, data analysis, and physical simulation. The performance of the object in cyber space is fed back to physical space for decision support or improvement. DTs are useful for any stage of a ship’s lifetime, from design, construction, and operation to recycling and disposal, but among these, the DTSS project focuses on reproducing ship structural performances in operation.
Many uncertainties exist in the structural integrity assessment of ships; namely, physical uncertainties regarding material properties, waves, and so forth, statistical uncertainties due to lack of data, modeling uncertainties in formulation and simulation, and operational uncertainties in decisions and actions. In particular, operational uncertainties are significantly large and are also difficult to quantify. Even though sea state data are available through wave forecast or hindcast, real encountered waves and structural loads are strongly influenced by ship operation, such as the ship’s speed and heading. By applying a DT, it is possible to obtain the real state of ship structures in operation. This reduces uncertainties in load and strength estimates, leading to improved structural integrity assessments and more optimal design, operation, and maintenance. A DT can also provide a platform for exchanging and updating information among stakeholders through data, which enhances a rational and rapid process of updating design and operational criteria based on a common understanding.
Motivated by these considerations, the Japan Ship Technology Research Association (JSTRA) conducted a 4-year R&D project for the DT for ship structures with the support of The Nippon Foundation. Twenty-one organizations participated in the project, including shipyards, shipping companies, sensor/device companies, universities, research institute, and classification society. The project comprised two phases. Phase-1 (2018–2019), aimed at developing the DTSS concept and base element technologies, and Phase-2 (2020–2021), targeting the development of the DTSS system and its application to model and full-scale ship tests for validation. Among many uncertainties associated with ship structural integrity assessments, the project focused on mitigating the uncertainties in the evaluation of wave loads and responses by applying hull monitoring, data analysis and simulation in an integrated manner.
Hull monitoring of ships is already in use. For instance, Decò and Frangopol (Reference Decò and Frangopol2015) developed a risk-informed approach for ship structures that integrates structural health monitoring information, and applied it to real-time optimal routing of ships. Storhaug and Hareide (Reference Storhaug, Hareide, Okada, Suzuki and Kawamura2021) conducted hull monitoring of four container vessels with a capacity of about 20,000 TEU (twenty-foot equivalent unit) and discussed the use of monitoring data for decision support related to maintenance, inspection, and seamanship. Although these previous studies only considered the stresses and associated internal load effects at the measurement locations, in structural safety assessments of ships, it is very important to grasp the hull stress responses over the whole hull structure. To reproduce hull stress responses which are not measured, the so-called data assimilation technique, which merges monitoring and numerical simulation, is indispensable. In addition, the aim of DTSS is not only to know the response but also to utilize the response for decision support. Considering the many uncertainties in ship structural integrity assessments, statistical approaches are essential. From these viewpoints, the project defined three key areas for technical development: monitoring, data assimilation, and prediction. Furthermore, utilization scenarios for DTSS were also discussed.
This paper presents the outline of the 4-year DTSS project. The concept of the DTSS system is first explained, followed by the major technical achievements with regard to monitoring, data assimilation and prediction, development of the DT system i-SAS and validation through model and full-scale measurements. Finally, utilization scenarios in the maritime industry are discussed, together with future research needs.
2. Concept of DTSS
Figure 1 shows the concept of the DT system for ship structures (Fujikubo, Reference Fujikubo2019). A DT ship is constructed and maintained in cyber space, and is updated by actual monitoring/inspection data and environmental data, which in combination contribute to comprehensive structural integrity assessment. The assessment phase includes real-time assessment, for example, an alert system for harsh environments, and short-term and long-term response predictions to evaluate extreme responses and cumulative fatigue damage in a statistical manner. All of these are utilized for decision support for navigation and maintenance, and further, for feedback to design and design rules. The DT ship is typically represented by a 3D-shell finite element (FE) model, but can be a beam, a beam-shell combination or other appropriate representations, depending on the application.
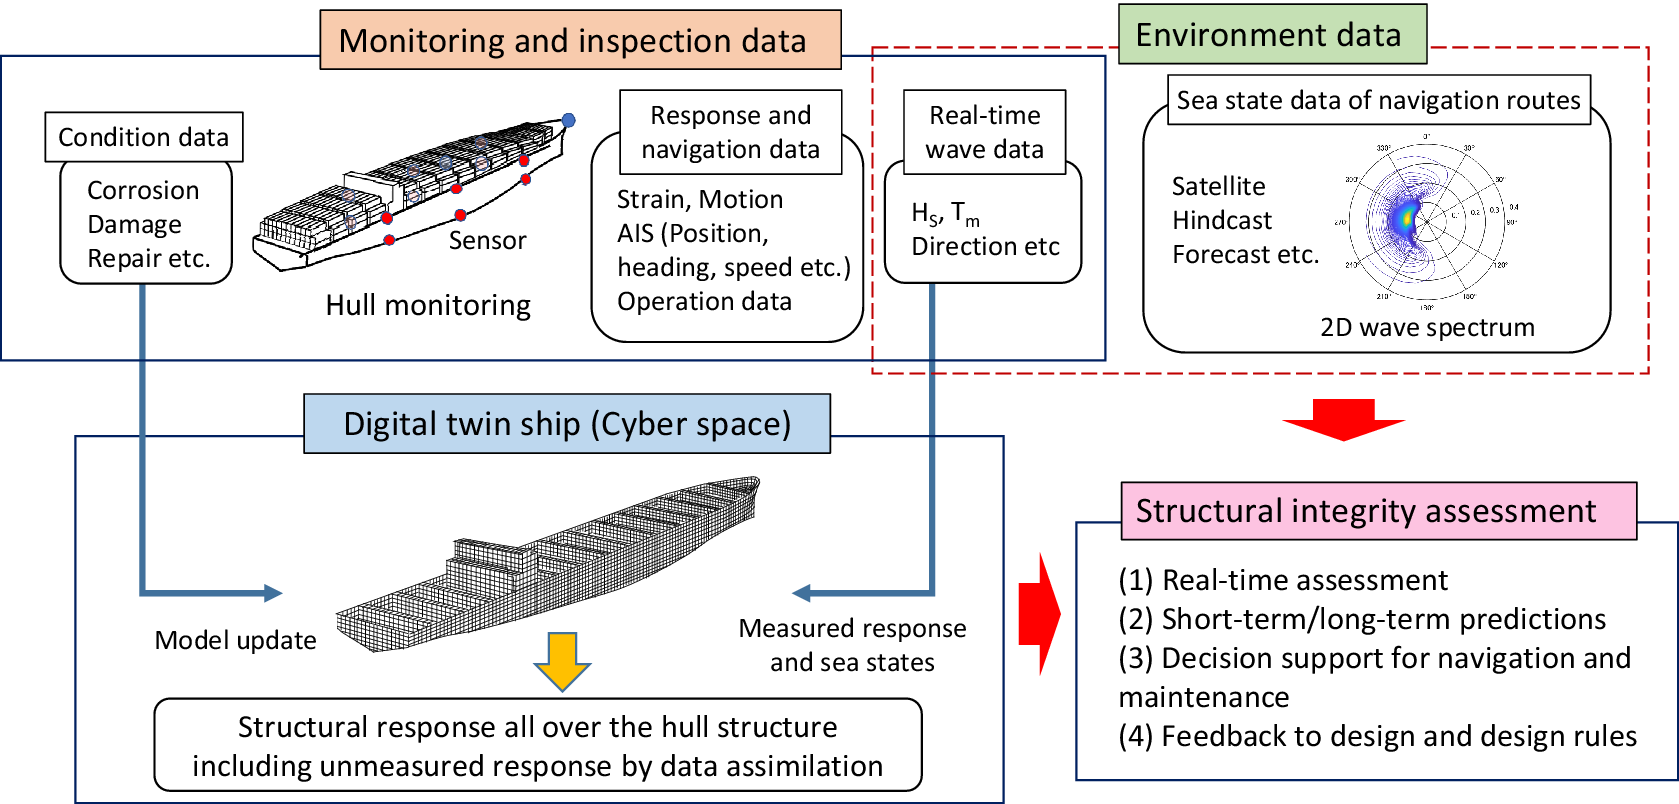
Figure 1. Concept of digital twin system for ship structure.
One of the essential elements for realizing the DT for ship structures is a data assimilation technique, as already mentioned. While it is essential that the stress histories at some thousands of structural details can be accurately estimated, it is not possible to measure the stresses at so many points considering the installation and maintenance costs of the sensors. It is therefore necessary to establish a method for estimating the stresses where no sensors are located from the measured stresses acquired by a limited number of sensors. Several data assimilation methods were examined to meet this challenge.
3. Major technical achievements of DTSS project
3.1. Hull monitoring
The starting point of the DTSS system is the sensors for strain, acceleration, pressure, temperature, and so forth. Their output accuracy and stability, durability, and installation and maintenance costs need to be considered in the hull monitoring design. We applied several hull monitoring systems (HMSs) in the model and full-scale tests. In the wave tank test, which was conducted to validate the data assimilation methods (Figure 2(a)), strain, pressure, and acceleration were measured using fiber bragg grating (FBG) sensors. The strains and pressures on the ship model were measured by 141 and 150 FBG sensors, respectively, and two FBG interrogators were used to acquire all strain and pressure data simultaneously. The quasi-distributed sensing technology with FBG sensors and interrogators made it possible to reduce the number of cables between the ship model and the measurement system and improve the test procedure.
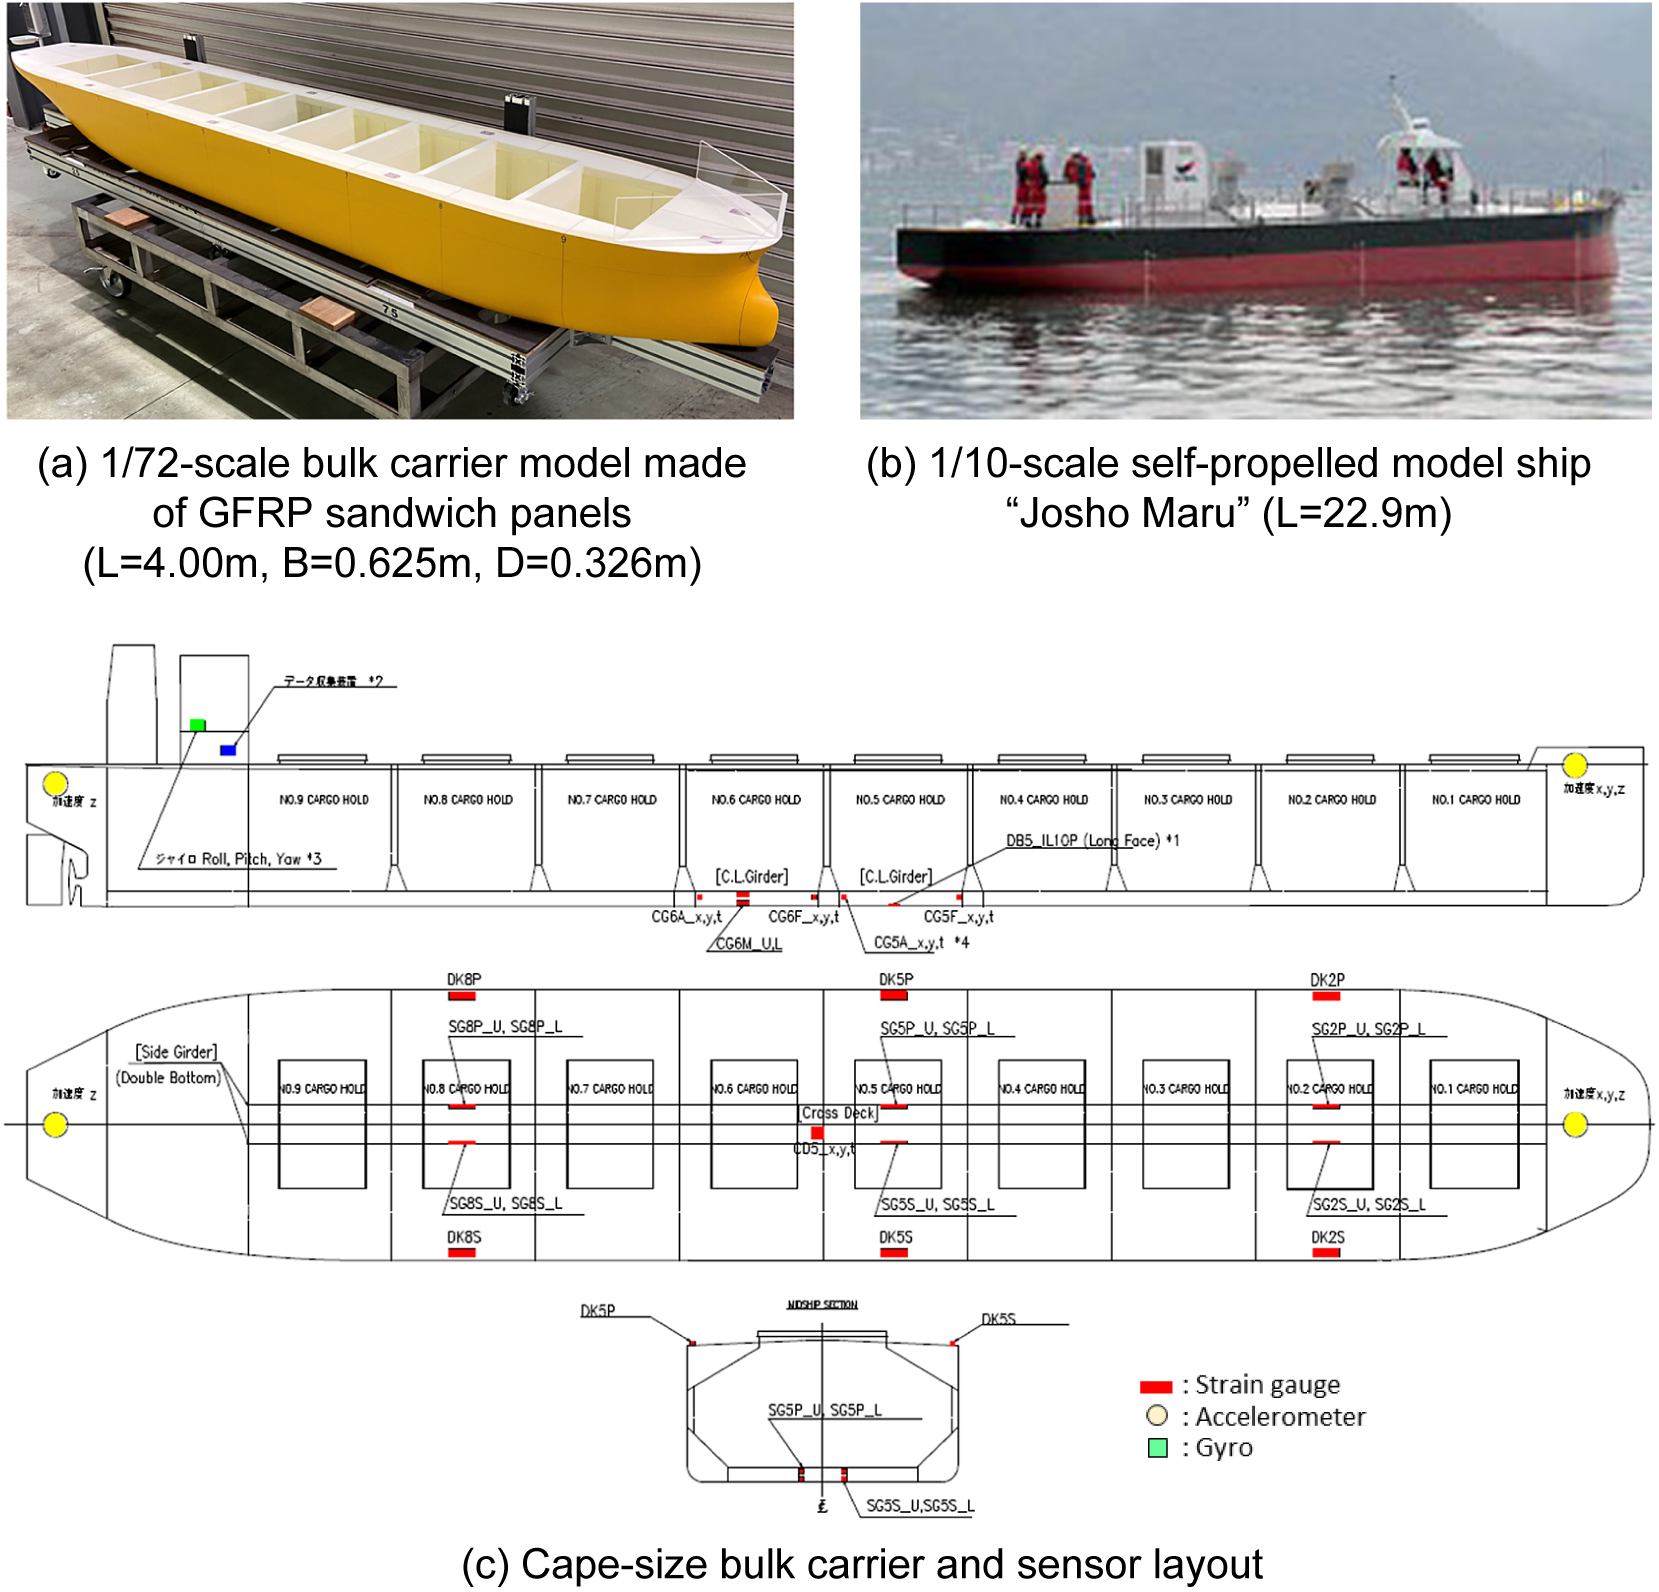
Figure 2. Ships used for hull monitoring in model and actual sea tests.
In the actual sea test using the 1/10-scale self-propelled model ship “Josho Maru” (Figure 2(b)), we installed both FBG sensors and conventional foil strain-gauge sensors provided by multiple manufacturers, and verified the stability of the sensor output, the degree of matching of the output from the different sensors, and the sensor temperature compensation performance. In this test, we also succeeded in remote communication and monitoring during actual sea navigation.
A full-scale measurement was conducted on a Capesize bulk carrier using the conventional foil strain gauges, and also on an ore carrier using the FBG sensors. Figure 2(c) shows the sensor layout for the Capesize bulk carrier, in which the sensors were installed so that double-bottom bending deformation could be measured in addition to global hull girder bending and torsional deformation. Although these measurements are on-going, some results obtained for the Capesize bulk carrier will be presented in Section 3.6.
3.2. Numerical simulation of wave response
To implement DTSS, a wave response analysis needs to be performed beforehand to obtain the transfer function or response amplitude operator (RAO) of the responses, which are either measured by the hull monitoring sensors or estimated by data assimilation. For this, a series of response analyses for regular waves with different periods and directions is required. In the DTSS project, the program for direct load and structure analysis (DLSA) developed by the National Maritime Research Institute (NMRI) was used as the base simulation program for the wave response analysis. Details of the DLSA are given in Matsui et al. (Reference Matsui, Murakami and Oka2019).
To validate the DLSA program and data assimilation using the DLSA, a wave tank test was performed at the actual sea model basin in NMRI using the 1/72-scale bulk carrier model shown in Figure 2(a). This model is an elastically deformable hydro-structural model made of glass fiber reinforced plastics (GFRP) sandwich panels so that the strains on the hull can be measured and the similarity of the local double bottom deformation to that of the target full-scale ship can be taken into account (Houtani et al., Reference Houtani, Mikami, Komoriyama, Chen, Miyake, Tatsumi, Kuroda, Okada, Iijima, Murayama and Oka2022, Reference Houtani, Mikami, Komoriyama, Oka and Murayama2023). For the analysis, the hull structure was modeled by 3D-shell elements.
3.3. Data assimilation
Three different methods of data assimilation, as shown in Figure 3, were applied to reconstruct the structural response over the whole ship structure from a limited number of sensors. They are herein called the wave spectrum method, Kalman filter (KF) method and inverse finite element method (iFEM).
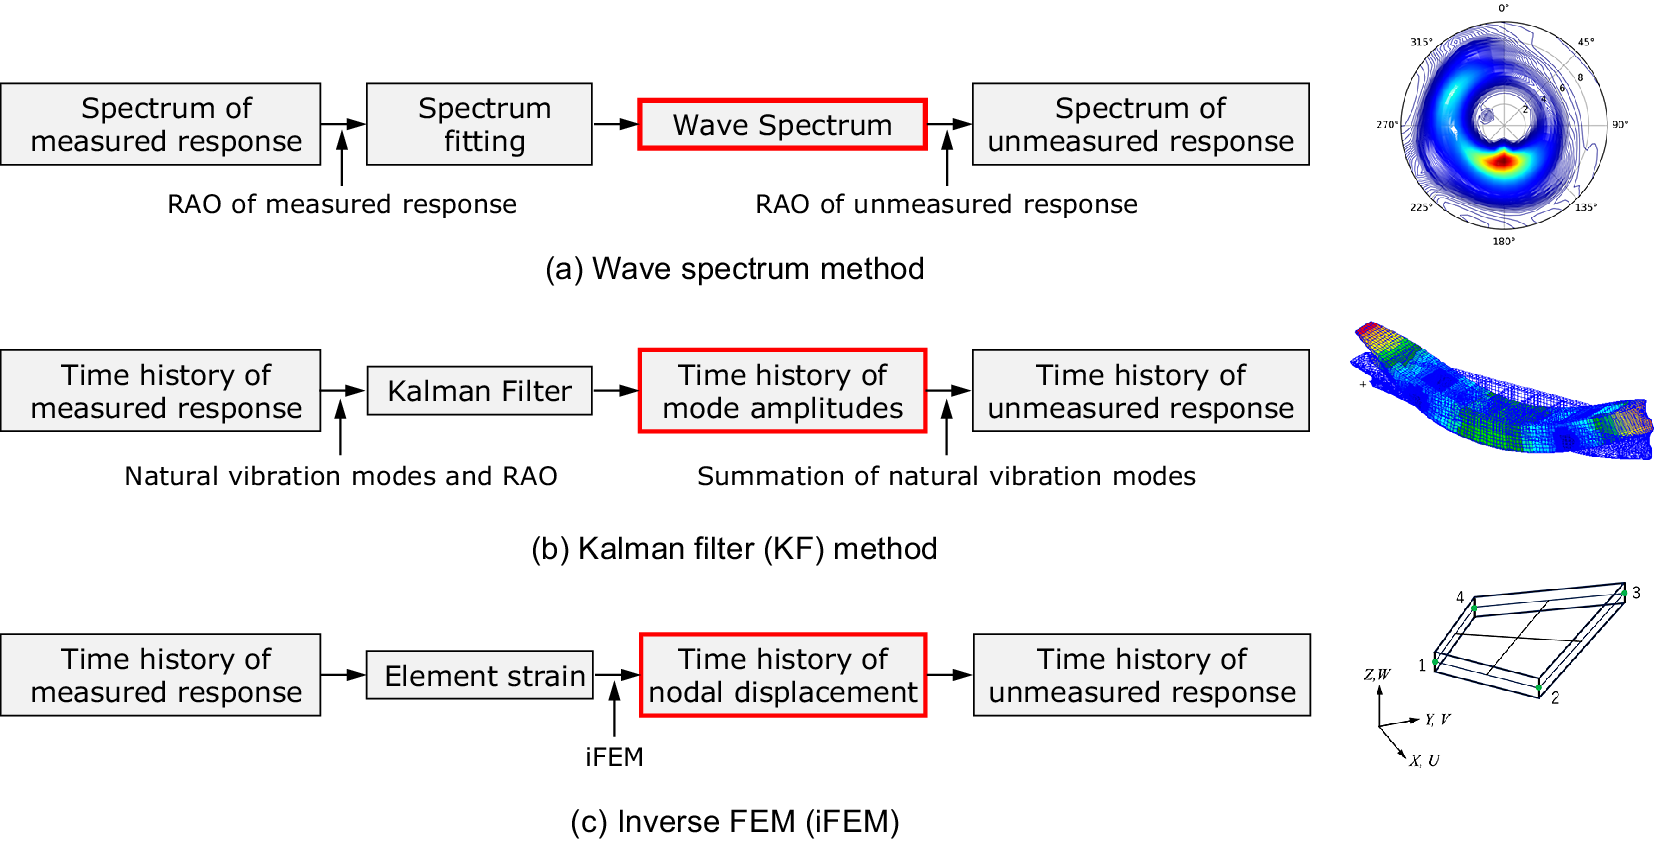
Figure 3. Data assimilation methods.
3.3.1. Wave spectrum method
This method estimates the wave spectrum of the encountered short-term sea state from the measured ship responses and associated linear transfer functions. Once the wave spectrum is identified, the spectrum of the unmeasured responses at any location in the ship structure can be estimated (Figure 3(a)). Several studies on sea-state estimation from measured ship responses have already been proposed. Iseki and Ohtsu (Reference Iseki and Ohtsu2000) developed a Bayesian modeling procedure to estimate directional wave spectra based on ship motion data. Nielsen (Reference Nielsen2006) compared the Bayesian method and the so-called parametric method and discussed their applicability. In the former method, the directional wave spectrum is estimated at a number of discretized points of the wave field, while in the latter, the wave field is expressed by the summation of a number of parameterized wave spectra.
In these previous studies, ship motions such as heave, pitch, and roll were primarily used as the measured responses. However, for a large ship like a large container ship, the ship motions caused by high frequency waves are relatively small, while the hydro-elastic structural response becomes more significant. From this viewpoint, Chen et al. (Reference Chen, Okada and Kawamura2018) proposed a new parametric method using the longitudinal hull girder bending stresses as one of the measured inputs, and showed that the wave spectrum could be predicted more accurately by this method. Chen et al. (Reference Chen, Okada, Kawamura and Mitsuyuki2021) further extended this method so that the multi-peaked directional wave spectrum could be estimated. In this DTSS project, the wave spectrum was discretized into 36 directions, as shown in Figure 4, and the Ochi–Hubble’s six-parameter spectrum $ {S}^{(q)}\left(\omega \right) $
given in equation (1) was applied to each direction.
$ {S}^{(q)}\left(\omega \right) $
given in equation (1) was applied to each direction. $ \omega $
is the wave circular frequency, and
$ \omega $
is the wave circular frequency, and $ \chi $
is the relative angle between the ship course and wave direction. The subscript
$ \chi $
is the relative angle between the ship course and wave direction. The subscript $ j\;\left(=1,2\right) $
in
$ j\;\left(=1,2\right) $
in $ {S}^{(q)}\left(\omega \right) $
represents the case when bimodal directional waves are considered, as will be explained in Section 3.3.4. The spectrum parameters,
$ {S}^{(q)}\left(\omega \right) $
represents the case when bimodal directional waves are considered, as will be explained in Section 3.3.4. The spectrum parameters, $ {T}_j^{(q)},{H}_j^{(q)},{\lambda}_j^{(q)} $
, were determined so that the squared difference between the measured and estimated response spectra
$ {T}_j^{(q)},{H}_j^{(q)},{\lambda}_j^{(q)} $
, were determined so that the squared difference between the measured and estimated response spectra $ {R}_{mn}\left(\omega \right) $
could be minimized by using GA:
$ {R}_{mn}\left(\omega \right) $
could be minimized by using GA:
 $$ {R}_{mn}\left(\omega \right)={\int}_{-\pi}^{\pi }{\left[{A}_m\left(\omega, \chi +\theta \right)\right]\left[{A}_n\left(\omega, \chi +\theta \right)\right]}^{\ast}\times S\left(\omega, \theta \right) d\theta, $$
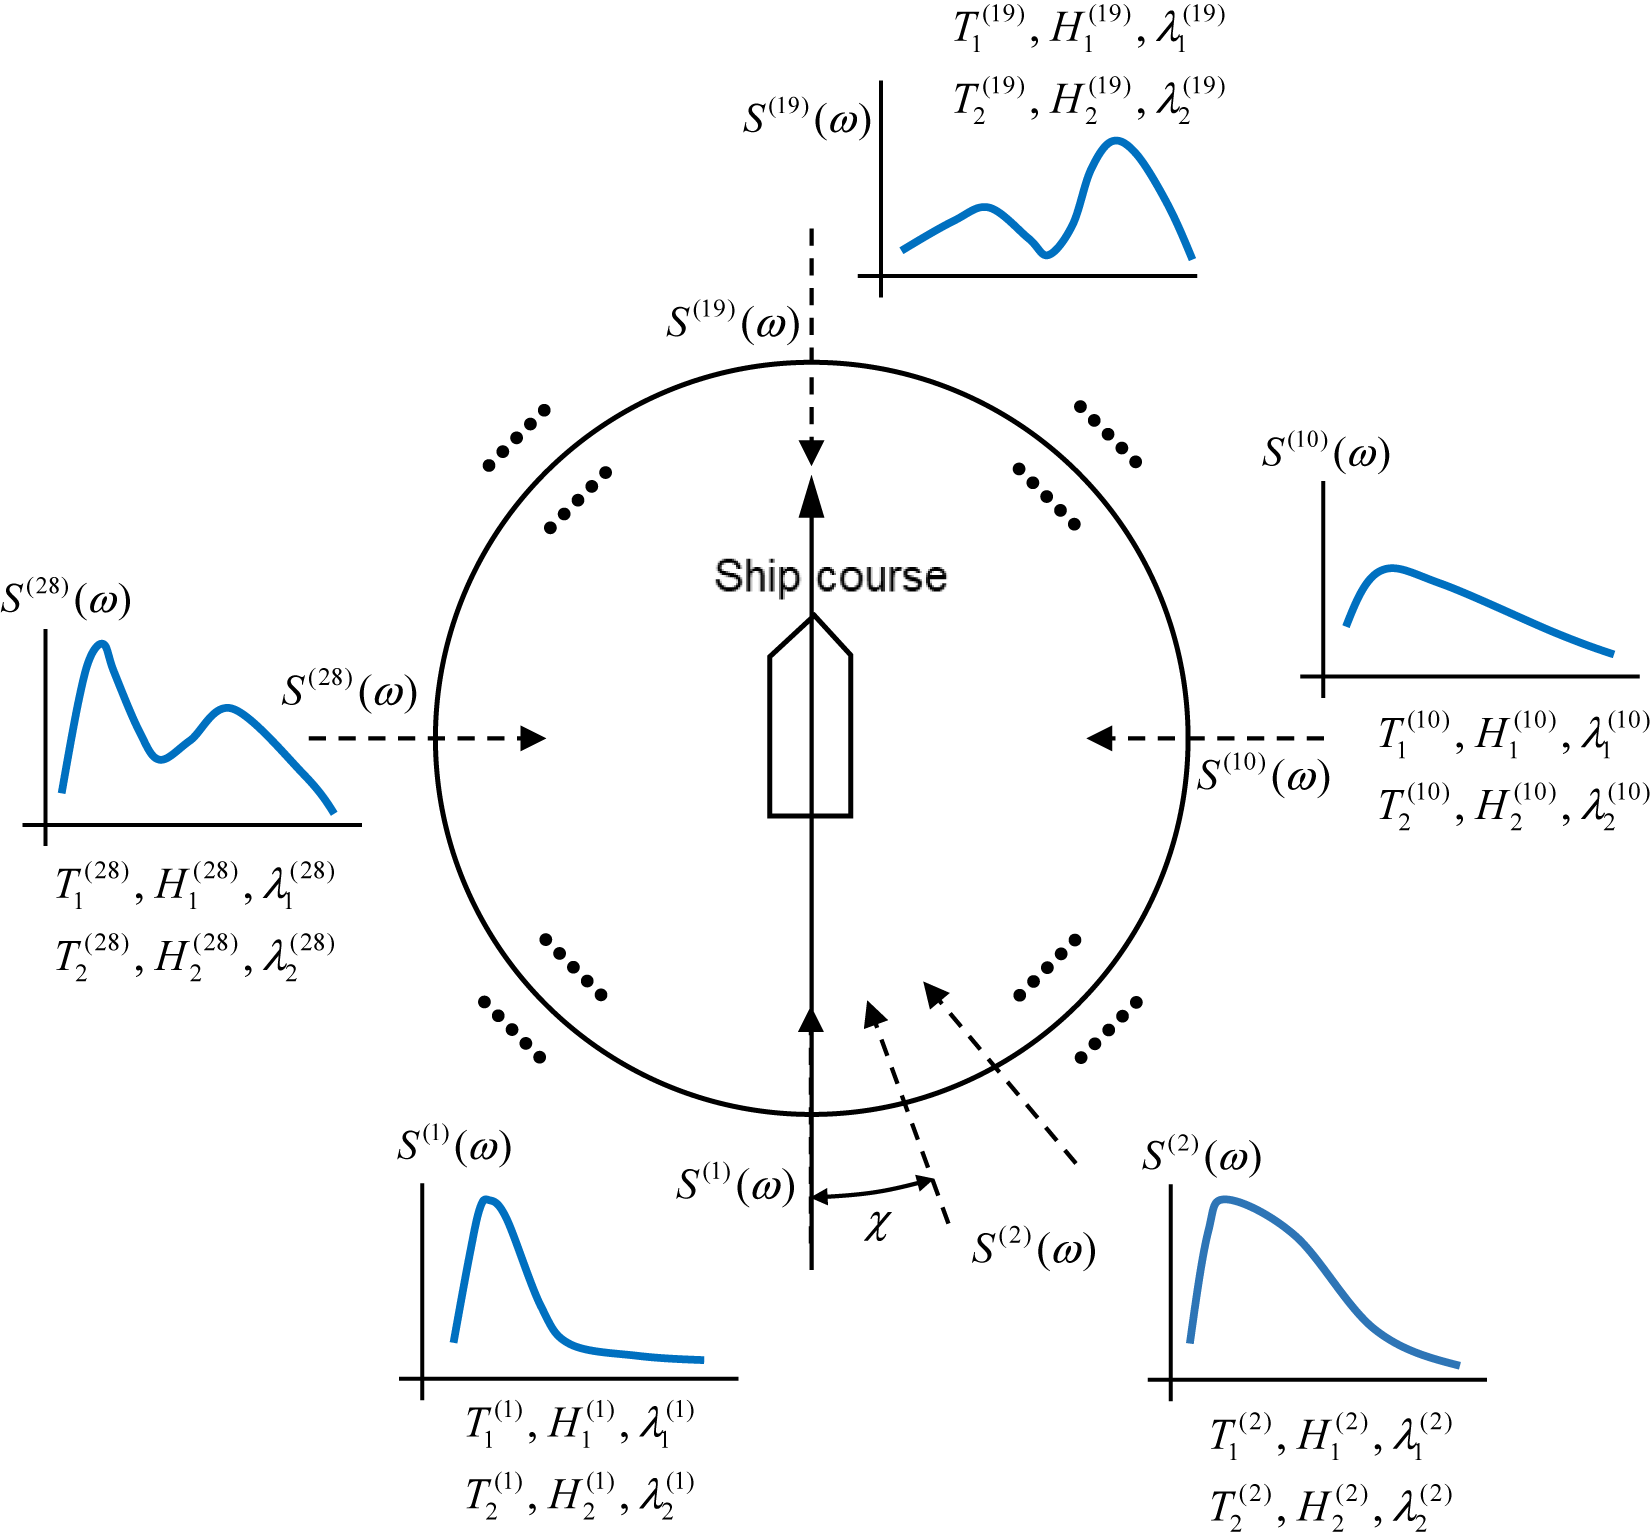
Figure 4. Image of assumed directional wave spectrum.
where $ {A}_m\left(\omega, \chi +\theta \right) $
: RAO of the mth response variable,
$ {A}_m\left(\omega, \chi +\theta \right) $
: RAO of the mth response variable, $ S\left(\omega, \theta \right)={S}^{(q)}\left(\omega \right) $
: (q = 1, …, 36; Discrete variables for wave direction),
$ S\left(\omega, \theta \right)={S}^{(q)}\left(\omega \right) $
: (q = 1, …, 36; Discrete variables for wave direction),
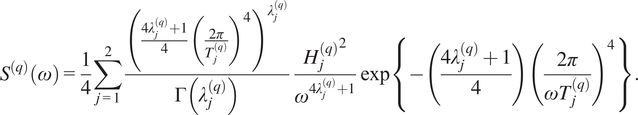 $$ {S}^{(q)}\left(\omega \right)=\frac{1}{4}\sum_{j=1}^2\frac{{\left(\frac{4{\lambda}_j^{(q)}+1}{4}{\left(\frac{2\pi }{T_j^{(q)}}\right)}^4\right)}^{\lambda_j^{(q)}}}{\Gamma \left({\lambda}_j^{(q)}\right)}\frac{{H_j^{(q)}}^2}{\omega^{4{\lambda}_j^{(q)}+1}}\exp \left\{-\left(\frac{4{\lambda}_j^{(q)}+1}{4}\right){\left(\frac{2\pi }{\omega {T}_j^{(q)}}\right)}^4\right\}. $$
3.3.2. Kalman filter (KF) method
The KF method is widely used for response prediction and control of dynamic systems, such as robots and vehicles, based on observation data. Miyake et al. (Reference Miyake, Iijima, Tatsumi and Fujikubo2023) applied the KF method to data assimilation in DTSS to predict the real-time response of a ship hull structure using the real-time measured strains (Figure 3(b)). The basic idea is to represent the deformation of a whole ship by a linear summation of the natural vibration modes. The equation of motion considering the elastic vibrations as well as rigid-body motions can be expressed as
 $$ {\displaystyle \begin{array}{c}\boldsymbol{M}\ddot{\boldsymbol{q}}+\boldsymbol{C}\dot{\boldsymbol{q}}+\boldsymbol{Kq}=\boldsymbol{F},\end{array}} $$
where $ \boldsymbol{q} $
,
$ \boldsymbol{q} $
, $ \dot{\boldsymbol{q}} $
, and
$ \dot{\boldsymbol{q}} $
, and $ \ddot{\boldsymbol{q}} $
are modal displacement, velocity, and acceleration vectors, respectively, and
$ \ddot{\boldsymbol{q}} $
are modal displacement, velocity, and acceleration vectors, respectively, and $ \boldsymbol{M},\boldsymbol{C},\boldsymbol{K} $
and
$ \boldsymbol{M},\boldsymbol{C},\boldsymbol{K} $
and $ \boldsymbol{F} $
are modal mass, damping, and stiffness matrices and the modal exciting force vector, respectively. Equation (2) can be discretized in time as
$ \boldsymbol{F} $
are modal mass, damping, and stiffness matrices and the modal exciting force vector, respectively. Equation (2) can be discretized in time as
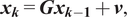 $$ {\displaystyle \begin{array}{c}{\boldsymbol{x}}_{\boldsymbol{k}}=\boldsymbol{G}{\boldsymbol{x}}_{\boldsymbol{k}-\mathbf{1}}+\boldsymbol{v},\end{array}} $$
where $ {\boldsymbol{x}}_{\boldsymbol{k}}={\left[{\boldsymbol{q}}_{\boldsymbol{k}},{\dot{\boldsymbol{q}}}_{\boldsymbol{k}},{\boldsymbol{F}}_{\boldsymbol{k}}\right]}^T $
is a state vector and
G
is a system matrix.
v
is a noise vector based on the assumption of the Gaussian process of loads and responses. On the other hand, the observation equation is given in the form
$ {\boldsymbol{x}}_{\boldsymbol{k}}={\left[{\boldsymbol{q}}_{\boldsymbol{k}},{\dot{\boldsymbol{q}}}_{\boldsymbol{k}},{\boldsymbol{F}}_{\boldsymbol{k}}\right]}^T $
is a state vector and
G
is a system matrix.
v
is a noise vector based on the assumption of the Gaussian process of loads and responses. On the other hand, the observation equation is given in the form
 $$ {\displaystyle \begin{array}{c}{\boldsymbol{z}}_{\boldsymbol{k}}=\boldsymbol{H}{\boldsymbol{x}}_{\boldsymbol{k}}+\boldsymbol{w},\end{array}} $$
where
H
is a matrix that relates the state vector $ {\boldsymbol{x}}_{\boldsymbol{k}} $
with the observation data
$ {\boldsymbol{x}}_{\boldsymbol{k}} $
with the observation data $ {\boldsymbol{z}}_{\boldsymbol{k}} $
, and
w
is a noise vector which follows a normal distribution. Using measured responses including strains as
$ {\boldsymbol{z}}_{\boldsymbol{k}} $
, and
w
is a noise vector which follows a normal distribution. Using measured responses including strains as $ {\boldsymbol{z}}_{\boldsymbol{k}} $
and applying the standard procedure of the KF, the time history of modal displacement
$ {\boldsymbol{z}}_{\boldsymbol{k}} $
and applying the standard procedure of the KF, the time history of modal displacement $ \boldsymbol{q} $
is obtained. Then, the time history of the structural responses at any location in the structure can be obtained by a linear summation of the modal vectors. Since the KF method gives a real-time response to the operator, it can be used, for example, in a real-time alert system in the extreme sea condition. Recently, Komoriyama et al. (Reference Komoriyama, Iijima, Tatsumi and Fujikubo2023) applied the KF method to prediction of real-time wave profiles using measured responses. This is expected to make it possible to predict not only structural responses but also any ship performance in waves, including cargo responses, added resistance, and so forth.
$ \boldsymbol{q} $
is obtained. Then, the time history of the structural responses at any location in the structure can be obtained by a linear summation of the modal vectors. Since the KF method gives a real-time response to the operator, it can be used, for example, in a real-time alert system in the extreme sea condition. Recently, Komoriyama et al. (Reference Komoriyama, Iijima, Tatsumi and Fujikubo2023) applied the KF method to prediction of real-time wave profiles using measured responses. This is expected to make it possible to predict not only structural responses but also any ship performance in waves, including cargo responses, added resistance, and so forth.
3.3.3. Inverse FEM (iFEM)
iFEM is an algorithm that reconstructs full-field structural displacements based on the strains at a limited number of finite elements as an inverse problem (Tessler and Spangler, Reference Tessler and Spangler2003). In FEM, the element strain $ {\boldsymbol{\varepsilon}}^{\boldsymbol{e}} $
is calculated from the nodal displacement
u
e
, whereas in iFEM, the nodal displacement
u
e
is inversely estimated from the element strain
$ {\boldsymbol{\varepsilon}}^{\boldsymbol{e}} $
is calculated from the nodal displacement
u
e
, whereas in iFEM, the nodal displacement
u
e
is inversely estimated from the element strain $ {\boldsymbol{\varepsilon}}^{\boldsymbol{e}} $
so as to satisfy the nodal displacement-element strain relationship:
$ {\boldsymbol{\varepsilon}}^{\boldsymbol{e}} $
so as to satisfy the nodal displacement-element strain relationship:
 $$ {\displaystyle \begin{array}{c}\boldsymbol{B}{\boldsymbol{u}}^{\boldsymbol{e}}={\boldsymbol{\varepsilon}}^{\boldsymbol{e}}\end{array}} $$
by solving the following minimization problem:
 $$ {\displaystyle \begin{array}{c}\operatorname{minimize}\hskip0.5em \Phi \left({\boldsymbol{u}}^{\boldsymbol{e}}\right)=\frac{1}{2}{\int}_{\Omega^e}{\left({\boldsymbol{Bu}}^{\boldsymbol{e}}-{\boldsymbol{\varepsilon}}^{\boldsymbol{e}}\right)}^T\left({\boldsymbol{Bu}}^{\boldsymbol{e}}-{\boldsymbol{\varepsilon}}^{\boldsymbol{e}}\right)d{\Omega}^e,\end{array}} $$
where B is the nodal displacement-element strain matrix of the element. From the condition that
 $$ {\displaystyle \begin{array}{c}\frac{\mathrm{\partial \Phi}\left({\boldsymbol{u}}^{\boldsymbol{e}}\right)}{{\partial \boldsymbol{u}}^{\boldsymbol{e}}}={\int}_{\Omega^e}\left({\boldsymbol{B}}^T\boldsymbol{B}{\boldsymbol{u}}^{\boldsymbol{e}}-{\boldsymbol{B}}^T{\boldsymbol{\varepsilon}}^{\boldsymbol{e}}\right)d{\Omega}^e=0,\end{array}} $$
we have
 $$ {\displaystyle \begin{array}{c}{\boldsymbol{K}}^{\boldsymbol{e}}{\boldsymbol{u}}^{\boldsymbol{e}}={\boldsymbol{F}}^{\boldsymbol{e}}\end{array}} $$
 $$ {\displaystyle \begin{array}{c}{\boldsymbol{K}}^{\boldsymbol{e}}={\int}_{\hskip-4pt {\Omega}^e}{\boldsymbol{B}}^T\boldsymbol{B}d{\Omega}^e,\hskip2pt {\boldsymbol{F}}^{\boldsymbol{e}}={\int}_{\hskip-4pt {\Omega}^e}{\boldsymbol{B}}^T{\boldsymbol{\varepsilon}}^{\boldsymbol{e}}d{\Omega}^e.\end{array}} $$
Using the measured strains as $ {\boldsymbol{\varepsilon}}^{\boldsymbol{e}} $
for the elements fitted with strain sensors, the element equations of equation (8) are assembled into a global system of equations which can be readily solved to obtain real-time deformed structural shapes, including the strains at unmeasured locations (Figure 3(c)). The more detailed procedure of iFEM is given in Kefal et al. (Reference Kefal, Mayang, Oterkus and Yidis2018) and Mikami et al. (Reference Mikami, Jumonji, Kobayashi, Toh, Komoriyama, Ma and Murayama2020).
$ {\boldsymbol{\varepsilon}}^{\boldsymbol{e}} $
for the elements fitted with strain sensors, the element equations of equation (8) are assembled into a global system of equations which can be readily solved to obtain real-time deformed structural shapes, including the strains at unmeasured locations (Figure 3(c)). The more detailed procedure of iFEM is given in Kefal et al. (Reference Kefal, Mayang, Oterkus and Yidis2018) and Mikami et al. (Reference Mikami, Jumonji, Kobayashi, Toh, Komoriyama, Ma and Murayama2020).
Among these three data assimilation methods, the wave spectrum method is useful for short-term statistical assessments of structural responses and the KF method and iFEM are suitable for real-time structural response assessments. The three methods can be used either independently or in conjunction. For instance, the output time history from the KF method or iFEM may be used for the input to the wave spectrum method, and iFEM may be utilized in combination with other methods for the analysis of structural details. These remain as future extensions.
3.3.4. Validation by wave tank test
A wave tank test was performed for validation of the data assimilation methods. Table 1 shows the wave conditions and ship speed used in the wave tank test (Houtani et al., Reference Houtani, Mikami, Komoriyama, Chen, Miyake, Tatsumi, Kuroda, Okada, Iijima, Murayama and Oka2022). Bimodal short-crested irregular waves as a combination of swell and wind waves were considered. The values in the parenthesis in Table 1 are the full-scale values corresponding to the prototype scale. Figure 5 shows the locations of the strain sensors. The strains at the sensors marked by stars were estimated from those at the sensors marked by circles. Four deck strains were used as the measured strains for the wave spectrum method, and six deck strains were used for the KF method. For iFEM, 56 strains were used as the measured strains, including those at the side and bottom parts.
Table 1. Wave conditions for wave tank test (1/72 scale)
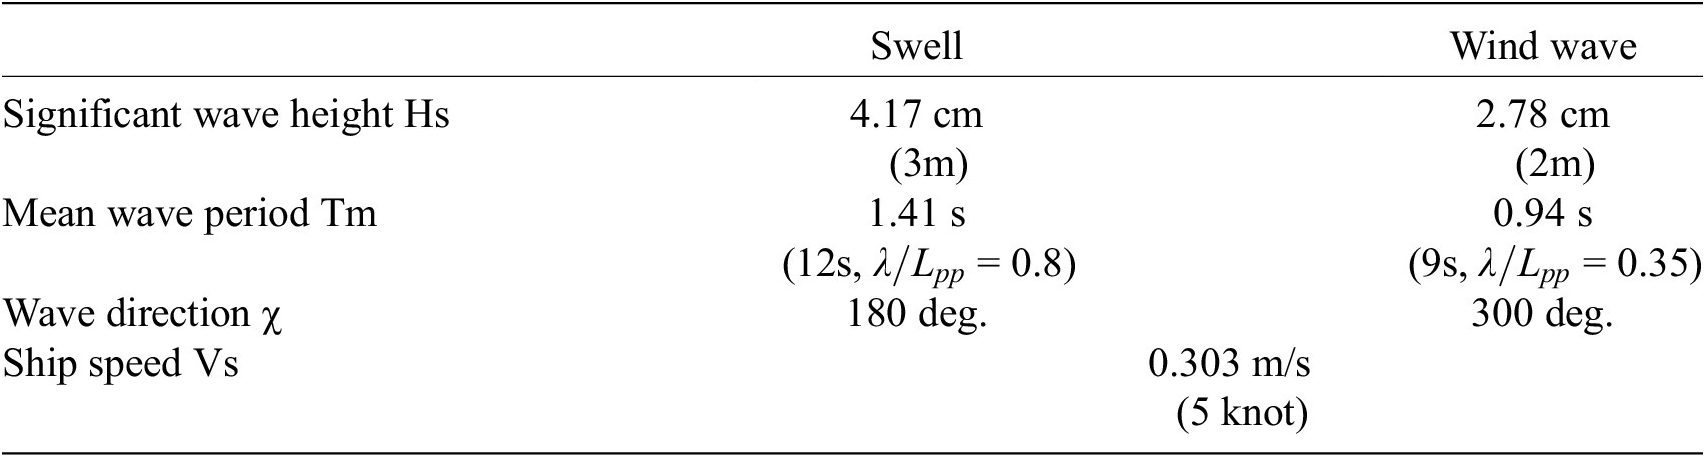

Figure 5. Locations of strain sensors on model ship used for validation of data assimilation methods.
Figure 6 shows a comparison of the time history of the strains obtained by the KF method, iFEM, and measurement. To quantify the estimation error, the following two metrics, RMSE (root-mean-square error) and ME (maximum-value error), are considered:
 $$ {\displaystyle \begin{array}{c}\mathrm{RMSE}=\frac{\sqrt{\frac{1}{N}{\sum}_{i=1}^N{\left({\varepsilon}_i^{est}-{\varepsilon}_i^{meas}\right)}^2}}{2\sqrt{\frac{1}{N}{\sum}_{i=1}^N{\varepsilon_i^{meas}}^2}}\times 100\;\left[\%\right],\end{array}} $$
 $$ {\displaystyle \begin{array}{c}\mathrm{M}\mathrm{E}\hskip2pt =\hskip2pt \frac{\max (|{\varepsilon}^{est}|)-\max (|{\varepsilon}^{meas}|)}{\max (|{\varepsilon}^{meas}|)}\times 100\hskip2pt [\%].\end{array}} $$
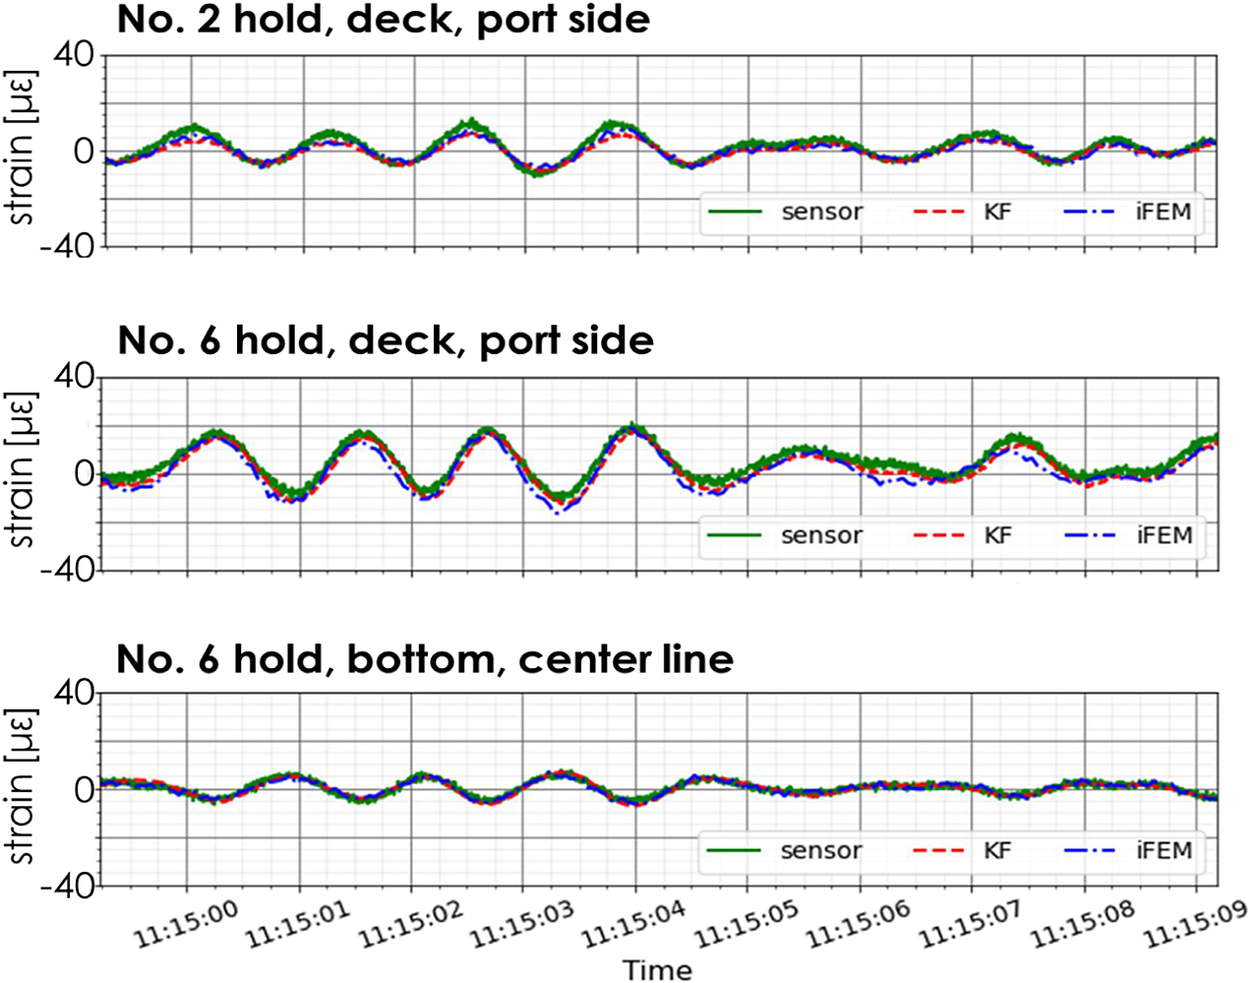
Figure 6. Comparison of time histories of longitudinal strain by KF method, iFEM, and measurement.
The denominator of RMSE corresponds to half of the significant value of the total strain amplitude. As given in Table 2, both iFEM and the KF method can estimate the strain time histories within an error of about 20% RMSE and 10% ME. iFEM also gives estimates with similar accuracy, but generally requires a larger number of measured strains than the KF method, because the KF method estimates the full-field deformation as a summation of the natural vibration modes, whereas iFEM gives direct estimates from the strains at the measured locations based on the displacement–strain relationship.
Table 2. Comparison of root-mean-square error (RMSE) and maximum-value error (ME) of strain time histories between iFEM and KF method in irregular wave test
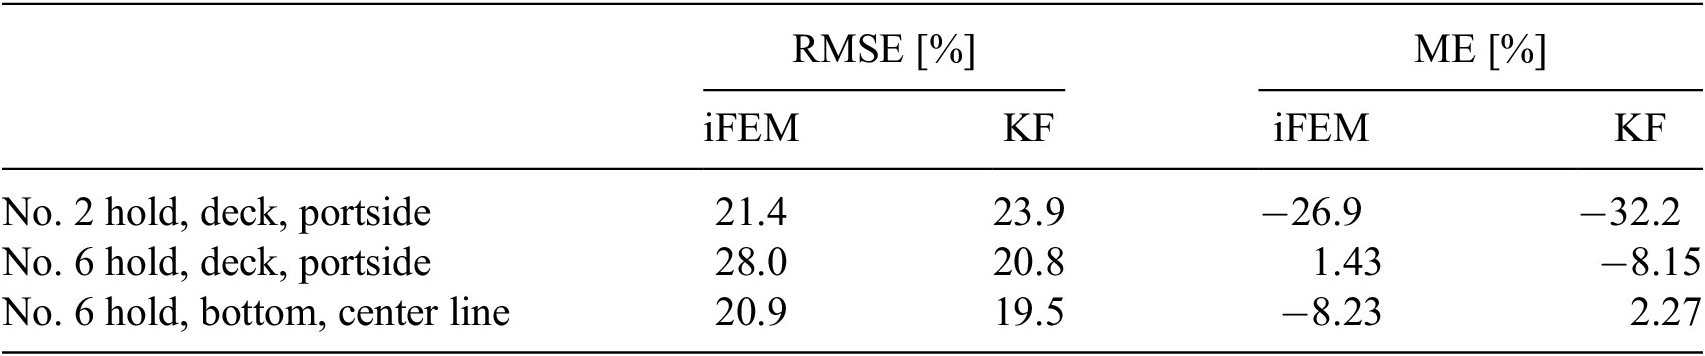
Figure 7 shows a comparison of the wave spectrum obtained by the direct wave measurement (Figure 7(a)) and spectra estimated by the wave spectrum method (Figure 7(b,c)). The radial coordinate of each figure represents the circular frequency of the wave components approaching from each direction. Two cases were considered for the wave spectrum method. In the method A, the heave, pitch, and roll motion data were used as the observed response, whereas in the method B, the four deck strains were used. Better agreement with the direct wave measurement was observed with method B than with method A, including the energy peak period and wave directions, because higher frequency wave components are filtered in method A but can be captured in method B through the hull structural response data. Table 3 is a comparison of the difference, defined by equation (12), in the standard deviation of the strains at some locations by the wave spectrum method and measurement.
 $$ {\displaystyle \begin{array}{c}\mathrm{Difference}=\frac{\mathrm{Estimation}-\mathrm{Measurement}}{\mathrm{Measurement}}\times 100\;\left[\%\right].\end{array}} $$

Figure 7. Comparison of wave spectrum by direct measurement and data assimilation using wave spectrum method.
Table 3. Comparison of difference in standard deviation of strain by wave spectrum method in irregular wave test

As shown in Figure 7 and Table 3, estimation accuracy is significantly improved by considering strains as the observed response.
3.3.5. Validation using existing hull monitoring data of actual ships
Validation of the data assimilation methods was performed for actual ships using existing hull monitoring data. Regarding the wave spectrum method, the hull monitoring data for ten 14,000 TEU container ships were used as reference data, and good accuracy of the stress estimates was confirmed (Chen et al., Reference Chen, Okada, Kawamura and Mitsuyuki2021).
For the validation of the KF method, the hull monitoring data for an 8,600 TEU container ship were used. Figure 8(a) shows the typical vertical bending (VB), horizontal bending (HB), and torsional (T) natural vibration modes. Four vertical bending, four horizontal bending, and two torsional vibration modes were considered for data assimilation. The results are shown in Figure 8(c). The vertical hull girder response could be reproduced satisfactorily by using six deck strains, and reproduction of the horizontal and torsional hull girder responses was also possible by adding a further six bottom strains. Improvement is necessary to obtain more accurate estimates of the local deformation of transverse cross sections, in particular, for the bottom parts, as found at location No. 8 in Figure 8(c). It should be noted that all the data assimilation in this project is based on the response function assuming linear responses. To estimate strongly nonlinear responses, such as a whipping response, improvement is necessary.

Figure 8. Result of data assimilation by KF-method for 8,600 TEU container ship.
3.4. DT-system platform i-SAS
Real-time visualization of structural responses to operators or decision makers is another important element in DTSS. The DT-system platform i-SAS was developed for this purpose (Mikami et al., Reference Mikami, Kobayashi, Miyashita, Komoriyama, Ma, Tatsumi, Toh, Miratsu, Hirakawa, Mitsuyuki and Murayama2022). The i-SAS provides an open platform (interface) and tools for constructing any DT system comprising the functions of measurement, data assimilation, prediction, and decision support.
Figure 9 is an example of the i-SAS GUI window, showing the real-time response of a tank test model obtained by iFEM and the KF method. The i-SAS can provide any DTSS output as needed, such as the overall hull structure deformation, stress contours, longitudinal bending moment and shear force distributions, trajectories of cross-sectional forces at specified hull girder sections, strength limits and safety margins, camera views, and so forth. Note that the continuous hull girder deformation in Figure 9 was reproduced by data assimilation using a limited number of sensors.

Figure 9. GUI window of i-SAS.
Successful applicability of the i-SAS to real-time visualization of structural responses was confirmed through a wave tank test. Since the time scale, such as the wave periods and load durations, associated with actual ships is generally longer than that of a model ship, while the CPU time required for data assimilation is similar, the developed system is considered available for actual ships. A full-scale test using an ore carrier confirmed that the i-SAS functions well on a personal computer with a CPU specification of AMD Ryzen 5 PRO 4650GE (3.30 GHz 3 MB) and memory size of 32 GB.
3.5. Prediction for decision support
In addition to reproduction of responses by data assimilation, prediction of responses for decision support is essential for DTSS. Typical decision indices for ship structural integrity and safety assessments are the maximum response in extreme sea states and the long-term cumulative fatigue damage for inspection and maintenance. While conventional methods for evaluating these decision indices using wave forecasting data and linear transfer functions or RAO are available, there may be a certain gap between the results estimated by the conventional methods and the real responses obtained by hull monitoring. Therefore, new methods for utilizing DTSS for more correct evaluation of decision indices and further, making future predictions were developed, as outlined below.
3.5.1. Prediction of maximum-value distribution of wave bending moment in encountered sea state
The maximum response of ships in a short-term sea state is usually estimated by the following steps:
-
i) Estimate the significant wave height $ {H}_S $
and the mean wave period
$ {T}_m $
in the encountered short-term sea state based on wave forecasting and the navigation route.
$ {H}_S $
and the mean wave period
$ {T}_m $
in the encountered short-term sea state based on wave forecasting and the navigation route. -
ii) Determine the wave spectrum for the given
$ {H}_S $
and
$ {T}_m $
using simple formulae as given in design rules. -
iii) Obtain the response spectrum from the wave spectrum and the RAO of the target response by applying linear spectrum theory.
-
iv) Calculate the variance R 2 of the response from the response spectrum.
-
v) Obtain the maximum value distribution using the variance R 2.


The green dashed line in Figure 10 shows the time history of the standard deviation R of the vertical wave bending moment (VBM) amidship of the 8,600 TEU container ship, which was estimated by steps i) to v) using the wave spectrum based on the wave nowcast database provided by JWA (Japan Weather Association), and the red line shows the time history of the standard deviation R of VBM observed by hull monitoring. It was found that the R based on the nowcast data over-predicts the observed values. The possible reasons for this error include uncertainties in the wave data, assumed spectrum shape, relative heading angle model, RAO, nonlinear effects, and so forth.
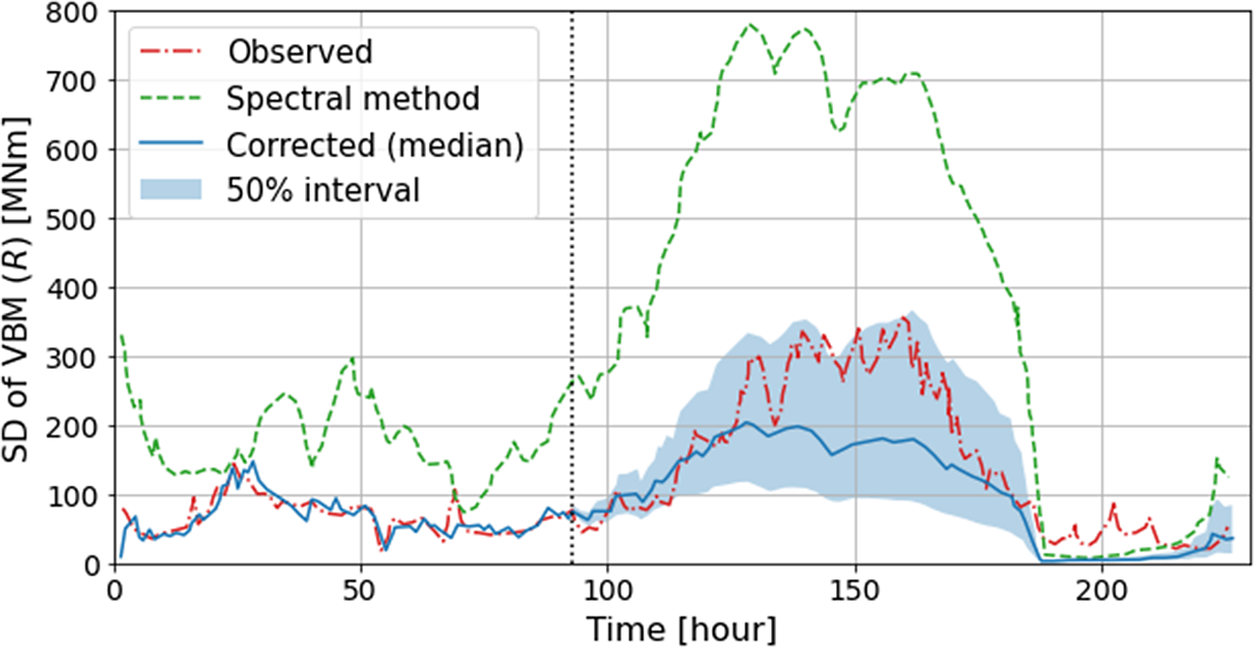
Figure 10. Example of comparison of variation of VBM estimated by linear theory $ {r}_t $
and measured data
$ {r}_t $
and measured data $ {R}_t $
.
$ {R}_t $
.
Tatsumi proposed a method for reducing the error in the predicted R 2 time-series using the observation data by applying a time-series stochastic model (Osawa et al., Reference Osawa, Tatsumi and Takeuchi2022). The following log series function was used as an observation equation:
 $$ {\displaystyle \begin{array}{c}\log \left({R}_t^2\right)={a}_t\log \left({r}_t^2\right)+{b}_t+{w}_t,\end{array}} $$
where $ {r}_t^2 $
is the response R
2 obtained from the wave spectrum,
$ {r}_t^2 $
is the response R
2 obtained from the wave spectrum, $ {R}_t^2 $
is the R
2 obtained from the observation data, and
$ {R}_t^2 $
is the R
2 obtained from the observation data, and $ {w}_t $
is observation noise, which is assumed to follow a normal distribution.
$ {w}_t $
is observation noise, which is assumed to follow a normal distribution. $ {a}_t $
and
$ {a}_t $
and $ {b}_t $
are the time-varying regression coefficients, and were developed by the random work model. The variance of the observation noise is also included in the state variables. Because the state-space model is nonlinear, a particle filter was applied to determine the state variables. The blue line in Figure 10 shows the median of the probabilistic distribution of the corrected R time-series predicted based on the observation data up to a time instance of 93 h. The upper bound of the blue area corresponds to the 75 percentile line, and almost coincides with the observed R. It was confirmed that the accuracy of the prediction of the R of VBM is significantly improved by using the observation data, leading to improved accuracy of structural reliability assessments for severe sea states.
$ {b}_t $
are the time-varying regression coefficients, and were developed by the random work model. The variance of the observation noise is also included in the state variables. Because the state-space model is nonlinear, a particle filter was applied to determine the state variables. The blue line in Figure 10 shows the median of the probabilistic distribution of the corrected R time-series predicted based on the observation data up to a time instance of 93 h. The upper bound of the blue area corresponds to the 75 percentile line, and almost coincides with the observed R. It was confirmed that the accuracy of the prediction of the R of VBM is significantly improved by using the observation data, leading to improved accuracy of structural reliability assessments for severe sea states.
3.5.2. Prediction of long-term cumulative fatigue damage
The cumulative fatigue damage of critical details of ship structures subjected to long-term wave fluctuation is normally calculated from the joint probability distribution of $ {H}_S $
and
$ {H}_S $
and $ {T}_m $
based on the wave scatter data and the assumed probability distribution of the relative heading angle
$ {T}_m $
based on the wave scatter data and the assumed probability distribution of the relative heading angle $ \chi $
(Figure 11). The method of tracking a ship’s automatic identification system (AIS) data and relating that data with MetOcean data is also widely applied to construct the joint probability distribution of
$ \chi $
(Figure 11). The method of tracking a ship’s automatic identification system (AIS) data and relating that data with MetOcean data is also widely applied to construct the joint probability distribution of $ {H}_S $
,
$ {H}_S $
, $ {T}_m $
, and
$ {T}_m $
, and $ \chi $
(e.g., Oka et al., Reference Oka, Takami, Ma, Okada, Suzuki and Kawamura2021). Linear spectrum theory is generally assumed for calculation of the response spectrum, but there may be significant error in the cumulative fatigue damage between the prediction by this conventional method and the results of observation by hull monitoring. As in the case of the maximum value prediction in Section 3.5.1, this is primarily because of the uncertainties in the assumed wave parameters, spectrum shape, relative heading angle, RAO, nonlinear effects, and so forth. Figure 12 shows a comparison of the measured stress variance R
2 and median of fatigue damage per hour and the values estimated by the conventional method. The conventional linear spectrum theory provides conservative predictions of R
2 and fatigue damage, but both are significantly over-predicted compared to the observed values.
$ \chi $
(e.g., Oka et al., Reference Oka, Takami, Ma, Okada, Suzuki and Kawamura2021). Linear spectrum theory is generally assumed for calculation of the response spectrum, but there may be significant error in the cumulative fatigue damage between the prediction by this conventional method and the results of observation by hull monitoring. As in the case of the maximum value prediction in Section 3.5.1, this is primarily because of the uncertainties in the assumed wave parameters, spectrum shape, relative heading angle, RAO, nonlinear effects, and so forth. Figure 12 shows a comparison of the measured stress variance R
2 and median of fatigue damage per hour and the values estimated by the conventional method. The conventional linear spectrum theory provides conservative predictions of R
2 and fatigue damage, but both are significantly over-predicted compared to the observed values.

Figure 11. Long-term fatigue damage assessment based on linear spectrum theory.

Figure 12. Comparison of measured wave stress variance R 2 and median of fatigue damage per hour and those estimated by linear spectrum theory for No. 6 sensor in 8,600 TEU container ship.
In order to improve the prediction of long-term cumulative fatigue damage by employing observed stress data, Osawa et al. (Reference Osawa, Tatsumi and Takeuchi2022) proposed an “equivalent wave probability (EWP)” concept. Although the formulae, probabilistic models and structural characteristics (e.g., RAO) of the conventional fatigue analysis method are unchanged in this concept, the joint probability distribution of the wave parameters $ {H}_S $
and
$ {H}_S $
and $ {T}_m $
is approximated by a simple mathematical function, and its population parameters are determined so that the estimated probabilistic distribution of stress R
2 (not a wave R
2) agrees with the observed distribution. The additional concrete steps are as follows:
$ {T}_m $
is approximated by a simple mathematical function, and its population parameters are determined so that the estimated probabilistic distribution of stress R
2 (not a wave R
2) agrees with the observed distribution. The additional concrete steps are as follows:
-
i) The EWP equation is represented by six parameters
$ \left\{m,\eta, {a}_0,{a}_1,\hskip0.4em ,{b}_0,\hskip0.4em ,{b}_1\right\} $
as

 $$ p({H}_S,{T}_m)=p({H}_S)p({T}_m|{H}_S), $$
 $$ p\left({H}_S\right)=\mathrm{Weibull}\hskip0.4em \left(\mathrm{shape}\ \mathrm{parameter},=,m,,,\hskip0.4em ,\mathrm{scale}\ \mathrm{parameter},=,\eta \right) $$
 $$ p({T}_m|{H}_S)=\mathrm{W}\mathrm{e}\mathrm{i}\mathrm{b}\mathrm{u}\mathrm{l}\mathrm{l}\hskip0.4em (\mathrm{s}\mathrm{h}\mathrm{a}\mathrm{p}\mathrm{e}\ \mathrm{p}\mathrm{a}\mathrm{r}\mathrm{a}\mathrm{m}\mathrm{e}\mathrm{t}\mathrm{e}\mathrm{r}=\alpha, \hskip2pt \mathrm{s}\mathrm{c}\mathrm{a}\mathrm{l}\mathrm{e}\ \mathrm{p}\mathrm{a}\mathrm{r}\mathrm{a}\mathrm{m}\mathrm{e}\mathrm{t}\mathrm{e}\mathrm{r}=\beta ) $$
 $$ \alpha \left({H}_S\right)={a}_0+{a}_1{H}_S,\hskip0.96em \ln \left\{\beta \left({H}_S\right)\right\}={b}_1+{b}_2\ln \left({H}_S\right). $$
-
ii) The probability distribution of stress R 2 is represented by the generalized gamma distribution with three population parameters
$ \left\{\mu, \sigma, Q\right\} $
. -
iii) The correlation between the wave state parameters
$ \left\{m,\eta, {a}_0,{a}_1,{b}_0,{b}_1\right\} $
and the stress R
2 parameters
$ \left\{\mu, \sigma, Q\right\} $
is established by performing stress response analyses for all sea areas of global wave statistics (GWS). -
iv) Using the statistical model established in step iii) and applying MCMC Bayesian inference,
$ \left\{m,\eta, {a}_0,{a}_1,{b}_0,{b}_1\right\} $
and
$ \left\{\mu, \sigma, Q\right\} $
are determined so that the likelihood of the observed stress R
2 is maximized, as shown in Figure 13.


Figure 13. Schematic flow of EWP determination.
The EWP can be determined at diverse locations where stress is measured. In the event that the stress R 2 at a position distinct from the reference position, estimated from the EWP at the reference position, agrees with that evaluated from the EWP at that measurement point, the probabilistic distribution of the stress R 2 and the fatigue damage can be estimated at any position throughout the entirety of the vessel from the EWP at the reference position. This requirement is achieved by assimilating the statistical model determined in step iii) before the EWP determination process.
Figure 14 shows a comparison of the measured and estimated fatigue damages calculated for the 8,600 TEU container ship in Figure 8(b) (Takeuchi et al., Reference Takeuchi, Osawa, Tatsumi, Inoue, Hirakawa, Seki, Yoshida, Miratsu and Ikeda2023). The statistical model was assimilated in two cases of a voyage A of Far East–Suez–Europe–North America–Far East and a voyage B of Far East–Suez–Europe, which were applied to the estimation of voyage A, respectively. The EWP was determined from the observed stress R 2 at one reference position (No. 6 position in Figure 8(b)), and was then applied to all other positions. As shown, the estimated fatigue damages obtained by the EWP are in good agreement with the measured results for all positions. The difference of the fatigue damage defined by equation (12) is −8.51 – 25.5% at the deck (sensor no. 1, 2, 5, 6, 9, 10), and −14.0 – 58.9% at the bottom (sensor no. 3, 4, 7, 8, 11, 12). The difference is relatively larger for the bottom than for the deck, but the damage is smaller and the estimate generally falls on the safe side.

Figure 14. Comparison of median of fatigue damage per hour for 8,600 TEU container ship by measurement and estimation by EWP identified by measured stress R 2 at No. 6 position.
The EWP parameters are determined from the hull monitoring data for a mid-term period (one season to one year). The time-series of the EWP and operation parameters are made available by repeating the EWP parameter determination and recording the operating condition in service, and the state-space model for the EWP and the operational parameters can then be developed based on these data. This model enables forecasting of whole-ship fatigue damage considering the future operating condition. More details about the EWP approach can be found in Takeuchi et al. (Reference Takeuchi, Osawa, Tatsumi, Inoue, Hirakawa, Seki, Yoshida, Miratsu and Ikeda2023).
3.6. Full-scale test
The developed DTSS methodologies and system were applied to two full-scale ships during the project. One ship is a Capesize bulk carrier, as shown above in Figure 2(c), with a length, width, and depth of approximately 300 m, 50 m, and 25 m, respectively, and the other is an ore carrier with a length, width, and depth of approximately 320 m, 55 m, and 24 m, respectively. The Capesize bulk carrier had been equipped with a hull monitoring system using foil strain gauge sensors prior to this project, as was shown in Figure 2(c). The strain data captured by this system were used to examine the applicability of data assimilation by the wave spectrum method. On the other hand, the ore carrier was newly retrofitted with a hull monitoring system using FBG sensors during the project to examine the applicability of data assimilation by the KF method and i-SAS system. Although both ship tests are ongoing, some results obtained to date with the Capesize bulk carrier are presented herein.
Figure 15 shows the time history of the deck and bottom longitudinal stresses measured amidship during a half-year test. The blue line indicates the mean value of stress in each 20-min period, and the red line shows the mean value plus the standard deviation, so the fluctuations of the red line are due to the wave effect, and those of the blue line are due to the still water load and temperature effects. The temperature effect is larger at the deck than at the bottom, and it is known that the temperature effect is significant and should not be neglected in hull stress monitoring.

Figure 15. Time history of deck and bottom stresses amidship measured in Capesize bulk carrier.
Figure 16 shows a comparison of the significant values of the wave-induced deck stress per hour obtained by measurement and estimation. The gray plots are the estimation using the wave spectrum determined based on the ERA5 hindcast data and AIS data, and the orange plots were estimated using the wave spectrum identified by the wave spectrum method. The figure shows the mean value, μ, and standard deviation, σ, of the difference between the estimation and measurement, defined by equation (12), calculated for all the gray or orange plots. Compared to the values obtained using the ERA5 data, the estimation by the DTSS wave spectrum method is in much better agreement with the measured values because DTSS reproduces the wave conditions encountered by the ship, whereas ERA5 is based on wider-area oceanographic information. Thus, this study again confirmed that DTSS can reduce uncertainty in the estimation of stress responses due to waves.

Figure 16. Comparison of significant values of wave-induced deck stress per hour by measurement and estimation.
4. Implementation of DTSS in maritime industry
4.1. Utilization scenarios
As described in the foregoing sections, several basic technologies for DTSS have been developed and validated through the model and full-scale measurements. In order to implement DTSS in the maritime industry, however, not only technical aspects but also utilization scenarios must be discussed.
From a systems analysis using the stakeholder value network (SVN), which visualizes the flow of service, information, and money among stakeholders as a result of DTSS implementation, we identified four major utilization scenarios; namely, navigation support, maintenance support, rule improvement, and product value improvement. Figure 17 shows some key elements of these four scenarios arranged in order of the required time for realization. The value created by each specific scenario was examined.

Figure 17. Major utilization scenarios for DTSS.
4.1.1. Navigation support
When the KF method or iFEM is employed, DTSS can output the real-time global and local structural responses of any position of the ship hull in encountered waves. When the wave spectrum method is employed, DTSS can provide short-term statistics for the responses, for example, for a period of a few hours. Since this method essentially estimates the short-term wave state, any wave-induced response may be estimated, including ship motion, cargo behavior and even the wave effect on propulsion resistance. The KF method has this possibility in the time domain. These short-term or real-time capabilities of DTSS, together with the prediction methods described in Section 3.5.1 and visualization techniques, can be used for ship navigation support, such as issuing alerts and suggesting alternative routes to operators when the responses reach unacceptable levels, or selecting routes with better punctuality or fuel efficiency within the allowable safety level.
4.1.2. Maintenance support
The stress history and its variance obtained by DTSS enable calculation of the long-term cumulative fatigue damage experienced in actually encountered waves. By applying the EWP concept described in Section 3.5.2, multi-point long-term fatigue assessments can be made based on hull monitoring data captured at a small number of reference sensors. This kind of DTSS output can be utilized for rational and efficient inspection and maintenance schemes enhanced to focus on positions with a truly high risk of damage. This means that hull structural maintenance can be shifted from periodic maintenance to risk-based maintenance. Moreover, this may be possible not only for individual ships but also at the fleet level, so that maintenance is performed when the required fleet capacity is low and is not performed when it is high. Although relevant rule changes will be needed in order to implement risk-based maintenance of ships, the introduction of DTSS definitely expands the possibilities.
4.1.3. Rule improvement
From information obtained through DTSS, such as how a ship was operated, what loads acted on the ship hull, what stresses were induced in each member, and so forth, it is possible to grasp what was actually happening in the ship structure in service. Sharing this information within the maritime cluster of shipyards, shipping companies, ship owners, and classification societies will enable clear identification and quantification of various uncertain factors underlying the present ship structural rules. This is expected to result in a shift from the conventional rules, which comprehensively and prescriptively cover the uncertain factors of various ships, to a more data-driven risk-based rule framework, enabling more cost-effective structural design while also ensuring greater safety. This can be a trigger to breaking away from the commoditization of conventional ship structural design.
4.1.4. Product value improvement
Detailed rating of second-hand ships
The degree of cumulative fatigue damage output from DTSS can be an objective measure for rating second-hand ships. For sellers, it can be used as an index to show how a ship has been maintained and how quality control has been performed in terms of fatigue damage, which was invisible until now. It can also be a measure for evaluating the potential risk of the structural integrity and durability for buyers when deciding on investments, and for insurance bodies when setting fees. For shipyards, it can be used as a measure to demonstrate the quality of their product and to acquire trust in both the second-hand and new ship markets.
Increased quality and productivity of ship construction
DTSS can output information on the stress, sea and weather conditions and ship operation at the time of damage occurrence, as well as their histories. By analyzing this information, it is possible to determine whether the damage was due to the design, construction or operation of the ship, and then to improve design quality and construction quality. In addition, the accumulation of such damage information will make it possible to clarify the processes that require further precision and quality in construction and those that do not require stricter control, thereby improving both construction quality and productivity.
Data-driven advanced design framework
DTSS provides information on actual load intensities and frequencies and the corresponding strength margins during ship operation. This clarifies the relationship between operation and design parameters, enabling feedback to more rational design that considers operation. Such feedback is especially important for new-type or next-generation ships such as zero-emission ships and autonomous ships, where so-called model-based systems engineering (MBSE) is drawing attention. MBSE provides an efficient and flexible design framework based on simulation, but at the same time, the model must be adequately validated through operation. As part of this advanced design framework, DTSS is considered useful for understanding and predicting operational performance and validating models for design.
4.2. Integrated DT
DT technologies for ships are under development for various stages of ship building and operation, such as propulsion plant DT, navigation DT, construction DT, as well as structure DT as shown in Figure 18. However, the utilization scenarios for DTSS described in Section 4.1 will be effectively realized only when these DTs are mutually inter-related in an integrated system, with information shared. For instance, for ship navigation support, not only the strength margins but also stability, engine, and fuel consumption performances are totally necessary for decision-making. This type of integrated DT, overarching the different individual DTs, needs to be developed as the next stage. Figure 19 is an example of the concept of integrated DT for risk-based maintenance (Hamada et al., Reference Hamada, Wanaka and Mitsuyuki2022).

Figure 18. Concept of integrated digital twin (integrated DT).
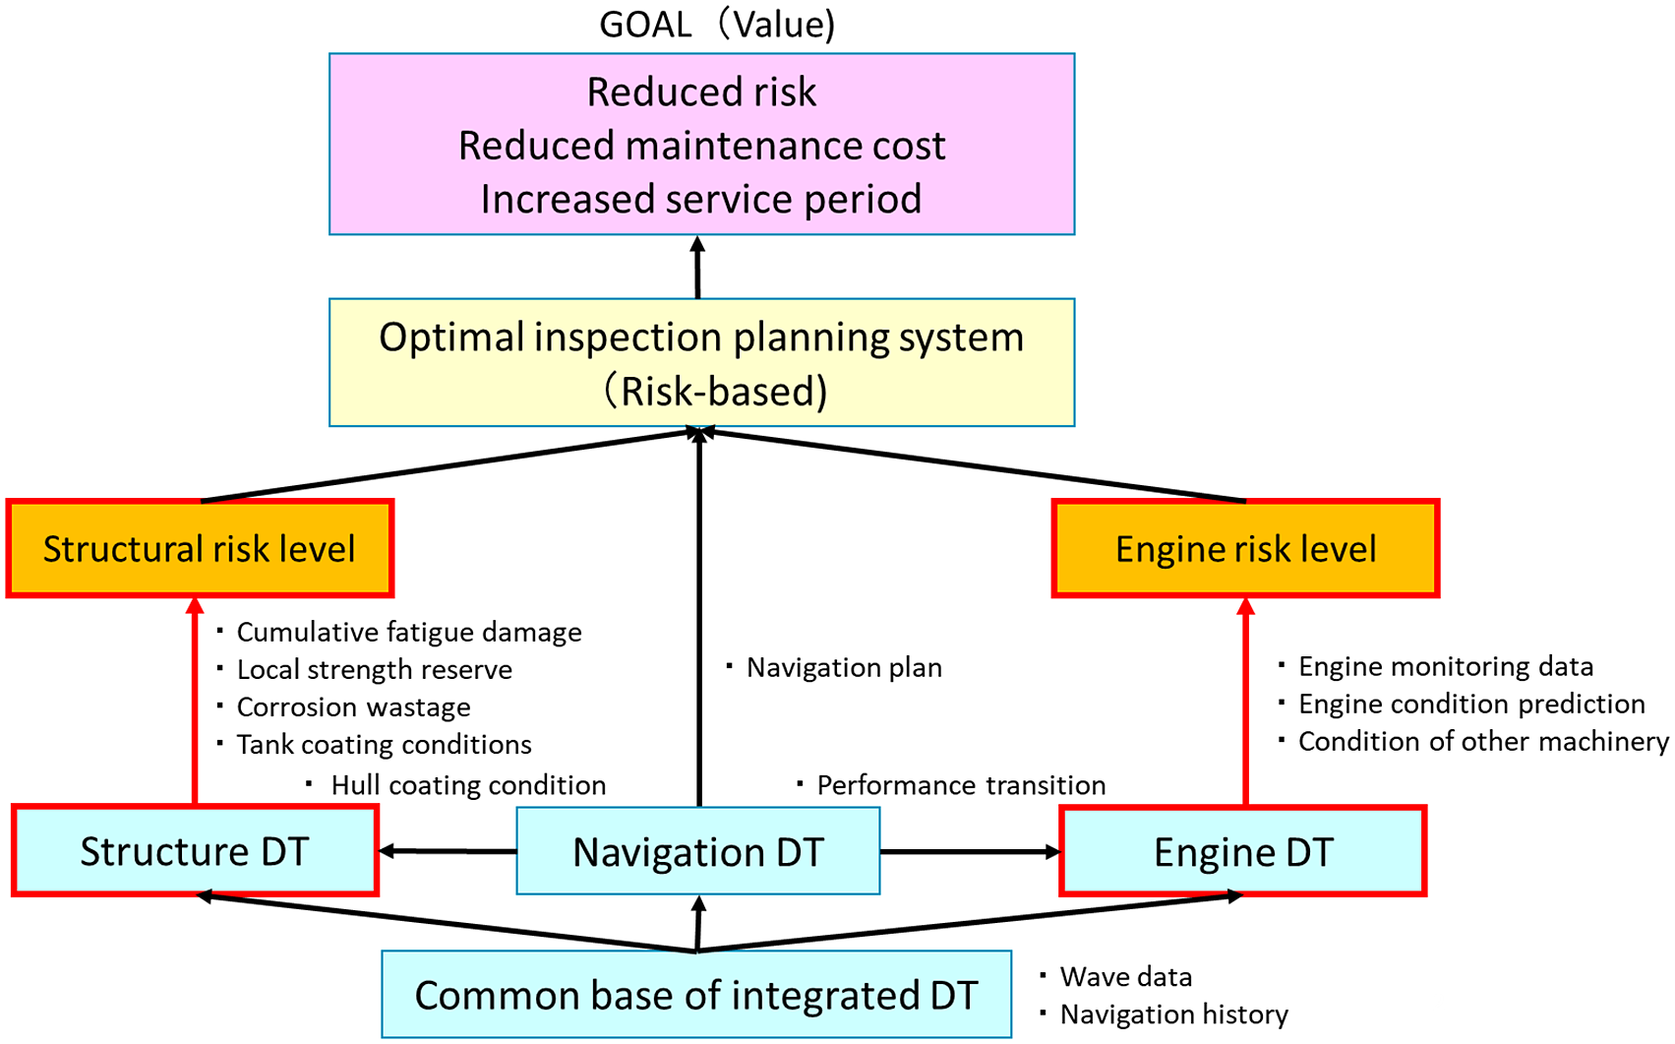
Figure 19. Concept of integrated DT for risk-based maintenance.
5. Conclusions
Major achievements of Japan’s R&D project for the DTSS were outlined, including the basic concept of DTSS, key technologies for monitoring, data assimilation, and prediction, the open platform for the DT system i-SAS, and utilization scenarios for DTSS. DTSS clarifies and visualizes the real state of ship structural performances in operation, and can contribute to reducing uncertainties in load and strength estimates for structural integrity assessments, leading to more optimal ship design, construction, and operation. The technical feasibility of DTSS was confirmed through extensive model and full-scale measurements and numerical simulations. The need for efforts to extend DTSS to integrated DT in order to maximize the effectiveness of DTSS in the maritime industry was also noted.
Future research needs can be summarized as follows:
-
- Since DTSS can predict wave states as well as structural responses, it has wide potential to reproduce any ship response in waves, including ship motions, cargo behaviors, and so forth. This extension of DTSS is essential in constructing an integrated DT.
-
- The developed data assimilation methods all apply to linear responses. Extension to nonlinear responses is needed.
-
- The stress responses considered are currently of a nominal stress level. Data assimilation methods for more local stress and deformation need to be investigated and validated for fatigue strength assessment.
-
- DTSS can reduce the uncertainties in load and strength estimation through the use of measured data, but it should be noted that DTSS also has its own uncertainties in each of the stages of monitoring, data assimilation and prediction. For instance, the uncertainty in the transfer function needs to be considered for data assimilation, as recently discussed by Chen et al. (Reference Chen, Takami, Oka, Kawamura and Okada2023). It is necessary to construct rational decision-making criteria that take into account such uncertainties of DTSS itself, as well as the reduction of uncertainty achieved by DTSS.
-
- To be accepted by the industry, any new system must be cost-effective. Optimal design methodologies for DTSS need to be developed, considering the minimum required number of sensors and other cost-related factors. At the same time, or prior to technical issues, further discussion of a business model among stakeholders for DTSS implementation is needed.
-
- Standardization of DT technologies for the data interface, data format, sensors, and the like is essential for dissemination of DTs. The issues of data ownership are also important.
While there is still much need for improvement and extension, as described above, it can be said that we have taken a significant step forward toward DX in the maritime industry through the 4-year DTSS project. Follow-up R&D efforts are on-going, including full-scale tests on the Capesize bulk carrier and ore carrier, and the results will be reported in the near future. Finally, the developed DTSS methodologies and system can be applied not only to ships but also to any marine structures, including floating wind turbines, and so forth, and thus have wide applicability.
Abbreviations
- AI
-
artificial intelligence
- AIS
-
automatic identification system
- DLSA
-
direct load and structure analysis
- DTSS
-
digital twin for ship structures
- ERA5
-
5th generation ECMWF (European Centre for Medium-Range Weather Forecasts) reanalysis
- EWP
-
equivalent wave probability
- FBG
-
fiber bragg grating
- FE
-
finite element
- FEM
-
finite element method
- GFRP
-
glass fiber reinforced plastics
- GWS
-
global wave statistics
- HMS
-
hull monitoring system
- iFEM
-
inverse finite element method
- IoT
-
internet of things
- i-SAS
-
integrated-structural analysis system
- JWA
-
Japan Weather Association
- KF
-
Kalman filter
- MBSE
-
Model based systems engineering
- MCMC
-
Markov chain Monte Carlo methods
- NMRI
-
National Maritime Research Institute
- R
-
standard deviation
- R 2
-
variance
- RAO
-
response amplitude operator
- SVN
-
stakeholder value network
- TEU
-
twenty-foot equivalent unit
- VBM
-
vertical bending moment
Author contribution
Conceptualization: M.F., T.O., H.M., N.O., K.I., K.H., M.O., S.H., T.Ar., Y.T., T.M., H.O.; Investigation: T.O., H.M., H.H., N.O., K.I., K.T., M.O., S.H., K.S., T.As., A.T., T.T., T.M., K.M., M.K., Y.K., C.M., X.C., R.M.; Methodology: T.O., H.M., H.H., N.O., K.I., M.O., A.T., T.T., K.M., Y.K., X.C.; Software: H.M., H.H., K.T., S.H., A.T., T.M., K.M., M.K., Y.K., C.M., R.M.; Writing original draft: M.F., T.O., H.H., N.O., K.H., M.O., Y.T., A.T., T.T. All authors approved the final submitted draft.
Competing interest
The authors declare none.
Data availability statement
The datasets generated and/or analyzed during the current study are available from the respective authors on reasonable request.
Funding statement
This research was supported by grants from The Nippon Foundation and performed as a project in Japan Ship Technology Research Association.
Ethical standard
The research meets all ethical guidelines, including adherence to the legal requirements of the study country.


 Open access
Comments
No Comments have been published for this article.