


Introduction
The Geriatric Anxiety Inventory (GAI; Pachana et al., Reference Pachana, Woodward and Byrne2007) is one of the few appropriate screening measures for assessing anxiety in elderly individuals (Creighton, Davison, & Kissane, Reference Creighton, Davison and Kissane2018; Therrien & Hunsley, Reference Therrien and Hunsley2012). It is a self-report scale composed of 20 items designed to assess anxiety symptoms over the past week using a dichotomous (yes/no) response format. Prior to the final 20-item version of the GAI, scale developers generated a pool of items, either formulated de novo or adapted from existing anxiety scales (Pachana, Byrne, et al., Reference Pachana, Woodward and Byrne2007). Items were chosen by the developers if they reflected general anxiety and covered primary domains of existing scales (e.g., fearfulness, worry, cognitions about anxiety). Developers were careful to limit the inclusion of somatic symptoms that may overlap with symptoms of general medical conditions. The developers reduced the pool of items by consulting with a reference group and psychometric testing with pilot samples. The GAI was normed with samples of community-dwelling seniors and older adults receiving psychiatric services. Total score on the GAI ranges between 0 and 20 and higher scores indicate greater anxiety symptoms. Cut-off scores of 11 and 9 and above were recommended to detect generalized anxiety disorder (GAD) and other anxiety disorders respectively. In the original study, the GAI presented sound psychometric properties with internal consistency coefficients of .91 and .93 for the non-clinical and psychogeriatric samples respectively (Pachana, Byrne, et al., Reference Pachana, Woodward and Byrne2007). Convergent validity varied between .44 to .70 for measures that assessed anxiety or related constructs. Retest reliability was .91 for the psychogeriatric sample.
A 5-item short form (GAI-SF; items 1, 6, 8, 10 and 11 of the GAI long form; Byrne & Pachana, Reference Byrne and Pachana2011) was further developed to make the use of the instrument more practical in primary care and acute geriatric medical settings. The short-form items were chosen among those of the standard GAI based on parameters such as scale cohesion (item-total correlation), endorsement rate, and ability to distinguish participants with GAD from those without the diagnosis. A cut-off score of 2/3 out of a maximum total score of 5 on the GAI-SF proved optimal for the identification of GAD. The GAI-SF presented satisfactory results with respect to internal consistency (α = .81), retest reliability (r = .80), and convergent validity indices (r = .48–.88) (Byrne & Pachana, Reference Byrne and Pachana2011). The popularity of the GAI is well reflected by the fact that it has been translated into more than 24 languages (Pachana & Byrne, Reference Pachana and Byrne2012). This includes English and French for Canada, which makes it a convenient tool for use at a national level.
Since the publication of Pachana, Byrne, et al.’s (Reference Pachana, Woodward and Byrne2007) first study on the GAI, much research has been conducted on the psychometric properties of the GAI and GAI-SF in various populations and in different languages. Reviews of this literature (Balsamo, Cataldi, Carlucci, & Fairfield, Reference Balsamo, Cataldi, Carlucci and Fairfield2018; Creighton et al., Reference Creighton, Davison and Kissane2018; Dissanayaka, Torbey, & Pachana, Reference Dissanayaka, Torbey and Pachana2015; Edelstein et al., Reference Edelstein, Woodhead, Segal, Heisel, Bower, Lowery and Stoner2008; Lin et al., Reference Lin, Haralambous, Pachana, Bryant, LoGiudice, Goh and Dow2016; Pachana & Byrne, Reference Pachana and Byrne2012; Therrien & Hunsley, Reference Therrien and Hunsley2012) generally conclude that these measures present sound psychometric properties despite some disparities in the results (e.g., factorial structure, convergent validity) and possible problematic issues (e.g., problematic items, divergent validity, cross-cultural issues). However, none of the reviews evaluated the methodological quality of the studies they examined, which makes it difficult to determine the appropriateness of the findings and to offer guidelines to improve research in this area. Moreover, each review examined only a small portion of studies in light of the available empirical evidence on the GAI and GAI-SF. This is not surprising because most reviews are not dedicated exclusively to the GAI; some are specific to certain populations or settings (e.g., Parkinson’s disease; residential aged care facilities), and new studies have only been published recently.
The goals of this review were to summarize existing evidence on the psychometric properties of the GAI and GAI-SF, to assess the methodological quality of the studies and to provide guidance for future psychometric validation studies. To our knowledge, this was the first systematic review that examined the methodological quality of studies that were conducted on the psychometric properties of these instruments.
Methods
This review targeted published studies that reported data on psychometric properties of the GAI and GAI-SF in older adults. The methodology was guided by the Preferred Reporting Items for Systematic Reviews and Meta-Analyses (PRISMA) statement guidelines (Moher et al., Reference Moher, Shamseer, Clarke, Ghersi, Liberati and Petticrew2015; Moher, Liberati, Tetzlaff, & Altman, Reference Moher, Liberati, Tetzlaff and Altman2009).
Hunsley and Mash (Reference Hunsley and Mash2008) have provided criteria for rating some psychometric results. Internal consistency is considered “adequate” with Cronbach α values of .70–.79, “good” with α values of .80–-.89, and “excellent” with α values equal or greater than .90. Test-retest reliability is considered “adequate” when correlations are of at least .70 over a period of several days to several weeks, “good” when they are of at least .70 over a period of several months, and “excellent” when at least they are of .70 over a period of a year or longer.
Search Strategy
We conducted a literature search using Pubmed, PsycINFO, CINAHL, EMBASE, and Google Scholar as these databases are representative of the literature published on this topic. We made additional efforts to locate relevant studies through a handsearching process. The keywords “Geriatric Anxiety Inventory” in the title and abstract section of the databases was what we used to filter relevant studies. We decided on this approach after conducting different tests (e.g., with broader keywords like “anxiety” or “assessment” or by including them in the “any field” section), which considerably broadened the number of non-relevant articles retrieved. The search was restricted to articles published between January 1, 2007 (the GAI was developed in 2007 [Pachana et al., Reference Pachana, Woodward and Byrne2007]) and December 31, 2018. We retained articles according to the following criteria: (a) written in English or French, (b) presented original empirical research, and (c) expressed the primary objective of exploring the psychometric properties of the GAI and/or the GAI-SF. We excluded the following types of articles because either the information provided was limited or the articles were frequently non-peer reviewed: unpublished manuscripts, editorials, dissertations, theses, randomized controlled trials, case reports, and published abstracts. The first author and a research assistant independently screened the titles and abstracts of the retrieved studies to determine their eligibility. When a disagreement emerged between the two reviewers, a discussion ensued in order to reach a consensus. When necessary, a third reviewer made the decision.
Quality Assessment
We assessed the methodological quality of the included studies with the “COnsensus-based Standards for the selection of health status Measurement Instruments” (COSMIN) checklist (Mokkink, Terwee, Knol, et al., Reference Mokkink, Terwee, Patrick, Alonso, Stratford, Knol and Vet2010; Mokkink, Terwee, Patrick, et al., Reference Mokkink, Terwee, Patrick, Alonso, Stratford, Knol and Vet2010). The COSMIN checklist consists of eight boxes that each refer to a specific measurement property (i.e., internal consistency, reliability, measurement error, content validity, structural validity, hypothesis testing, cross-cultural validity, and responsiveness). Each box contains 5 to 18 items that assess methodological standards, and items are scored on a 4-point rating scale (i.e., poor, fair, good, or excellent) using specific criteria. For example, the fifth item on the internal consistency box assesses whether the unidimensionality of the scale was verified. Criteria proposed by the COSMIN checklist for rating this item follow: a factor analysis was performed in the study population (excellent); the authors refer to another study in which factor analysis was performed in a similar study population (good); authors refer to another study in which factor analysis was performed but not in a similar study (fair); factor analysis was not performed and contains no reference to another study (poor) (for more information on rating, see https://www.cosmin.nl/). For each measurement property, an overall score is determined by taking the lowest rating of any of the box items (worst score counts method; Terwee et al., Reference Terwee, Mokkink, Knol, Ostelo, Bouter and Vet2012). Quality assessment of studies was independently performed by the first author and a research assistant. Discrepancies were resolved through a discussion. When necessary, a third reviewer made the decision.
Data Collection Process
Data extraction was conducted by the first author. Extracted data included basic information about study demographics (e.g., publication year, country in which the study was conducted, language in which the instrument was administered) as well as sample characteristics (e.g., type of sample, sample size, mean age). When available, we collected data on the different measurement properties (e.g., results, statistical methods used, time interval, comparator instruments) defined in the COSMIN checklist. More specifically, these properties were: internal consistency, test-retest reliability, measurement errors, content validity, structural validity (factor analysis), hypothesis testing, cross-cultural validity, criterion validity, and responsiveness.
Results
Search Results
As shown in Figure 1, the database search retrieved a total of 485 articles. Duplicates (n = 232) were removed and of the 253 remaining records, we excluded 222. The main reasons for exclusion were that the GAI or GAI-SF was not the topic of interest (n = 179) or that the article was not presented as an original published manuscript (i.e., conference proceeding; n = 21). Four articles were excluded based on language (i.e., were not written in English or in French). Thus, we retained a final list of 31 articles for the purpose of the current review.

Figure 1: Flow diagram of study selection
Methodological Quality of the Included Studies
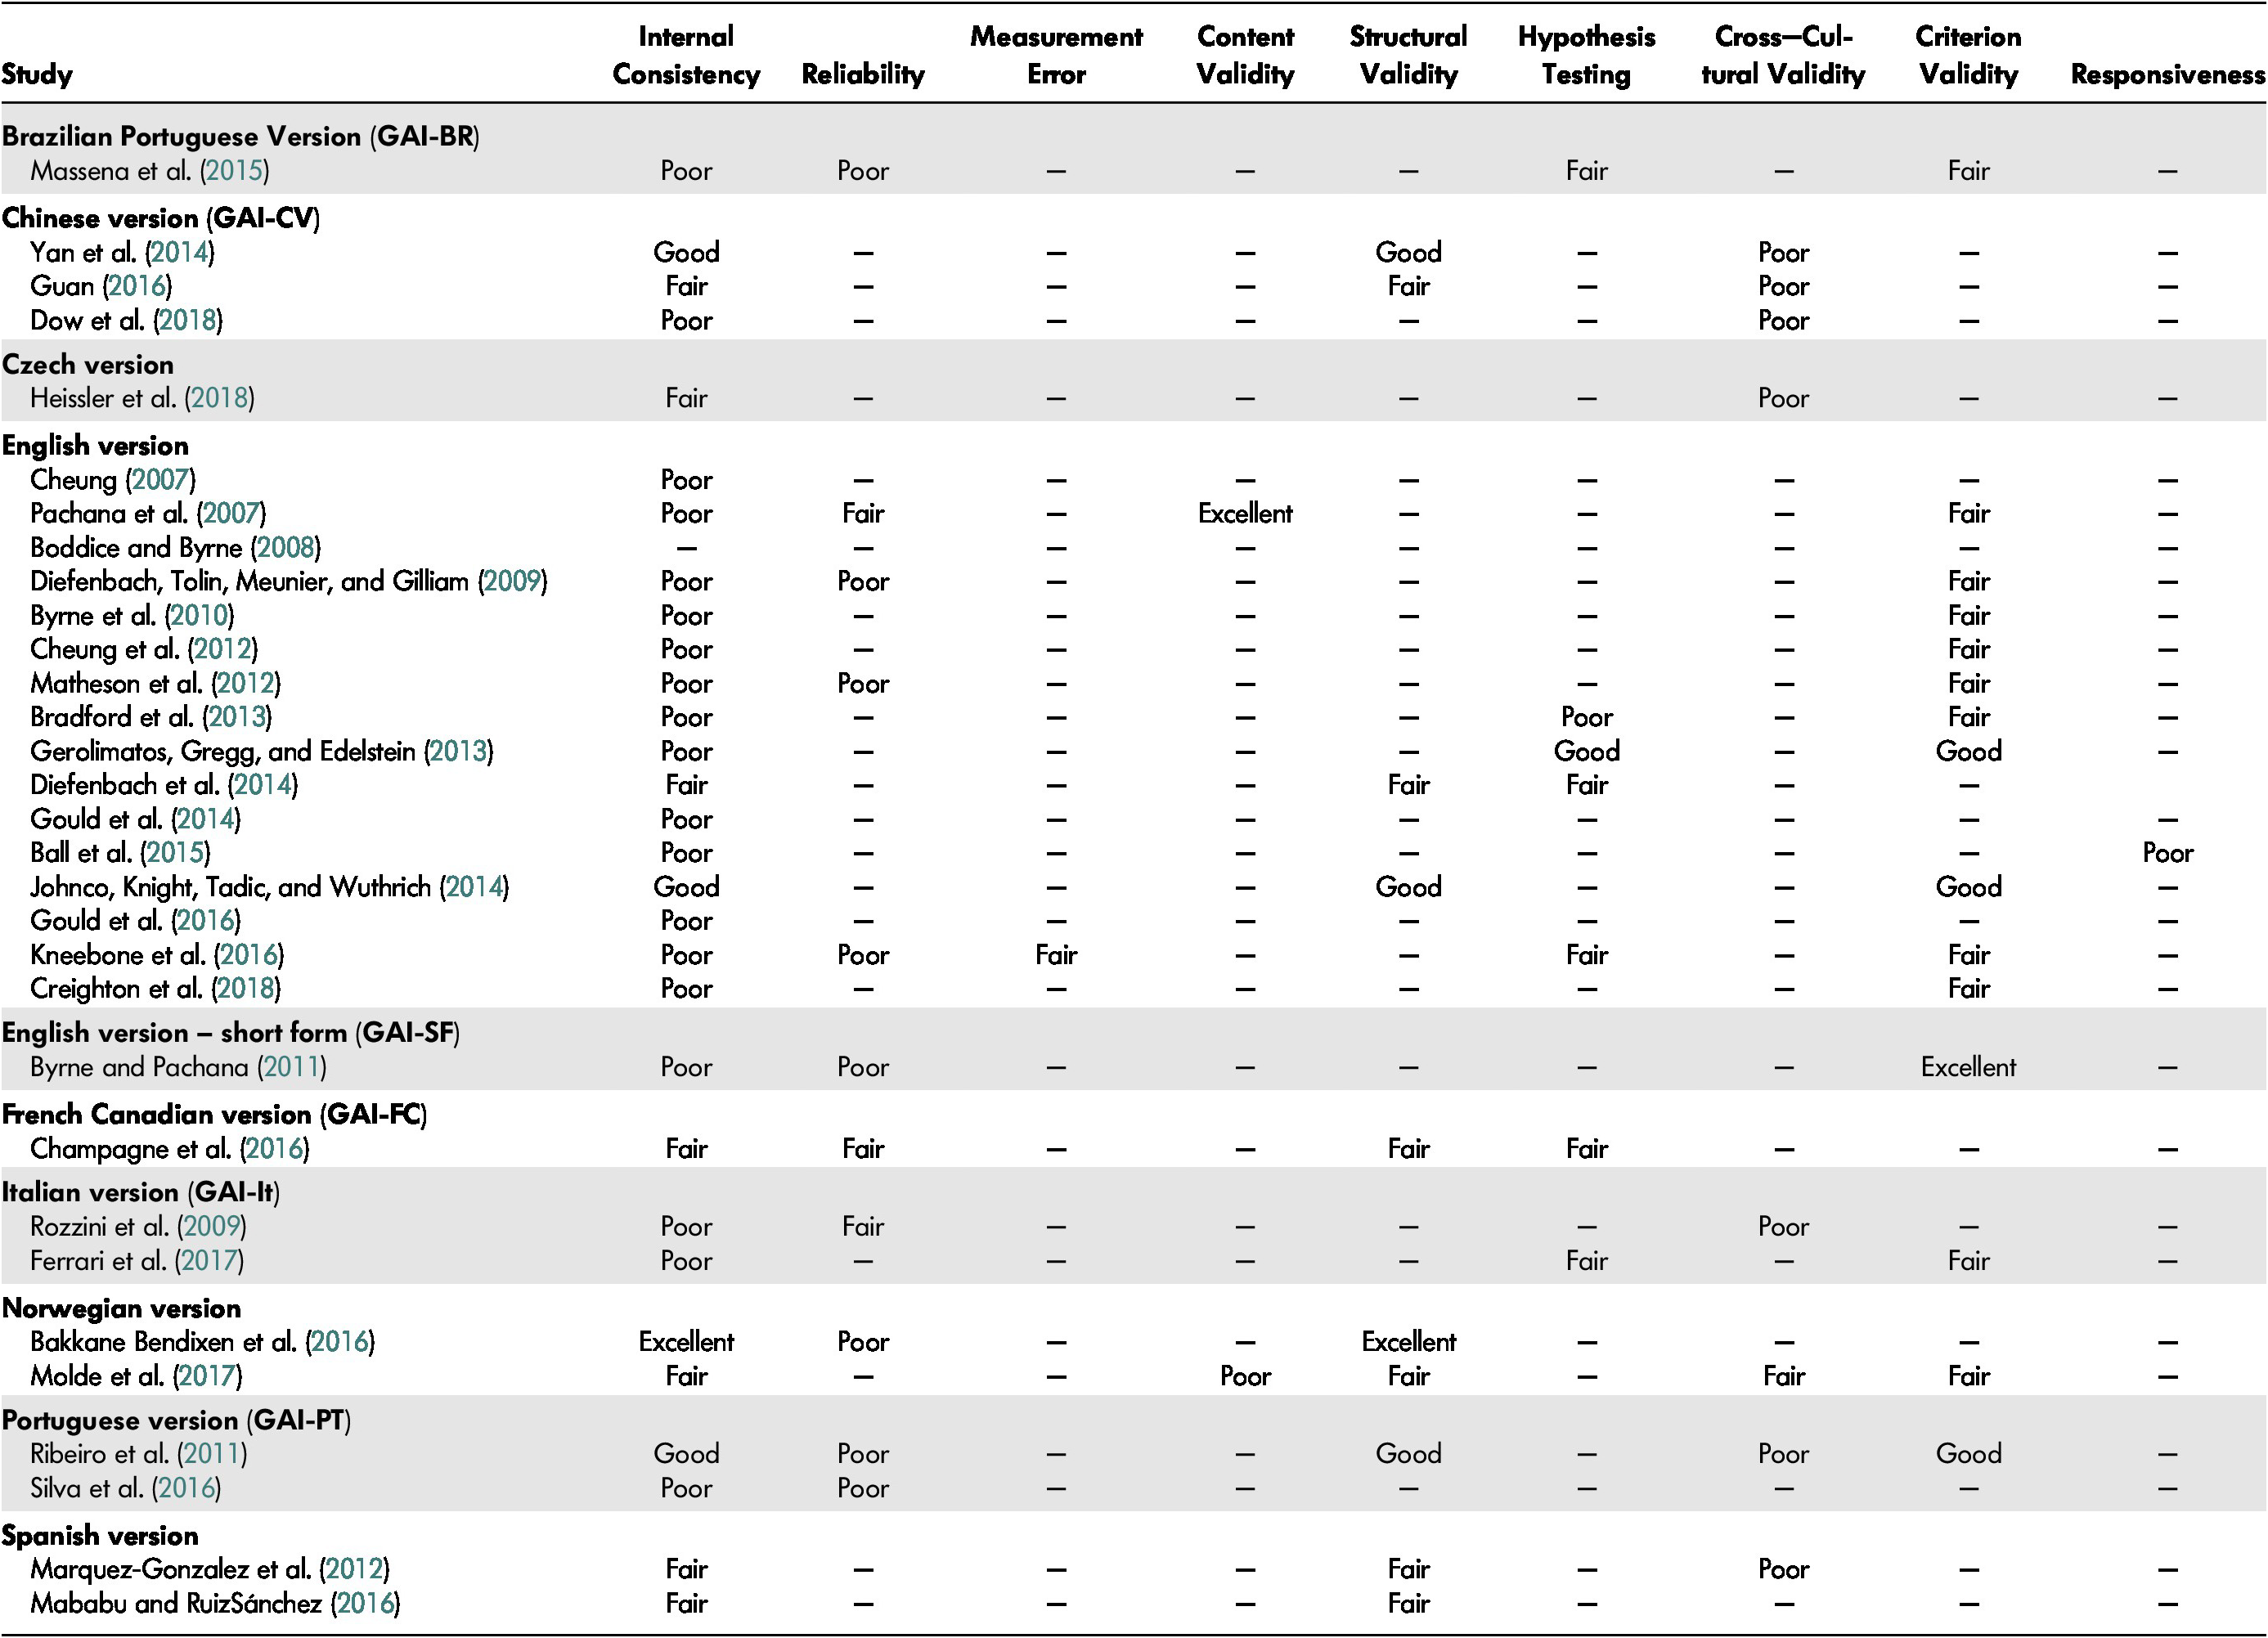
The results of COSMIN ratings for the 31 studies retained are displayed in Table 1. The studies assessed an average of 2.7 psychometric properties out of the nine COSMIN criteria. Most of the COSMIN boxes were rated as having “poor” (43.5%) or “fair” (40%) quality. The most frequent reasons for these ratings were low sample size or a lack of information concerning the number of missing items and how they were handled. This information corresponds to key criteria because it is assessed in almost all COSMIN boxes. Only 11.8 per cent of the rated boxes were rated as having “good” quality, and 4.7 per cent as having “excellent” quality.
Table 1: Methodological quality of each study per measurement property
Study and Participant Characteristics
Basic characteristics of the studies retained for the current review and their samples are presented in Table 2. Psychometric properties of the GAI were examined by 22 studies, while only one study investigated the properties of the GAI’s short form, and eight studies examined both forms. The latter studies generally extracted GAI-SF scores from the GAI. We examined psychometric properties of 15 versions of the GAI: Brazilian Portuguese, Chinese, Czech (long and short forms), English (long and short forms), French Canadian (long and short forms), Italian (long and short forms), Norwegian (long and short forms), Portuguese (long and short forms) and Spanish.
Table 2: Characteristics of the retained studies on the GAI and GAI-SF and their reliability coefficients
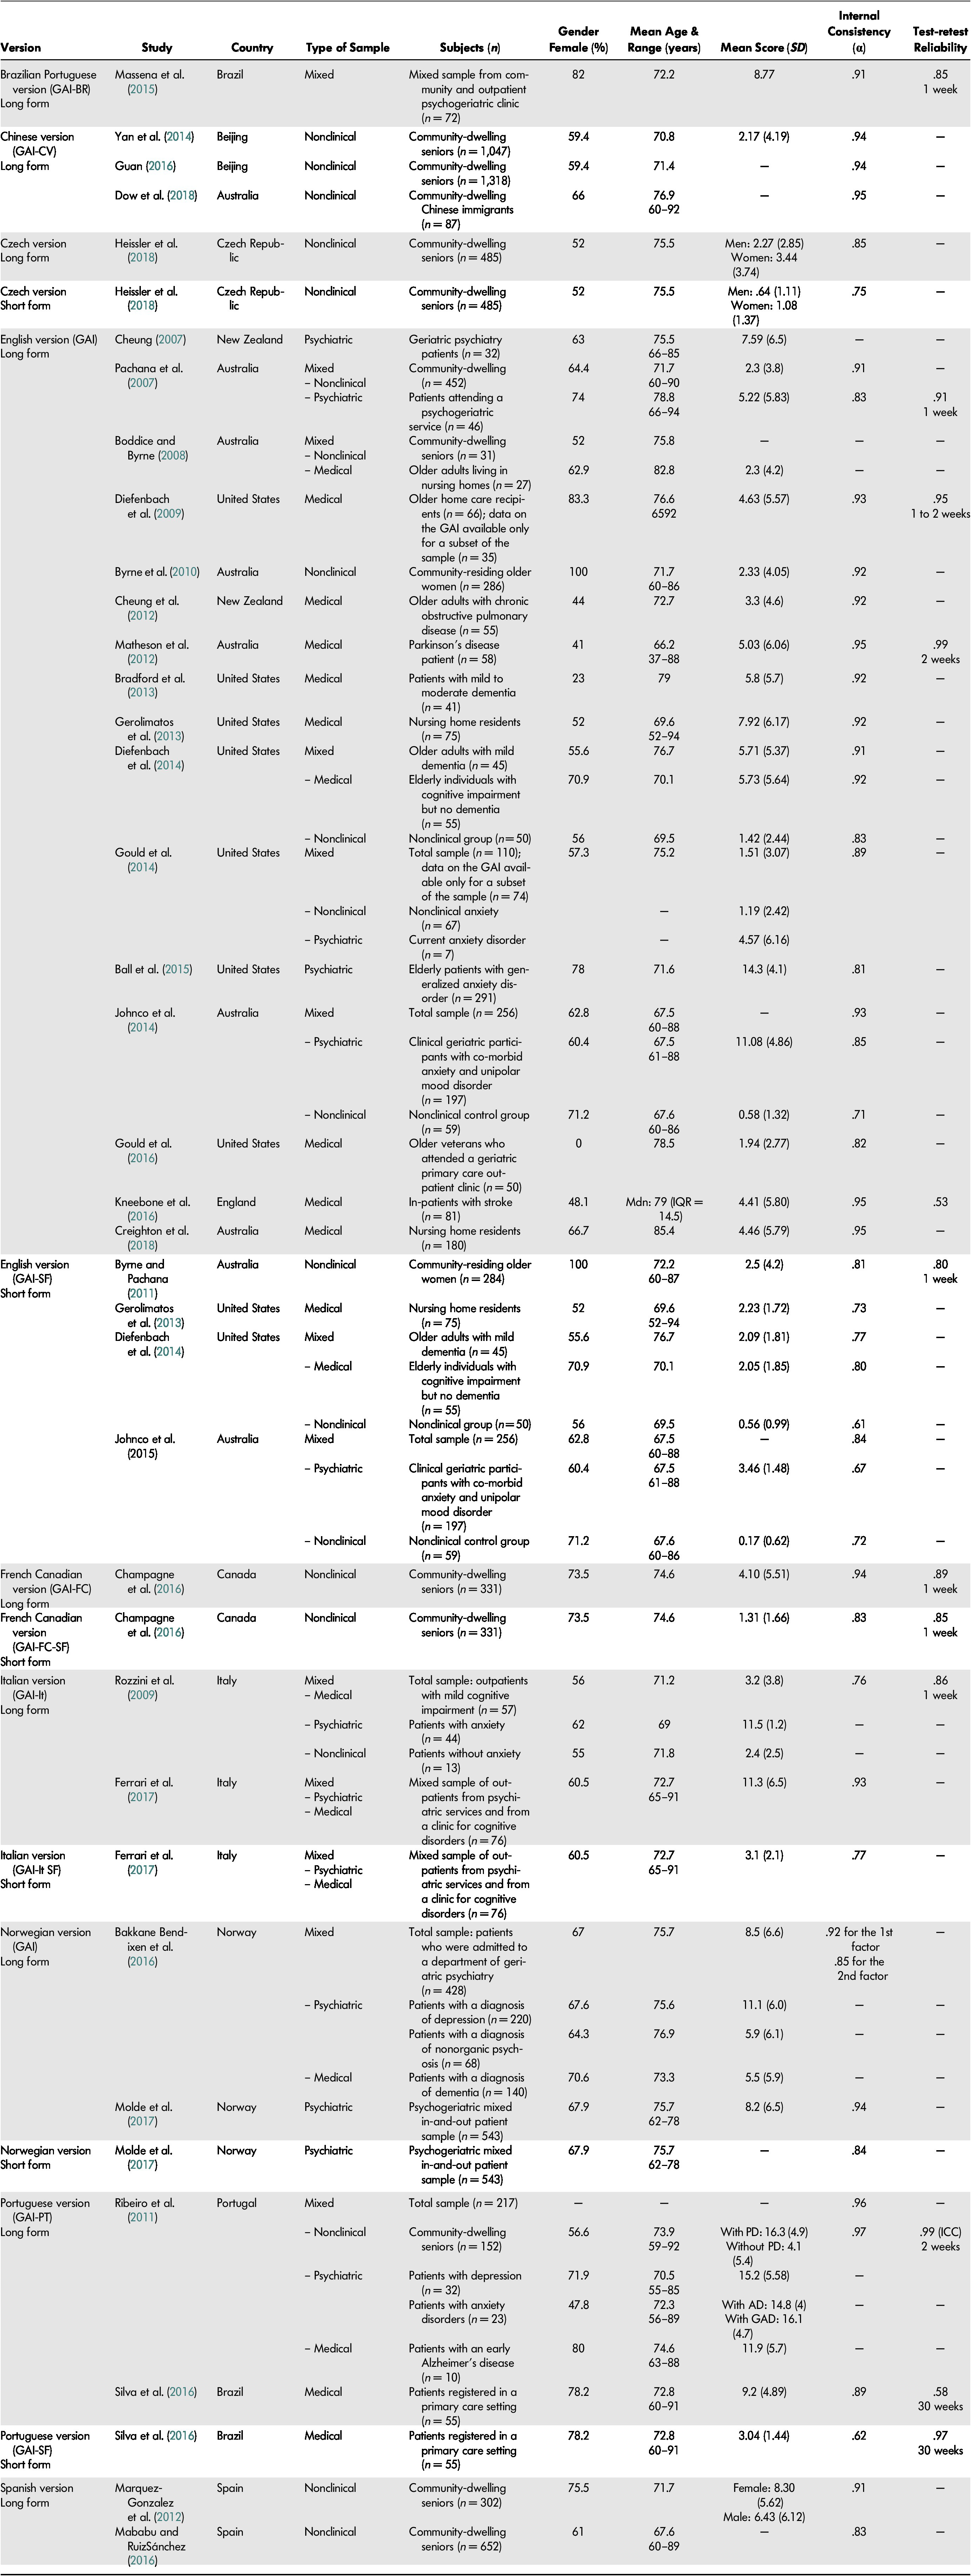
Note. AD = anxiety disorder; GAD = generalized anxiety disorder; IQR = interquartile range; MDN = median; PD = psychological distress.
The 31 retained studies provided data for 8,174 patients who completed the GAI and/or the GAI-SF. Sample sizes ranged from 32 to 1,318 patients. Most studies had samples composed mainly of women (on average, 64.9% of the samples were composed of women). Participants were aged between 52 and 94 years old, excluding participants in the study by Matheson et al. (Reference Matheson, Byrne, Dissanayaka, Pachana, Mellick, O’Sullivan and Marsh2012) that included young adults aged 37 years old and older. Mean age of the participants was 72.5 years. Sample recruitment source was categorized as either non-clinical (e.g., community-dwelling seniors), psychiatric (e.g., in-patient, outpatient, or institutionalized patients, or individuals with a psychiatric diagnosis), medical (i.e., having a medical diagnosis or receiving medical care), or mixed (i.e., different sources of recruitment in the sample). Of the 31 selected studies, nine used mixed samples (non-clinical and/or psychiatric and/or medical). Other studies’ recruitment sources were for the most part exclusively non-clinical (n = 9), medical (n = 9), or, in a smaller proportion, psychiatric (n = 4 studies). Mean scores on the GAI varied between .58 to 16.3, with a mean of 5.5. Those for the GAI-SF ranged between .17 to 3.64, with a mean of 1.8.
Reliability
Internal Consistency. The alpha coefficient of the GAI ranged between .71 and .97 with a mean of .91, and between .61 to .84 with a mean .80 for the GAI short form (see Table 2). According to the COSMIN checklist results, internal consistency was mostly (63%) rated as poorly assessed. The items rated as “poor” referred mostly to the absence of information on missing items and unidimensionality of the scale.
Test-Retest Reliability. Test-retest coefficients (mostly Pearson’s r and the intraclass correlation [ICC]) ranged between .53 to .99 with a mean of .79 for the GAI, and between .80 to .97 with a mean of .90 for the short form (see Table 2). Aside from the two lowest coefficients of the long form (r = .53 and .58; Kneebone, Fife-Schaw, Lincoln, & Harder, Reference Kneebone, Fife-Schaw, Lincoln and Harder2016; Silva et al., Reference Silva, Oliveira, Yokomizo, Saran, Bottino and Yassuda2016), the lowest coefficient was .85. These large differences in the coefficients obtained are difficult to explain, and authors did not comment on their results. In general, the interval of time between the two administrations of the scale was one to two weeks, except in the study of Silva et al. (Reference Silva, Oliveira, Yokomizo, Saran, Bottino and Yassuda2016) in which the interval was 30 weeks. Surprisingly, this longer interval generated a coefficient of r = .58 for the GAI and the highest coefficient for the short form (r = .97).
Test-retest reliability was chiefly rated as poorly assessed (72.7%) according to the COSMIN checklist because of a lack of information concerning missing items, stability of participants, and similarity of test conditions between the two administrations. The COSMIN checklist asks whether there were any important flaws in the study design or method, and in light of certain retest research recommendations, there are several other weaknesses present. In the majority of the studies, little information was provided on sampling and rationale for major decisions that were made (e.g., length of the retest interval). Polit (Reference Polit2014) has suggested that seeking input from patients or experts regarding the stability of the construct being assessed can help support decisions regarding retest interval. Park, Kang, Jang, Lee, and Chang (Reference Park, Kang, Jang, Lee and Chang2018) have recommended that the sample size be about five times the number of items, which was not the case for any of the studies since they generally assessed the retest reliability on a subgroup of the sample. Moreover, the attrition rate for the retest assessment was rarely reported although there is evidence that high rates of attrition can depress reliability estimates (Polit, Reference Polit2014). Although the COSMIN checklist prioritizes the use of the ICC to analyze retest reliability, Vaz, Falkmer, Passmore, Parsons, and Andreou (Reference Vaz, Falkmer, Passmore, Parsons and Andreou2013) made a case to consider measurement error indices such as the coefficient of repeatability (CoR) or the smallest real difference (SRD) over coefficients like the Pearson’s r and the ICC.
Validity
Content Validity. Only two studies addressed content validity. This very low number could be explained by the fact that validation studies may have assumed that items of the GAI and GAI-SF are relevant and comprehensive. As the developers of the GAI, Pachana, Byrne, et al. (Reference Pachana, Woodward and Byrne2007) thoroughly evaluated the content of this scale. Molde et al. (Reference Molde, Hynninen, Torsheim, Bendixen, Engedal, Pachana and Nordhus2017) performed a content analysis on data retrieved from a panel of older adults and a group of clinical psychologists and psychiatrists who were invited to comment on the items. Content validity was rated as “excellent” for the study by Pachana, Byrne, et al. (Reference Pachana, Woodward and Byrne2007) and “poor” for the one by Molde et al. (Reference Molde, Hynninen, Torsheim, Bendixen, Engedal, Pachana and Nordhus2017), according to COSMIN criteria. The latter study obtained such a rating because it is not clear whether all items were assessed to determine whether they comprehensively covered the construct of interest in regard to its theoretical foundation, and whether items were relevant to the purpose of the instrument.
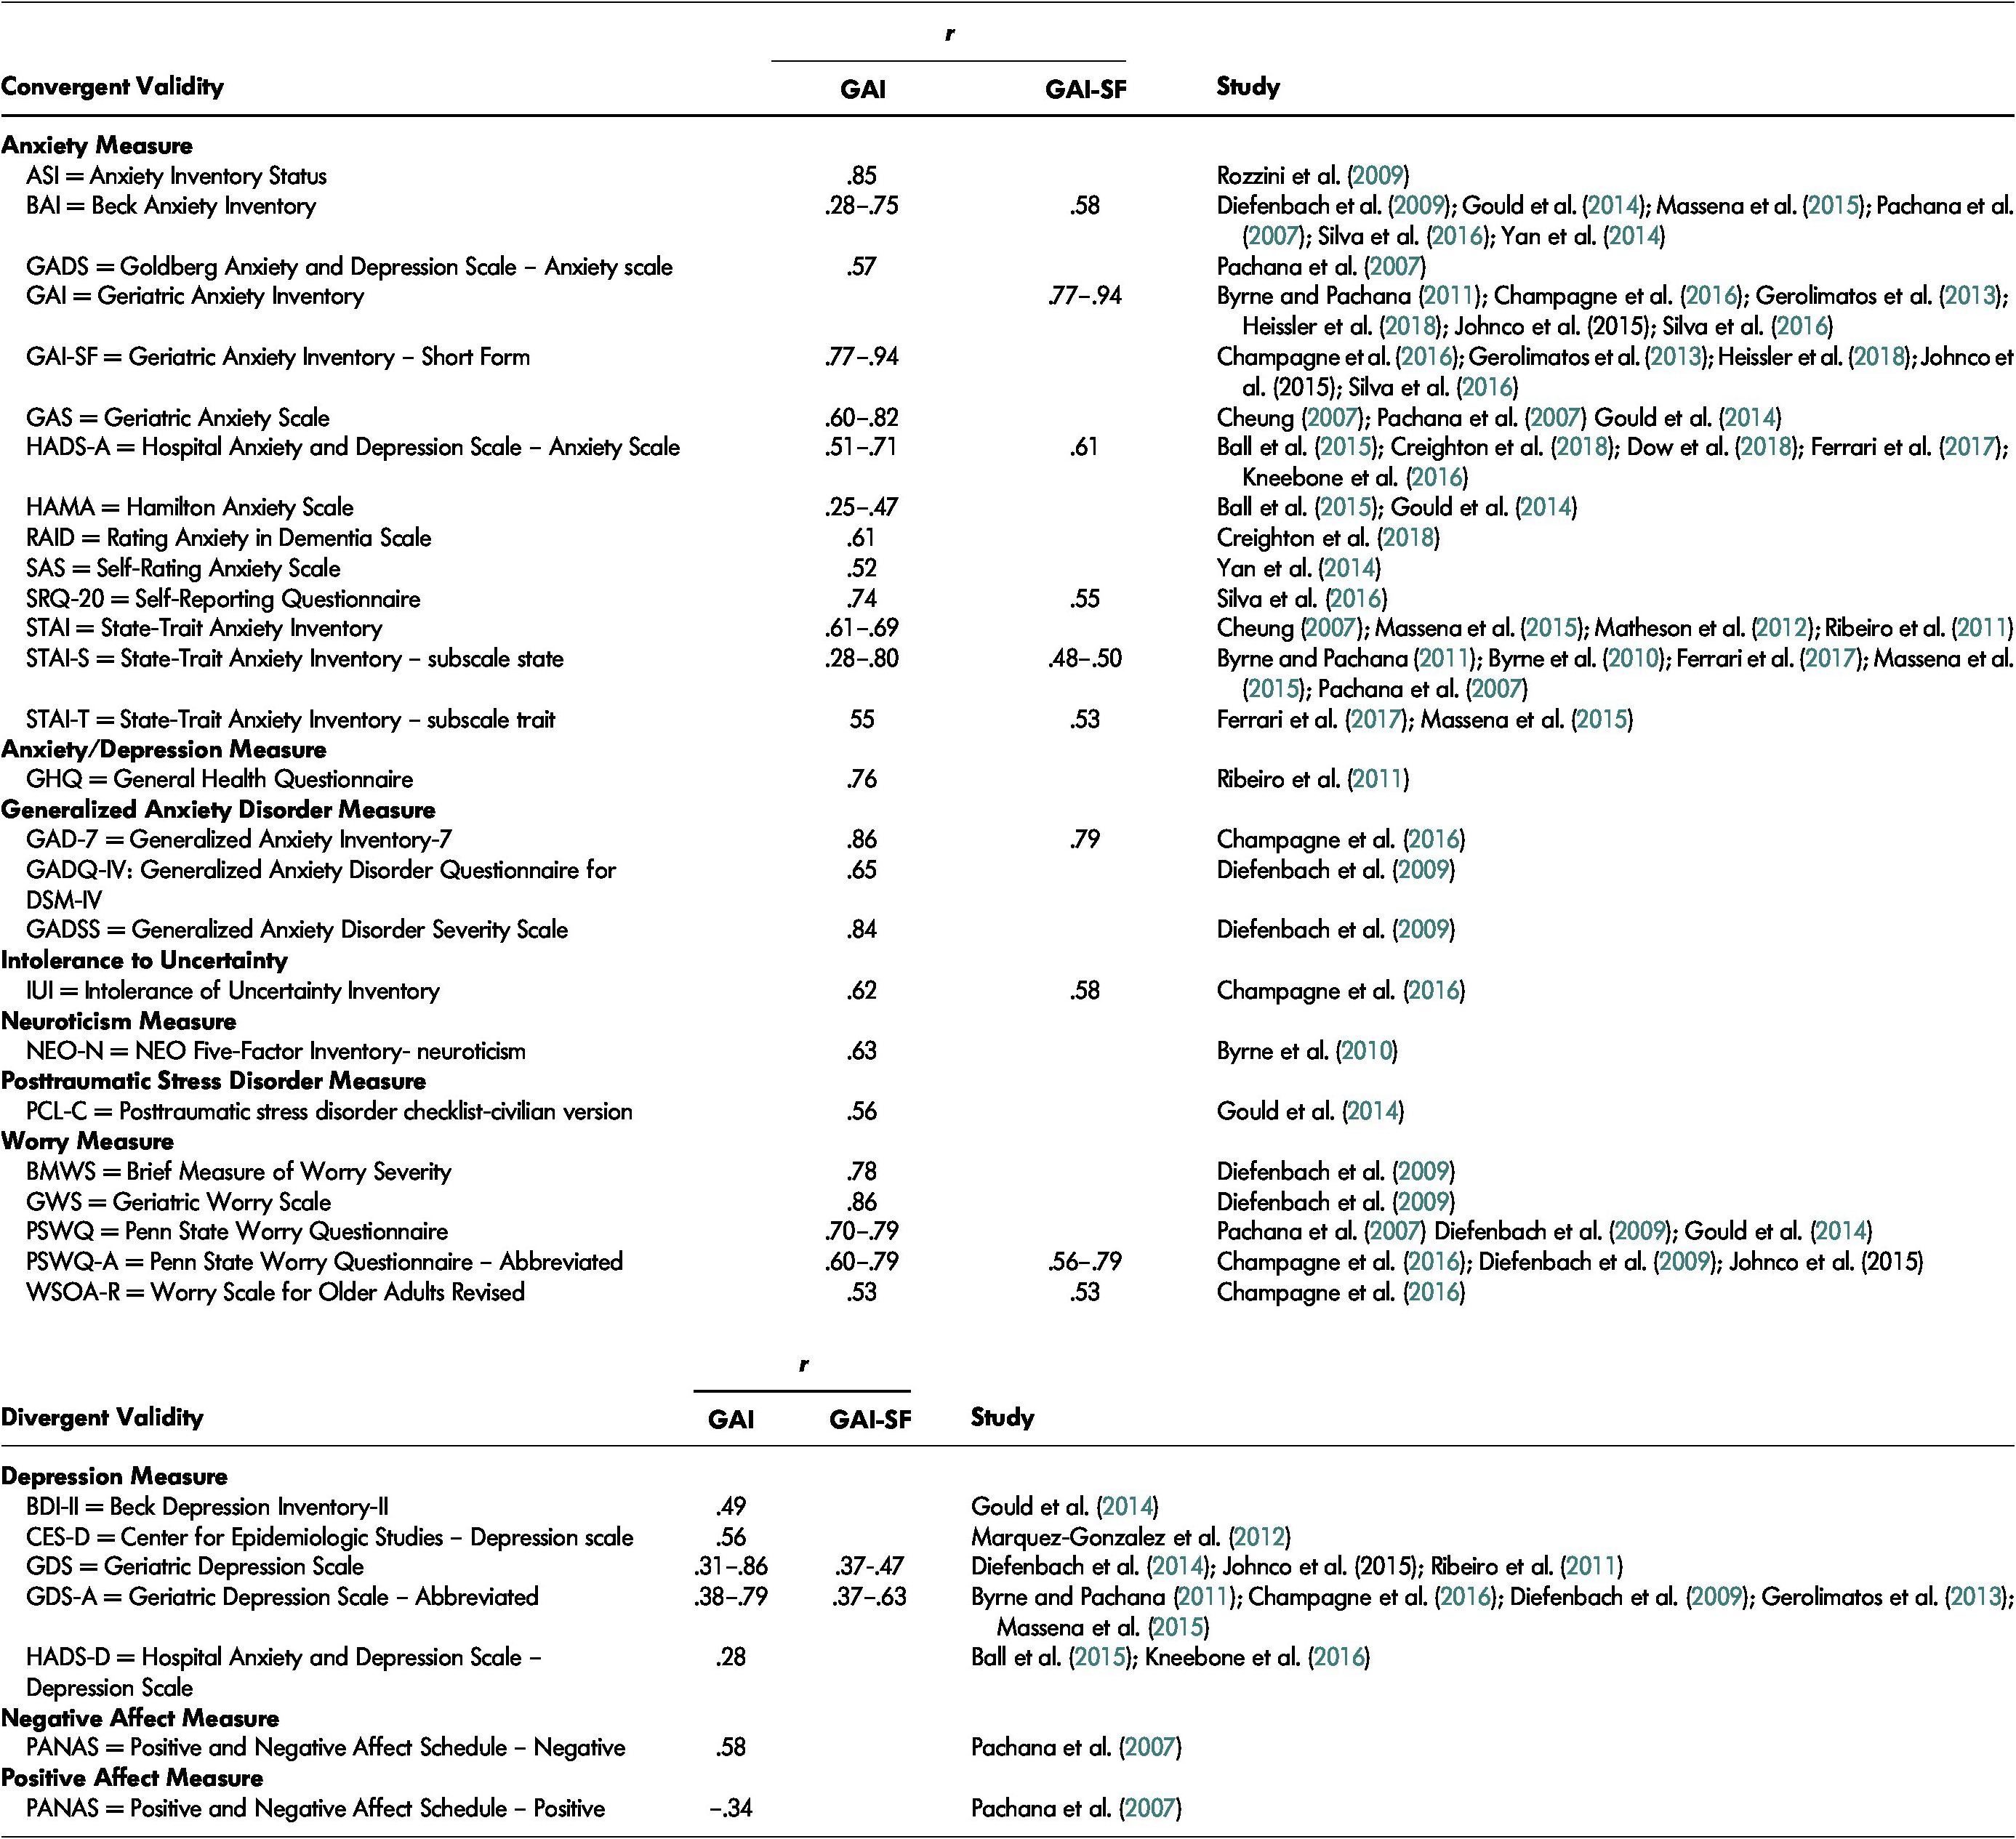
Convergent Validity. Convergent validity has been established between the GAI and GAI-SF and a variety of other instruments that also assess anxiety and related constructs (e.g., symptoms of GAD, worry, general anxiety, or both anxiety and symptoms of depression at the same time). As shown in Table 3, correlations vary between .25 to .86 for the GAI and between .55 to .79 for the short form. Convergent validity with GAD scales appear to be the highest (r = .65 to .86). Data are scarce on the association between the GAI and measures that assess other anxiety disorders. Available evidence reveals only a moderate relationship (r = .56) with a measure of post-traumatic symptoms (Gould et al., Reference Gould, Segal, Yochim, Pachana, Byrne and Beaudreau2014). The weakest associations were found for scales that contain somatic items such as the Hamilton Anxiety Scale (HAMA) (r = .25; Ball, Lipsius, & Escobar, Reference Ball, Lipsius and Escobar2015) and the Beck Anxiety Inventory (BAI) (r = .28; Gould et al., Reference Gould, Segal, Yochim, Pachana, Byrne and Beaudreau2014). In contrast, the GAI focuses predominantly on psychological symptoms. Another low correlation was found with the State-Trait Anxiety Inventory [STAI]-subscale state) (r = .28; Massena, de Araújo, Pachana, Laks, & de Pádua, Reference Massena, Araújo, Pachana, Laks and Pádua2015). The authors explained this result as due to a possible bias in the formulation of the questions of the STAI-state, where symptoms were assessed according to participants’ feelings at the time of the interview rather than those experienced over the past week.
Table 3: Convergent and divergent validity of the GAI and GAI-SF
Convergent validity was not evaluated in depth with the COSMIN checklist because only two items referred to it in the hypothesis test box. For the purpose of this review, we rarely used these items to assess convergent validity since most of the retained studies did not provide hypotheses to test. Despite this, the general trend was that studies provided a poor description of the constructs measured by the comparator instrument. In addition, it was not always clear whether the comparator instrument was an established and validated instrument for use with elderly individuals.
Divergent Validity. We assessed divergent validity in some studies by examining the association with a measure of depression symptoms. Correlations ranged between .28 to .86 for the GAI and between .37 to .63 for the short form (see Table 3). The lowest correlations (r = .28) between the GAI and the Hospital Anxiety and Depression Scale – Depression Scale (HADS-D) are explained by the fact that patients with major depressive disorder were excluded (Ball et al., Reference Ball, Lipsius and Escobar2015) and by the low prevalence of depression symptoms (Kneebone et al., Reference Kneebone, Fife-Schaw, Lincoln and Harder2016). These results suggest that there may exist different patterns of divergent validity where highly uniform samples with low rates of depression symptoms could facilitate distinction from anxiety symptoms assessed with the GAI and GAI-SF.
Diefenbach, Bragdon, and Blank (Reference Diefenbach, Bragdon and Blank2014) and Bakkane Bendixen, Hartberg, Selbæk, and Engedal (Reference Bakkane Bendixen, Hartberg, Selbæk and Engedal2016) shed new light on the association between the GAI and GAI-SF and measures of depression. Diefenbach et al. (Reference Diefenbach, Bragdon and Blank2014) found that depressive symptoms were more strongly correlated with the “central nervous system hyperarousal” factor and to a lesser extent with “gastrointestinal symptoms”. These results suggest that there may be a certain response pattern in patients with greater co-morbid depressive symptoms. Bakkane Bendixen et al. (Reference Bakkane Bendixen, Hartberg, Selbæk and Engedal2016) found that in comparison to those with dementia or psychosis, a group of patients with depression present a different pattern of results on the GAI; that is, with a higher total score and a higher endorsement of 18 of the 20 items (except items 3 and 18).
Factorial Validity. The GAI was first described as being unidimensional although no factor analysis was presented to support this assumption (Byrne & Pachana, Reference Byrne and Pachana2011; Pachana, Byrne, et al., Reference Pachana, Woodward and Byrne2007). Ten studies investigated the factorial validity of the GAI and half of them confirmed the one-factor structure (Champagne, Landreville, Gosselin, & Carmichael, Reference Champagne, Landreville, Gosselin and Carmichael2016; Johnco, Knight, Tadic, & Wuthrich, Reference Johnco, Knight, Tadic and Wuthrich2014; Molde et al., Reference Molde, Hynninen, Torsheim, Bendixen, Engedal, Pachana and Nordhus2017; Ribeiro, Paul, Simoes, & Firmino, Reference Ribeiro, Paul, Simoes and Firmino2011; Yan, Xin, Wang, & Tang, Reference Yan, Xin, Wang and Tang2014).
The other five studies that investigated the factorial validity of the GAI found a two-factor structure (Bakkane Bendixen et al., Reference Bakkane Bendixen, Hartberg, Selbæk and Engedal2016), a three-factor structure (Guan, Reference Guan2016; Mababu & RuizSánchez, Reference Mababu and RuizSánchez2016; Marquez-Gonzalez, Losada, Fernandez-Fernandez, & Pachana, Reference Marquez-Gonzalez, Losada, Fernandez-Fernandez and Pachana2012), and a four-factor structure (Diefenbach et al., Reference Diefenbach, Bragdon and Blank2014) (see Table 4). The identified factors can be grouped into three categories: (a) cognitive symptoms (includes the following factors: worries, excessive worry symptoms, decision-making symptoms, and mental anxiety), (b) physical symptoms of anxiety (includes the following factors: central nervous system hyperarousal, arousal and somatic symptoms), and (c) negative anxiety. Cognitive and physical symptoms of anxiety were found across all five studies. In contrast, negative anxiety, which refers to the motives and behaviours related to anxiety disorders, was found only by Guan (Reference Guan2016). Most of the GAI items were not consistently associated with the same symptom category. Only items 1 – “I worry a lot of the time” – and 2 – “I find it difficult to make a decision” – were always related to cognitive symptoms and items 12 – “I get an upset stomach due to my worrying” – and 18 – “I sometimes feel a great knot in my stomach” – were always associated with physical symptoms. This variability may be due to the type of sample (i.e., three studies used non-clinical samples; one, a mixed sample of psychiatric and medical patients; and one, composed of elderly people with cognitive impairment) and cultural differences because four versions were used (Norwegian, English, Spanish, and Chinese).
Table 4: Factors associated with each item of the GAI
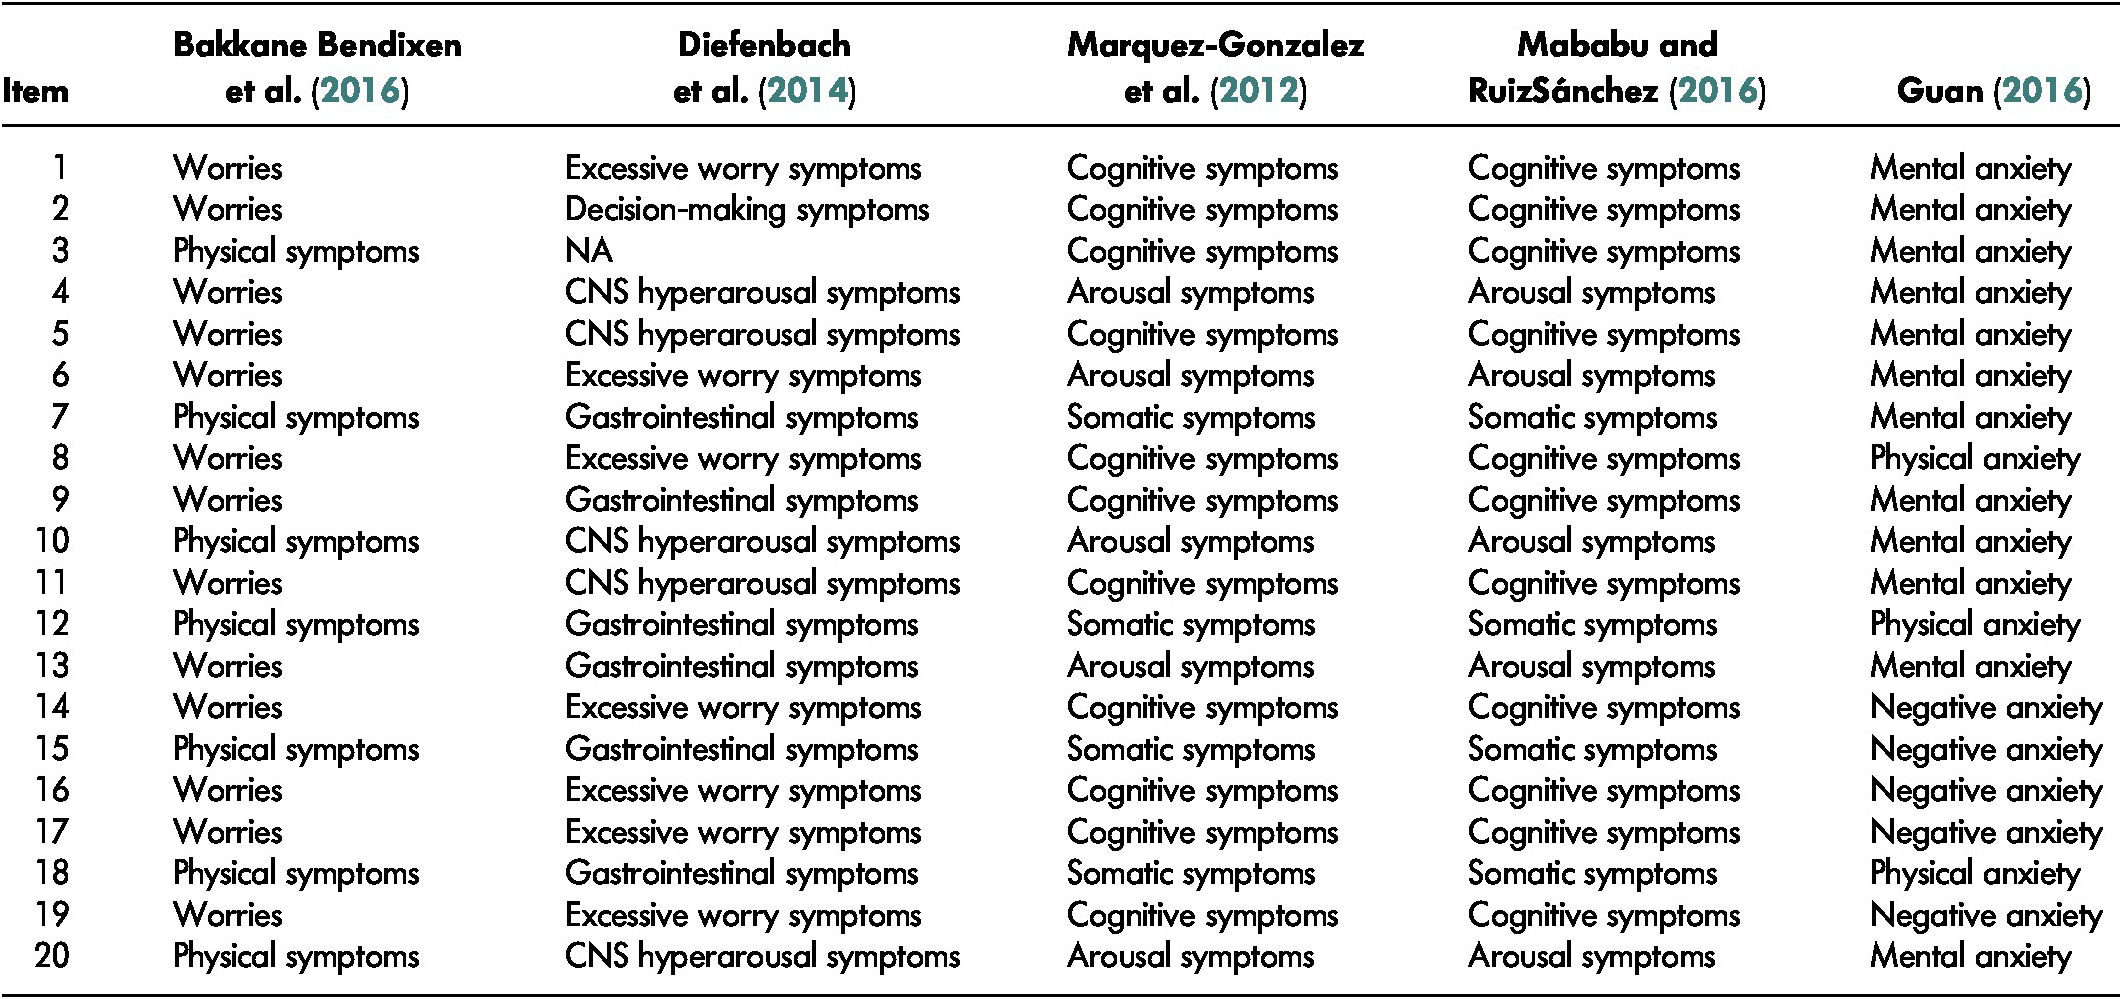
Note. CNS = central nervous system; NA = not available.
Four studies investigated the factor structure of the GAI-SF and all confirmed its unidimensionality (Champagne et al., Reference Champagne, Landreville, Gosselin and Carmichael2016; Diefenbach et al., Reference Diefenbach, Bragdon and Blank2014; Johnco et al., Reference Johnco, Knight, Tadic and Wuthrich2014; Molde et al., Reference Molde, Hynninen, Torsheim, Bendixen, Engedal, Pachana and Nordhus2017). Most items with high factor loadings referred to cognitive symptoms of anxiety.
Criterion Validity. At first, Pachana, Byrne, et al. (Reference Pachana, Woodward and Byrne2007) recommended a GAI cut-off score of 9 for the identification of any anxiety disorder and of 11 for the detection of GAD. Further studies suggested cut-off scores that varied between 3 and 13 out of 20 for the identification of an anxiety disorder (see Table 5). Multiple factors can explain this variability such as the type of sample (non-clinical vs. clinical), the proportion of patients who actually met the criteria for an anxiety disorder, cultural differences in the expression of anxiety, and the external criterion used for the diagnosis. The much lower cut-off score of 3 found by Cheung, Patrick, Sullivan, Cooray, and Chang (Reference Cheung, Patrick, Sullivan, Cooray and Chang2012) may be attributable to differences in the nature of the sample as their participants had chronic obstructive pulmonary disease; the mean score on the GAI was low (M = 3.3; SD = 4.6) as was the proportion of participants with an anxiety disorder (25.5%). Test sensitivity values for the GAI ranged between 30 and 100 per cent; while specificity values ranged between 43 and 100 per cent. The area under the ROC curve (AUC) ranged between 79 and 98.1.
Table 5: Criterion validity and cut-off point of the GAI and GAI-SF
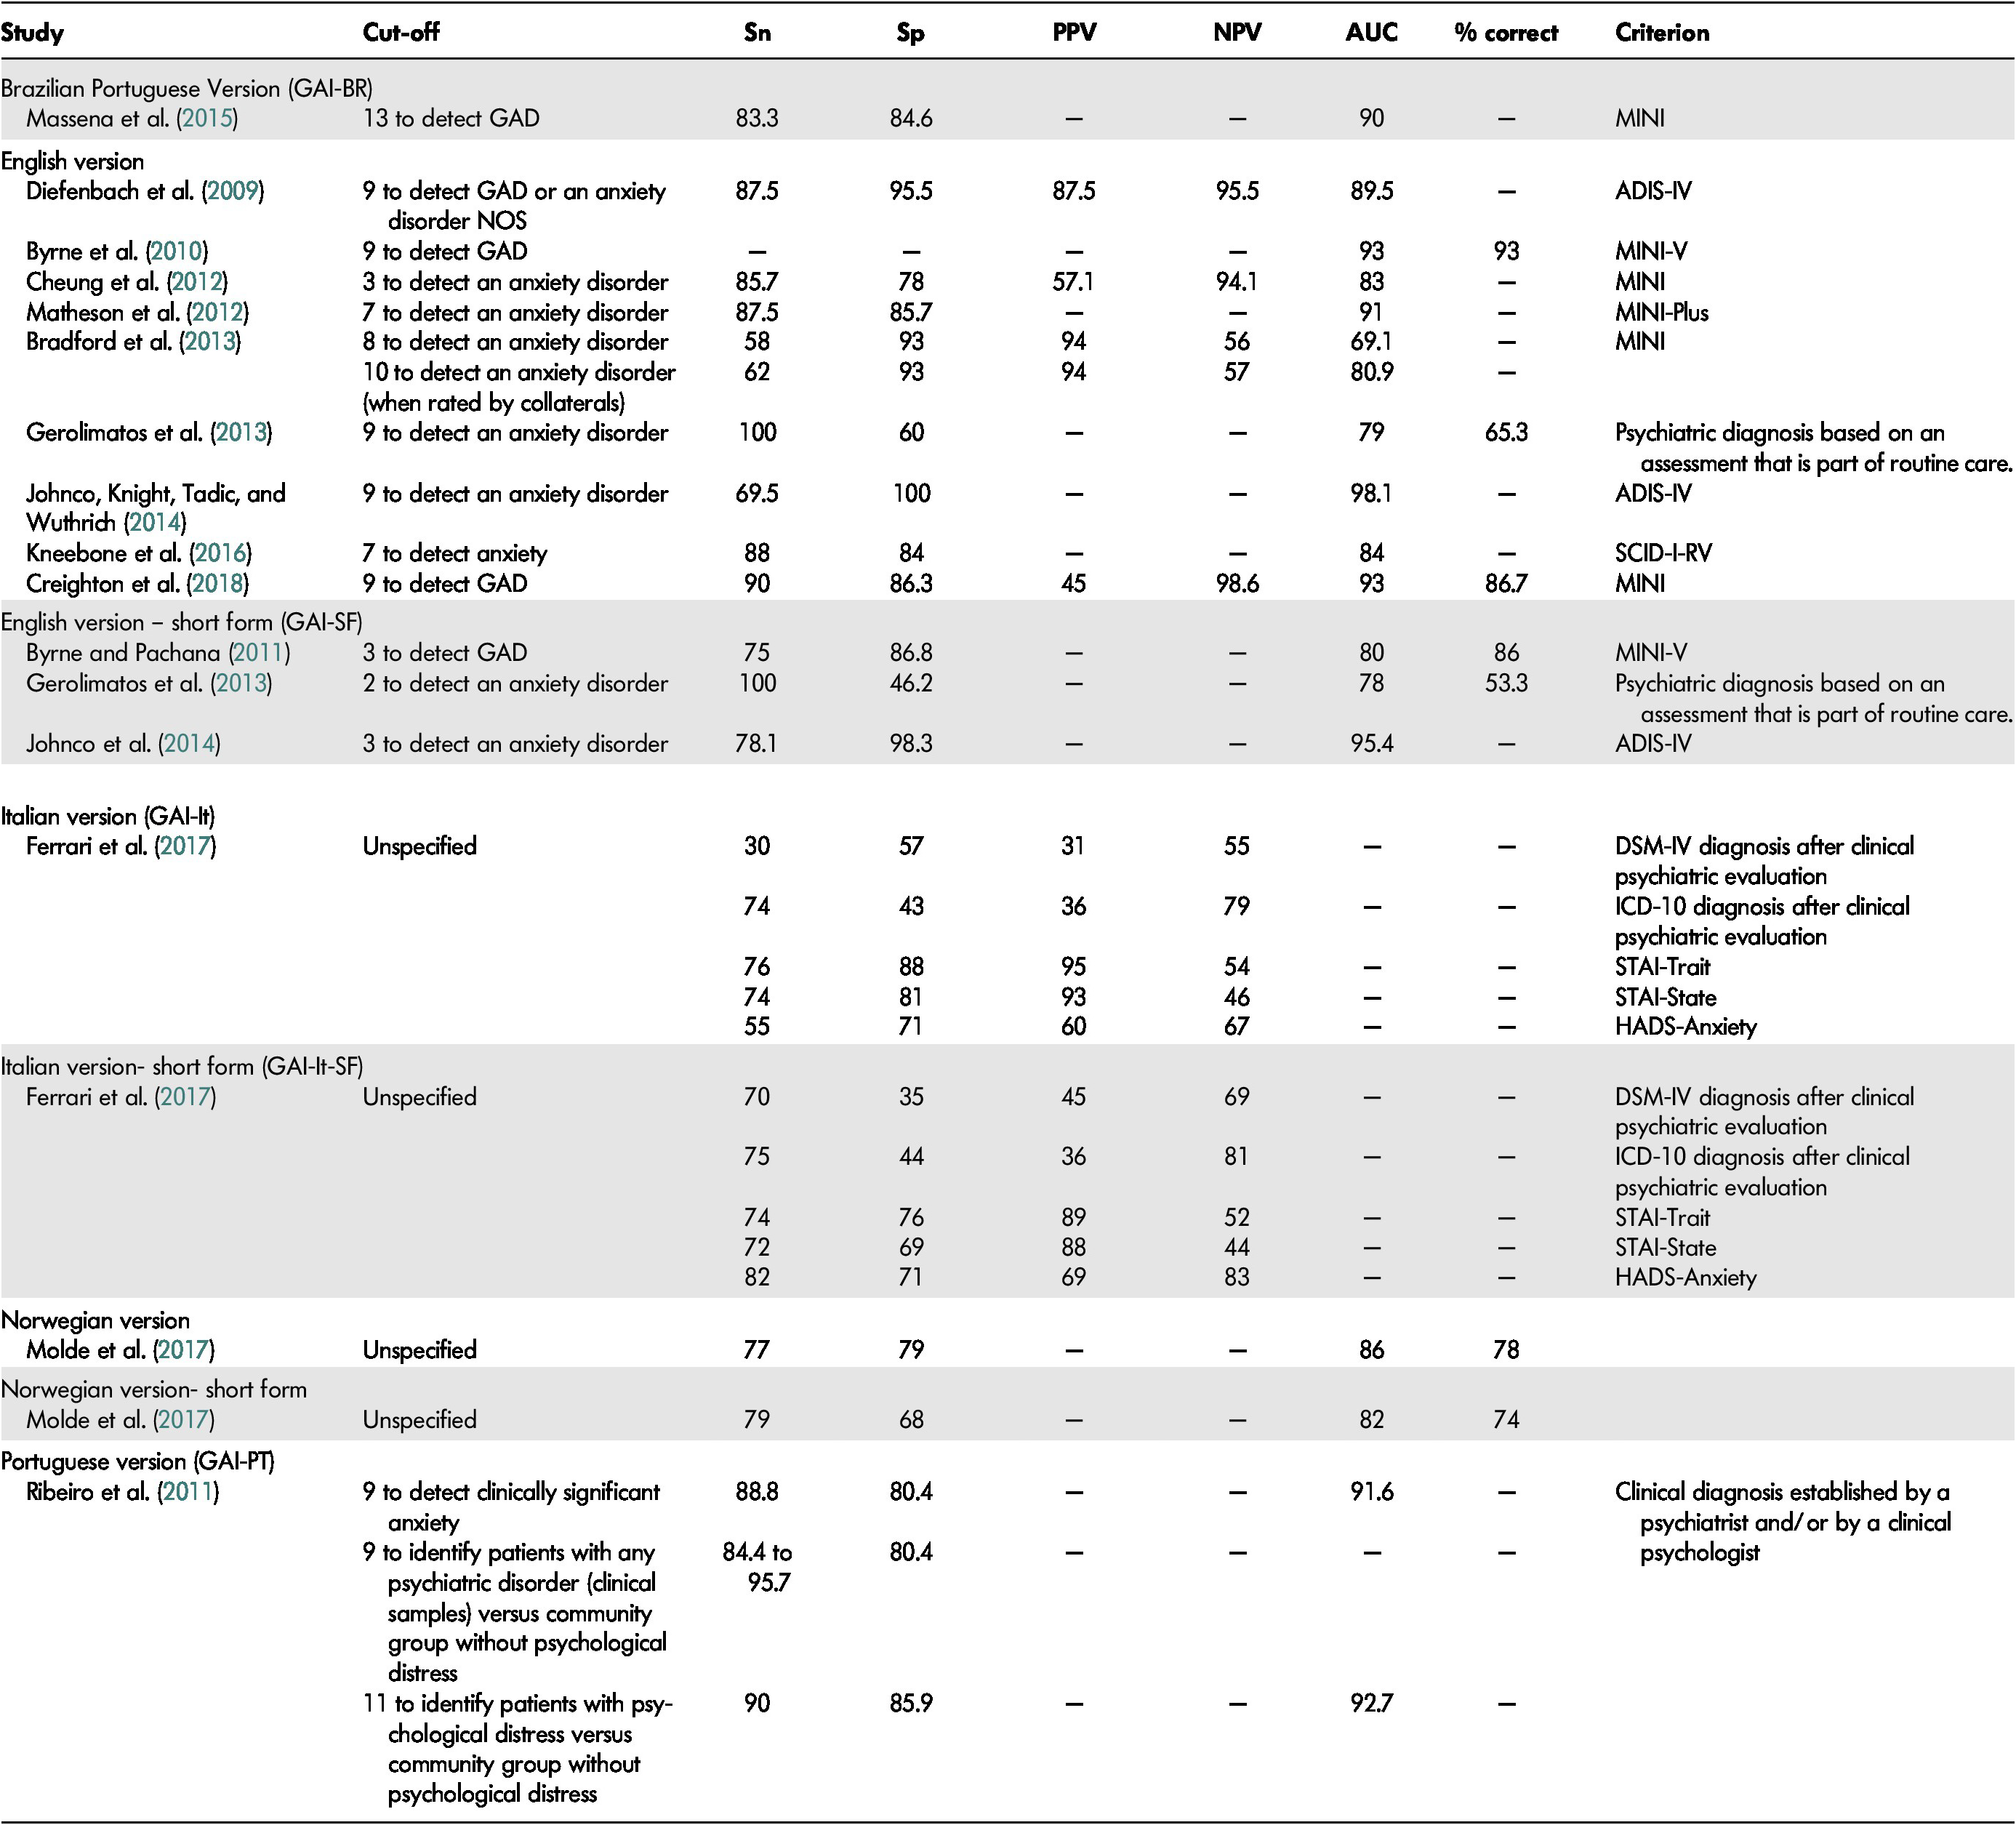
Note. ADIS-IV = Anxiety Disorder Interview Schedule for DSM-IV; AUC = area under the curve; GAD = generalized anxiety disorder; ICD-10 = International Classification of Diseases, 10th Edition; MINI = Mini International Neuropsychiatric Interview; NOS = not otherwise specified; NPV = negative predictive value; PPV = positive predictive value; SCID-I-RV = Structured Clinical Interview for DSM-IV Axis 1 Disorders: Research; Sn = sensitivity; Sp = specificity.
For the GAI short form, a score of 3 or more was originally found to be optimal for the detection of GAD in a non-clinical sample (Byrne & Pachana, Reference Byrne and Pachana2011). Results of subsequent studies were similar with optimal thresholds at 2 to 3 out of 5 for the identification of an anxiety disorder. Sensitivity varied between 72 and 100 per cent and specificity ranged between 35 and 98.3 per cent. The AUC ranged between 78 and 95.4.
With regard to the different diagnostic parameters, the performance of the standard and short forms of the GAI seemed quite comparable. According to the COSMIN checklist, we largely rated criterion validity as “fair” for different reasons (e.g., no information on how missing items were handled; unclear if the criterion was a “gold standard”).
Sensitivity to Change and Responsiveness
To our knowledge, only Ball et al. (Reference Ball, Lipsius and Escobar2015) explicitly assessed sensitivity to treatment of the GAI in a clinical controlled trial. They concluded that the GAI is a useful tool for monitoring the outcome of treatment. According to the COSMIN checklist, responsiveness was rated as “poor” because no analyses were conducted between the score on the GAI and the gold standard to demonstrate the good performance of the former. Although it wasn’t their primary aim, there are studies that support the sensitivity to change of the GAI in the treatment monitoring of anxiety or specific phobia (Pachana, Woodward, & Byrne, Reference Pachana, Woodward and Byrne2007; Welch et al., Reference Welch, Welch, Baer, Dias, Gurney, Van Dale and Psiurski2010).
Problematic Issues
Cross-Cultural Adaptation. Simple translation of a questionnaire is insufficient if it is to be used with a population from another country, culture, or language. In such cases, cross-cultural adaptation of the instrument is recommended (Gjersing, Caplehorn, & Clausen, Reference Gjersing, Caplehorn and Clausen2010). Studies conducted with other language versions of the GAI generally report information on the translation process but most do not report having culturally adapted the instrument.
Potentially Problematic Items. Some authors have pointed out that item 12 – “I get an upset stomach due to my worrying” – is problematic and not precise enough (Champagne et al., Reference Champagne, Landreville, Gosselin and Carmichael2016; Molde et al., Reference Molde, Hynninen, Torsheim, Bendixen, Engedal, Pachana and Nordhus2017; Yan et al., Reference Yan, Xin, Wang and Tang2014). This item may present a limitation due to its cultural validity. Alternatively, it may be difficult for older adults to consider an upset stomach as a consequence of worrying. It is also possible that this symptom is endorsed only by some individuals because it refers to a more severe level of anxiety.
Other authors have questioned whether certain items truly assess the construct of interest. For example, item 2 – “I find it difficult to make a decision” – was reported as being insufficiently precise and having low corrected item-total correlations (Gould et al., Reference Gould, Segal, Yochim, Pachana, Byrne and Beaudreau2014; Yan et al., Reference Yan, Xin, Wang and Tang2014). Researchers have proposed that this item may instead assess decision-making abilities that aren’t necessarily related to worry. For the same reasons, authors have questioned whether item 18 “I sometimes feel a great knot in my stomach” assesses anxiety or a symptom of a general medical condition (Gould et al., Reference Gould, Segal, Yochim, Pachana, Byrne and Beaudreau2014; Heissler, Kopecek, & Stepankova Georgi, Reference Heissler, Kopecek and Stepankova Georgi2018; Yan et al., Reference Yan, Xin, Wang and Tang2014). Gould et al. (Reference Gould, Segal, Yochim, Pachana, Byrne and Beaudreau2014) have also indicated that item 7 – “I often feel like I have butterflies in my stomach” – and 14 – “I always anticipate the worst will happen” – may be endorsed for reasons unrelated to anxiety.
Results from Rasch models in Molde et al. (Reference Molde, Hynninen, Torsheim, Bendixen, Engedal, Pachana and Nordhus2017) identified substantial item overlap between item-pairs 10 (“I often feel nervous”) and 15 (“I often feel shaky inside”), 7 (“I often feel like I have butterflies in my stomach”) and 18 (“I sometimes feel a great knot in my stomach”), 10 (“I often feel nervous”) and 13 (“I think of myself as a nervous person”), 6 (“Little things bother me a lot”) and 9 (“I can’t help worrying about even trivial things”), 1 (“I worry a lot of the time”) and 8 (“I think of myself as a worrier”), and 16 (“I think that my worries interfere with my life”) and 17 (“My worry often overwhelms me”). To a certain extent, the same phenomenon of redundancy was observed for items 8, 10, and 11 of the GAI short version. Thus, the detected item overlap suggests that there may be redundant items in the GAI and the GAI-SF that do not provide any additional information because of their similar content (Molde et al., Reference Molde, Hynninen, Torsheim, Bendixen, Engedal, Pachana and Nordhus2017).
Floor Effects. Some authors have made assumptions about the possible presence of floor effects in the GAI and GAI-SF. Yan et al. (Reference Yan, Xin, Wang and Tang2014) and Johnco et al. (Reference Johnco, Knight, Tadic and Wuthrich2014) hypothesized the presence of floor effects when they observed that the GAI may be less suitable for elderly people with low-level anxiety as this would mean that they would not endorse several items suggesting high-level anxiety and serious outcomes.
Discussion
Since their development, the GAI and, to a lesser extent, the GAI-SF, have undergone extensive psychometric testing in a wide range of populations and countries. These tools have been the subject of different reviews (Balsamo et al., Reference Balsamo, Cataldi, Carlucci and Fairfield2018; Creighton et al., Reference Creighton, Davison and Kissane2018; Dissanayaka et al., Reference Dissanayaka, Torbey and Pachana2015; Edelstein et al., Reference Edelstein, Woodhead, Segal, Heisel, Bower, Lowery and Stoner2008; Lin et al., Reference Lin, Haralambous, Pachana, Bryant, LoGiudice, Goh and Dow2016; Pachana & Byrne, Reference Pachana and Byrne2012; Therrien & Hunsley, Reference Therrien and Hunsley2012). However, these reviews were mostly dedicated to the GAI long form and examined in specific populations or settings (e.g., Parkinson’s disease; residential aged care facilities). Moreover, these reviews examined only a small sample of studies. The study that reviewed the largest number of articles on the GAI included only 18 (Balsamo et al., Reference Balsamo, Cataldi, Carlucci and Fairfield2018), a number that is almost half of what our own search retrieved.
The goals of our study were to summarize existing evidence on the psychometric properties of the GAI and GAI-SF, to assess the methodological quality of the studies and to provide guidance for future psychometric validation studies. For the current review, we identified 31 studies that purposely studied the psychometric properties of these scales. As in reviews by other researchers (Balsamo et al., Reference Balsamo, Cataldi, Carlucci and Fairfield2018; Creighton et al., Reference Creighton, Davison and Kissane2018; Dissanayaka et al., Reference Dissanayaka, Torbey and Pachana2015; Edelstein et al., Reference Edelstein, Woodhead, Segal, Heisel, Bower, Lowery and Stoner2008; Lin et al., Reference Lin, Haralambous, Pachana, Bryant, LoGiudice, Goh and Dow2016; Pachana & Byrne, Reference Pachana and Byrne2012; Therrien & Hunsley, Reference Therrien and Hunsley2012), we generally found appropriate psychometric properties for the GAI and GAI-SF among various clinical and non-clinical populations of older adults. However, we also mostly found low levels of methodological quality in the studies retained for this review.
To our knowledge, this is the first systematic review to examine the methodological quality of research conducted on the psychometric properties of the GAI and GAI-SF. The majority of the COSMIN boxes were rated as “poor” or “fair” (83.5% of all boxes) for the different psychometric properties evaluated. The results of studies with low methodological quality were not ignored in this review. A “poor” or “fair” methodological quality score indicates a certain risk of bias in the results but does not necessarily mean that findings are in fact biased or invalid. For example, the most frequent reasons for these ratings were low sample size and a lack of information on the number of missing items and how they were handled. Even though information on missing items was lacking, it still could have been correctly managed in an effort to avoid introducing bias into the study results. It is also important to note that results of studies that presented a “poor” versus “good” or “excellent” level of methodological quality according to the COSMIN checklist generally presented comparable results in this review. Nonetheless, our main finding – that the GAI and GAI-SF generally show adequate psychometric properties based on methodologically weak studies – is important.
We recommend the use of these tools and emphasize the need for better designed research on the validity and reliability of the GAI and GAI-SF. Researchers should always assess the psychometric properties of the instruments they use. Psychometric properties of an instrument are specific to the population and purpose for which it was intended and thus, they are not the properties of the instrument per se (Hunsley & Mash, Reference Hunsley and Mash2008).
Not all psychometric properties received the same level of attention, which in turn influences the confidence that can be placed in the results (e.g., internal consistency was evaluated in 30 studies vs. two for content validity). Internal consistency was assessed in the majority of the studies and coefficients mostly fell above the acceptable threshold recommended by Hunsley and Mash (Reference Hunsley and Mash2008) for evidence-based assessment. Since the alpha values are influenced by the number of items of a scale, it is not surprising that lower coefficients were found for the GAI-SF (Streiner, Reference Streiner2003). Retest reliability was assessed in only 11 studies. Apart from the two lowest coefficients found for the long form (r = .53 and .58; Kneebone et al., Reference Kneebone, Fife-Schaw, Lincoln and Harder2016; Silva et al., Reference Silva, Oliveira, Yokomizo, Saran, Bottino and Yassuda2016), the lowest coefficient was .85. The two studies that presented the lowest coefficients also exhibited poor methodological quality for the reliability assessment according to the COSMIN checklist. However, other studies also presented poor quality but higher retest coefficients. Most studies presented a retest coefficient that was considered as acceptable according to the recommendations of Hunsley and Mash (Reference Hunsley and Mash2008).
Results concerning test-retest reliability as well as convergent and criterion validity suggest that the GAI and GAI-SF both assess rather stable components of anxiety. The good convergent and criterion validity found for measures of GAD symptoms suggest a capacity to evaluate trait anxiety (stable tendency to experience anxiety), and a low correlation found with a measure of state anxiety supports this hypothesis. The higher retest reliability of the short form versus the long form found in Silva et al. (Reference Silva, Oliveira, Yokomizo, Saran, Bottino and Yassuda2016) also leads us to question whether the items of the short version refer to more stable anxiety symptoms.
Inconsistency in divergent, factorial, and criterion validity was found across studies. Whereas some authors have concluded that moderate to high correlations with a measure of depressive symptoms are evidence of poor divergent validity, others have argued that it has not been well established that anxiety and depression are completely independent disorders in the elderly population considering the overlap of symptoms (Cassidy, Lauderdale, & Sheikh, Reference Cassidy, Lauderdale and Sheikh2005). The associations found are not specific to the GAI and GAI-SF, but are rather characteristic of other measures commonly used to assess anxiety in the elderly population (Therrien & Hunsley, Reference Therrien and Hunsley2012).
Further, conflicting results were found for the factorial structure of the GAI concerning the unidimensionality and multidimensionality of the scale. However, the fact that three of the four studies that presented the highest methodological quality (either “good” or “excellent”) for structural validity concluded to the unidimensionality of the scale leads us to support this result as well. Mababu and RuizSánchez (Reference Mababu and RuizSánchez2016) suggested that the different factorial structures found in previous studies for the GAI could be due in part to the dichotomous response format. Among the possible impacts of a dichotomous scale are a decrease in the percentage of explained variance and lower loadings (Lozano, García-Cueto, & Muñiz, Reference Lozano, García-Cueto and Muñiz2008; Velicer, DiClemente, & Corriveau, Reference Velicer, DiClemente and Corriveau1984). Molde et al. (Reference Molde, Hynninen, Torsheim, Bendixen, Engedal, Pachana and Nordhus2017) also proposed different explanations for the lack of factorial consistency: different cultural response styles, differences in semantics due to translation processes, different sample characteristics, and true cultural differences in the structure of anxiety across countries.
The unidimensionality of the GAI raises the question as to whether it reflects all manifestations of anxiety in a context where the GAI was designed to assess a range of anxiety presentations (Pachana, Byrne, et al., Reference Pachana, Woodward and Byrne2007). There is currently a consensus on the unidimensionality of the GAI-SF, which is not surprising for a 5-item scale. An obvious issue when designing the short form of an instrument is to ensure that the target content domain is still adequately represented despite the reduced number of items (Smith, McCarthy, & Anderson, Reference Smith, McCarthy and Anderson2000). This does not seem to be the case with the GAI-SF as it is composed largely of items that relate to cognitive symptoms. Evidence on criterion validity shows that the GAI and the GAI-SF can screen for probable cases of anxiety disorders. However, no specific cut-off score for the detection of an anxiety disorder can be established because of significant variability in the results.
Some psychometric properties of the GAI were sometimes found to be slightly better than those of the GAI-SF, but most authors concluded that the results were nevertheless comparable. Most studies that assessed the psychometric properties of the short form had extracted data from the GAI long form. Although we can only speculate about the consequences of this procedure, it is possible that the psychometric properties of the GAI-SF differ when administered independently because of context, primacy and recency, and warm-up effects. When validating a brief scale, it should be considered as a completely new measure and thus submitted to independent validation procedures (Smith et al., Reference Smith, McCarthy and Anderson2000). Until further data from an independent assessment of the short version become available, the findings of this review suggest that psychometric properties are not a major issue when choosing between the GAI and the GAI-SF. The choice of one instrument or the other depend on the user’s needs. For example, the short form may be the best option in specific situations such as when time is limited, when there is a demanding clinical context (e.g., acute geriatric settings), with elderly people who are easily fatigued or distracted, when multiple questionnaires are administered to patients, or when patients are frequently monitored.
Suggestions for Future Research
Future efforts to validate the GAI and GAI-SF should include paying particular attention to the previously identified problems and aiming to achieve a higher degree of methodological quality. Since content validity is considered to be the most important psychometric property according to COSMIN and that it was hardly tested in previous research, more studies should address this situation. Researchers should not assume that the culture and scales’ content are equivalent. Also, the ability of the GAI and GAI-SF to distinguish between anxiety and depression symptoms is limited. Therefore, it would be interesting to further examine this issue by going beyond standard correlational analyses (e.g., by using the heterotrait-monotrait ratio of the correlation method, by comparing the answer profiles of depressed and non-depressed elderly individuals, or by identifying specific items that spark confusion as to the true nature of symptoms [i.e., related to depression or anxiety]).
The appropriateness of the GAI and GAI-SF for monitoring treatment change also requires further attention. Considering that the GAI and GAI-SF were developed to assess a range of anxiety disorders rather than a specific disorder, it would also be interesting to define cut-off scores to identify different severity levels of anxiety symptoms (i.e., no symptoms; mild, moderate, and severe anxiety). The usefulness of the GAI as a screening tool for various anxiety disorders should also be documented. Some previously described results (e.g., high alpha values [Panayides, Reference Panayides2013], possible floor effects, the overrepresentation of cognitive symptoms in factorial structures, problematic items due to item overlap) lead us to think that the GAI and GAI-SF may not comparably cover the various areas of anxiety. Thus, a review of the performance of each item is required to identify those that lack precision and those that adequately measure anxiety. A reformulation of items may also be necessary in order to improve the scale’s validity.
Strengths and Limitations
Our findings are subject to several limitations. Despite great effort having been made to identify all relevant studies for this review, it is still possible that some were not included. Exclusion of non-English and non-French papers may have introduced a selection bias. Although a notable strength is that the literature search and the quality assessments were conducted by individuals working independently by using the COSMIN checklist, data extraction was completed by the first author only. Some notable strengths of this review are that the methodological quality of the research was assessed and that the coverage of the review is the broadest to date.
Conclusion
To our knowledge, this was the first systematic review to be conducted on the psychometric properties of the GAI and GAI-SF. The data provided by this review support the recommendation of these tools as screening measures for anxiety in older adults, especially in countries and in versions wherein psychometric properties were shown to be adequate. However, this review also highlights weaknesses in the methodological quality of research in this area. Researchers are encouraged to continue to assess the psychometric properties of the GAI and GAI-SF and apply standards such as the COSMIN checklist for study design and result reporting.
Funding Sources
None.
Conflict of Interest
Authors have no conflicts of interest to declare.


