


Introduction
Psychogenic nonepileptic seizures (PNESs) may semiologically resemble epileptic seizures (ESs) but are caused by a psychological process rather than abnormal electrical discharges in the brain. Reference Reuber and House1,Reference Reuber, Jamnadas-Khoda and Broadhurst2 They are classified as a conversion disorder/functional neurological symptom disorder in the Diagnostic and Statistical Manual of Mental Disorders (DSM-5). 3 The delay in diagnosis, averaging 7–10 years, Reference Reuber, Fernandez, Bauer, Helmstaedter and Elger4–Reference Carton, Thompson and Duncan6 leads to unnecessary health care utilization and costs, iatrogenic complications, and worse prognosis. Reference Seneviratne, Briggs, Lowenstern and D’Souza5,Reference Holtkamp, Othman, Buchheim and Meierkord7–Reference Seneviratne, Low and Low11 A variety of health care professionals (HCPs) encounter patients presenting with PNES as they are heavy users of nonemergency and emergency health care, Reference Razvi, Mulhern and Duncan12 where they sometimes even present in ‘PNES status’. Reference Reuber, Pukrop, Mitchell, Bauer and Elger13 Video-electroencephalography (EEG) monitoring is the gold standard for the differentiation of PNES versus ES, Reference Benbadis14 but since it is an elective procedure, HCPs frequently depend on visual analysis of seizure semiology to make an initial diagnosis. Reference Jin, Wu and Xu15,Reference Seneviratne, Rajendran, Brusco and Phan16 Furthermore, when analyzing video-EEG recordings, ictal semiology is as important as ictal EEG to make the correct diagnosis. Reference Benbadis14
Previous studies included participants from various countries and demonstrated that a HCP or student’s ability to distinguish ES from PNES based on video-recorded semiology varies to a great degree according to the level of medical expertise, as well as the patient’s seizure type; in some cases, it is no better than chance. Reference Jin, Wu and Xu15–Reference Erba, Giussani and Juersivich21 The training and scope of practice of the different HCPs or students may vary according to the health care model of a specific country. To our knowledge, there has not been a North American study comparing the performance in diagnosis between different groups of HCPs or students. Furthermore, the potential effect of patient sex and age in diagnosing PNES has not been investigated. It has been reported that 70% of PNES patients are between the ages of 20 and 40 years Reference Devinsky, Gazzola and LaFrance22,Reference LaFrance, Baker, Duncan, Goldstein and Reuber23 and three-quarters are female. Reference LaFrance, Baker, Duncan, Goldstein and Reuber23 However, this sex prevalence is only present starting from adolescence, Reference Benbadis14,Reference Reilly, Menlove, Fenton and Das24,Reference Sawchuk and Buchhalter25 and some studies suggest a greater prevalence of PNES in preadolescent boys. Reference Sawchuk and Buchhalter25,Reference Park, Lee, Lee, Lee and Lee26
The main objective of this study was to assess the ability of different Canadian HCPs and students to distinguish PNES from ES, based on video-recorded semiology. We hypothesized that the correct recognition of PNES would vary according to: (1) seizure type and semiology; (2) a HCP’s or student’s level of expertise in the field of neurology/epilepsy; and (3) the patient’s age and sex.
Material and Methods
This study of diagnostic accuracy was conducted according to the Standards for Reporting of Diagnostic Accuracy (STARD) guideline. Reference Cohen, Korevaar and Altman27
Video Selection
We retrospectively reviewed the medical charts and video-EEG recordings of approximately 400 patients with PNES and/or ES confirmed by video-EEG monitoring admitted to the epilepsy monitoring units of the Centre hospitalier de l’Université de Montréal (CHUM) and Centre hospitalier universitaire Sainte-Justine (CHUSJ) since 2002. Eighteen ESs and 18 PNESs were selected and classified according to the 2017 International League Against Epilepsy (ILAE) classification Reference Fisher, Cross and D’Souza28,Reference Fisher, Cross and French29 and another proposed semiological classification, Reference Seneviratne, Reutens and D’Souza30 respectively (Table 1). The selected videos represent a wide diversity of ES and PNES. For each seizure video, either the full event or only a short clip was selected (ranging from 6 s to < 30 s) that included the essential semiology allowing to categorize it as an ES or PNES. Examples were the Figure 4 sign (typical of ES) or asynchronous limb movements (typical of PNES). In order to have comparable PNES and ES video groups, 6 pediatric patients (older children and teenagers) and 12 adult patients, and an equal proportion of males and females were selected in each. An epileptologist reconfirmed the diagnosis previously established based on ictal EEG and semiology. Video clips were randomly assembled into a video montage using computer random number generation. The video montage included 7-s breaks between each seizure. All selected patients had given their written and informed consent to their videos being used for educational and research purposes. Additionally, videos were anonymized by blurring parts of the face which did not exhibit essential clues for diagnosis.
Table 1: Seizure characteristics and health care professionals’ and students’ percent concordance with the gold standard *
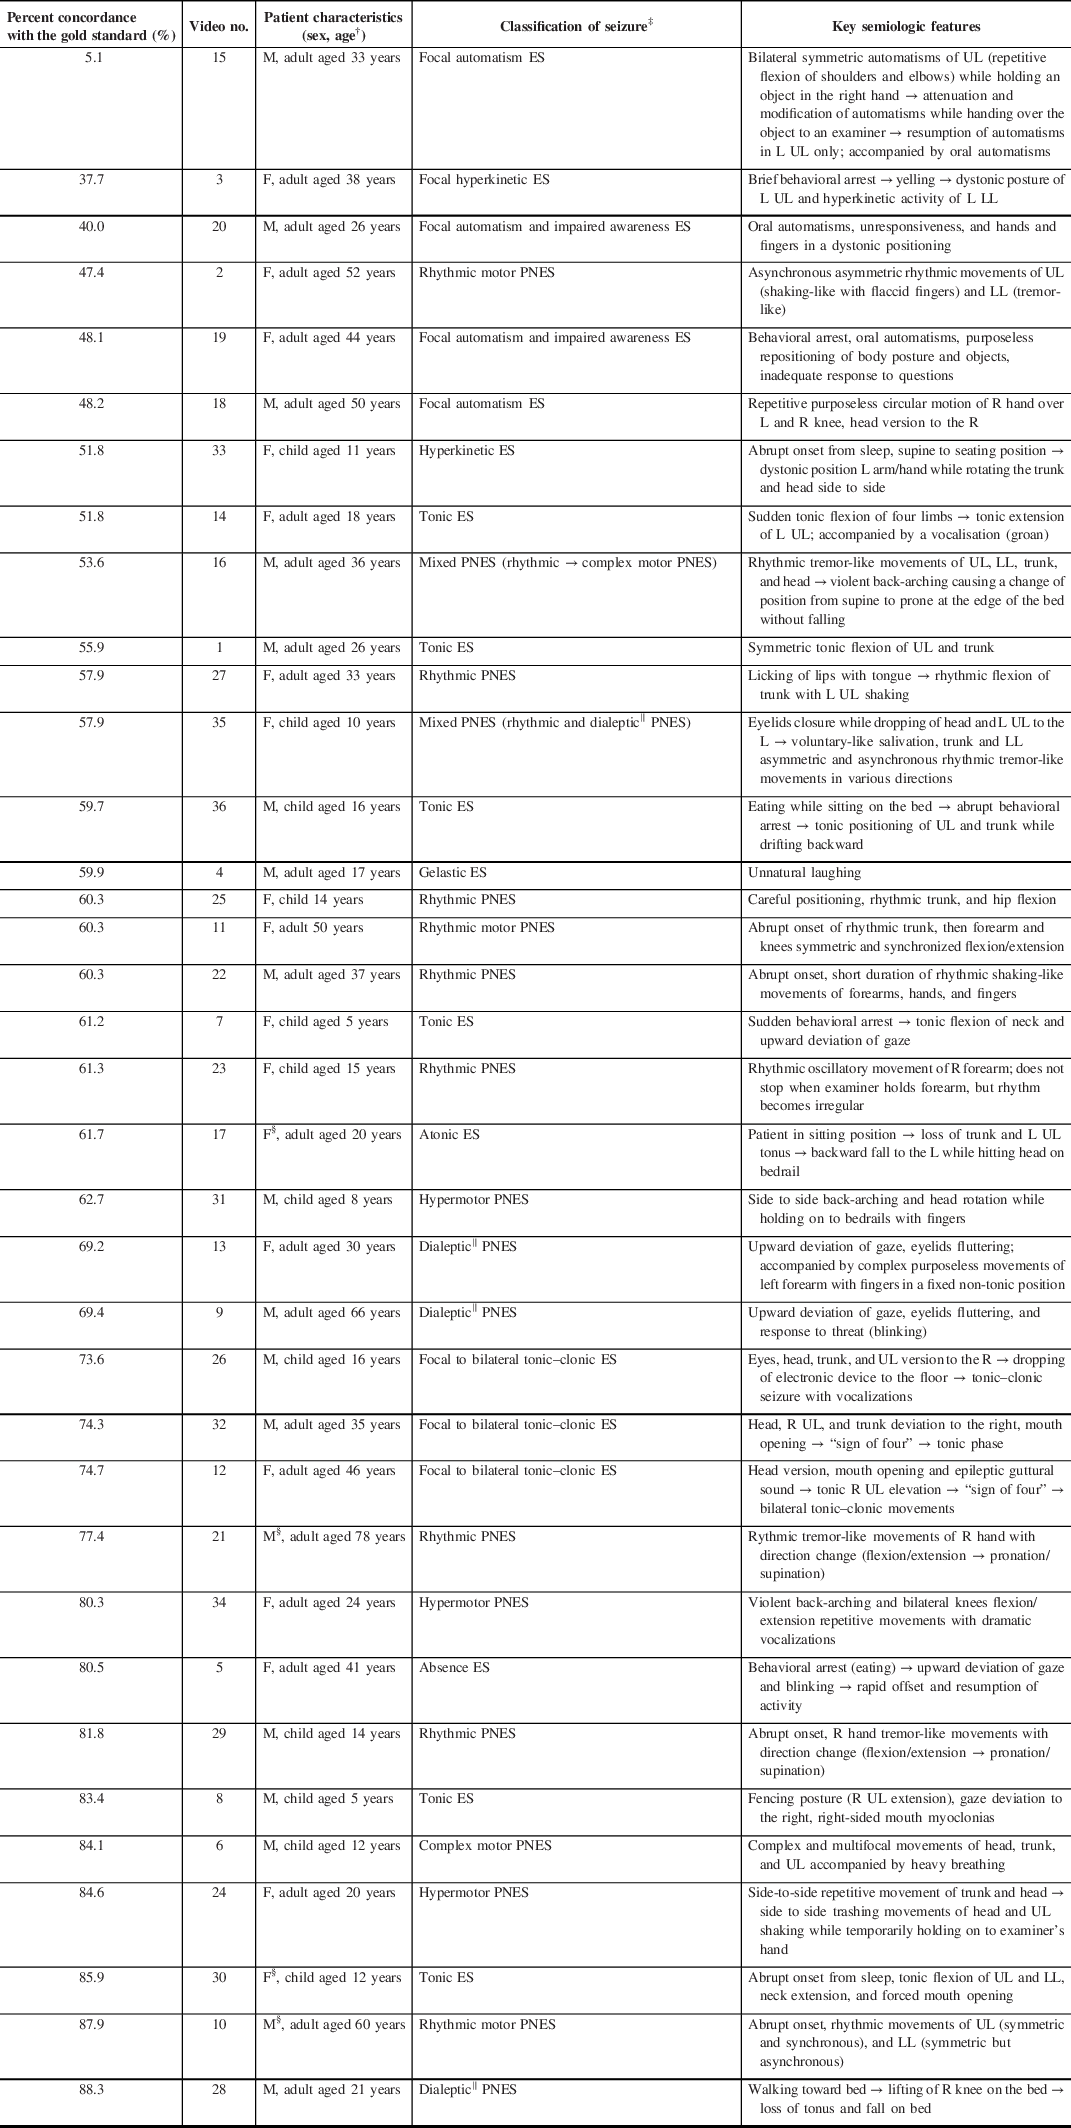
ES = epileptic seizure; PNES = psychogenic nonepileptic seizure; M = male; F = female; UL = upper limb; LL = lower limb; R = right; L = left; → = then
* Seizures are presented in order of health care professionals’ and students’ percent concordance with the gold standard (video-EEG)
† Child patients are ≤16 years old
‡ Classified according to the 2017 International League Against Epilepsy (ILAE) classification (ES), Reference Fisher, Cross and D’Souza28,Reference Fisher, Cross and French29 and another proposed semiological classification (PNES) Reference Seneviratne, Reutens and D’Souza30
§ Seizure where video quality does not allow for sex identification
‖ “Focal impaired awareness” replaces the older term ‘dialeptic’ in the 2017 International League Against Epilepsy (ILAE) classification
Study Population and Data Collection
Data were collected prospectively by organizing video viewing sessions where the video montage was shown only once. Participants were selected through convenience sampling in various hospitals in the province of Quebec, Canada, from 2017 to 2019. Although all types of HCPs or students were free to participate, targeted groups included neurologists, emergency physicians, psychiatrists, neurology residents, nurses, EEG technicians, and undergraduate medical students. After watching each seizure, participants were requested to individually mark the diagnosis as ES or PNES on an answer sheet. No additional information was provided. Participants already knowing the diagnosis of particular cases were required to indicate it on the answer sheet. We also collected information on participants’ professions and their age category, as to maintain confidentiality.
Data Analysis
Seizure Diagnostic Difficulty
For each of the 36 seizures, the HCPs’ and students’ percent concordance with the gold standard (video-EEG) was calculated (i.e. total number of correct answers for each video/(total number of correct answers + total number of incorrect answers for each video)). This allowed ranking of all 36 seizure subtypes from most difficult to easiest to diagnose (Table 1). The mean percent concordance with the gold standard for PNES was then calculated and compared to the mean percent concordance with the gold standard for ES.
Diagnostic Accuracy Based on Level of Expertise
Participants’ answers were pooled in 2 x 2 tables for each HCP or student group. For each group, the diagnostic accuracy for PNES (with people with ES as the negative result) was quantified by three different measures: mean sensitivity (Sn), mean specificity (Sp), and area under the curve (AUC) derived from summary receiver operating characteristic (SROC) curves. SROC summarize the diagnostic performance of a population of participants as a single number (AUC), allowing comparison of a single measure between groups of HCPs or students (e.g. AUC of neurologists compared to AUC of medical students). First, sensitivity (y-axis) is plotted against (1 – specificity) (x-axis) for each participant. Next, an SROC curve is placed over the data points to form a smooth curve, using a mathematic formula. The AUC is then calculated for the SROC of each group of HCPs or students. Reference Jones and Athanasiou31 A perfect diagnostic performance will result in an AUC of 1; an AUC of 0.5 represents diagnostic accuracies that are no better than chance, while an AUC less than 0.5 is worse than chance alone. Reference Lee, Kim, Choi, Huh and Park32 For each value, the confidence interval (CI) was calculated (with overdispersion correction in the case of Sn and Sp).
We further explored the effect of increased level of expertise in the field of neurology/epilepsy by comparing the diagnostic accuracy between groups of neurologists with increasing years of experience.
Diagnostic Accuracy of Neurology Specialists Based on Patient Age and Sex
Seizure videos were separated into age groups (adult patients versus pediatric patients) and sex groups (male versus female). Diagnostic accuracy for neurology specialists was calculated (using Sn, Sp, and AUC measures) for each one of these groups. Data were analyzed only for neurology specialists (neurologists and epileptologists), as they are more likely to have knowledge of the epidemiology of PNES, therefore most likely to take into account the age and sex in their diagnostic decision.
Statistical analyses were performed using the software Meta-DiSc, Reference Zamora, Abraira, Muriel, Khan and Coomarasamy33 IBM SPSS Statistics, and online softwares. 34,35 Diagnostic accuracy measures were reported with their standard deviation and 95% CIs and compared using the t-test or one-way ANOVA followed by Tukey–Kramer honest significant difference (HSD) post hoc test. P-values < 0.05 were considered statistically significant. Of note, the few answers (174/20 088, 0.9%) where participants indicated that they already knew the diagnosis, or that were not adequately filled (e.g. no answer or both ES and PNES cases with a check mark), were considered as invalid and excluded from the analysis.
Ethical Considerations
This study was approved by the ethics committee of the CHUM and CHUSJ.
Results
Characteristics of HCPs
A total of 558 HCPs or students participated in the study (Figure 1). The number of participants and median age in each HCP or student group are indicated in Table 2. Within the epileptologists group, 13 participants identified themselves as working with adult patients, 4 with pediatric patients, and 1 with both adult and pediatric patients. The following participants were not classified into HCP or student groups, however were included in calculations of percent concordance with the gold standard: 14 HCPs or students who did not identify their profession on the form, 32 participants who were part of a wide variety of HCP or student groups with few representants in each category (e.g. one pharmacist, two neuropsychologists, etc.), and 21 participants who identified themselves as working in research or administration (without significant direct patient care). Of note, the group “nurses with experience in epilepsy” includes neuroscience nurses or nurses working in video-EEG monitoring units. The group “nurses (varia)” includes all the remaining nurses who participated.
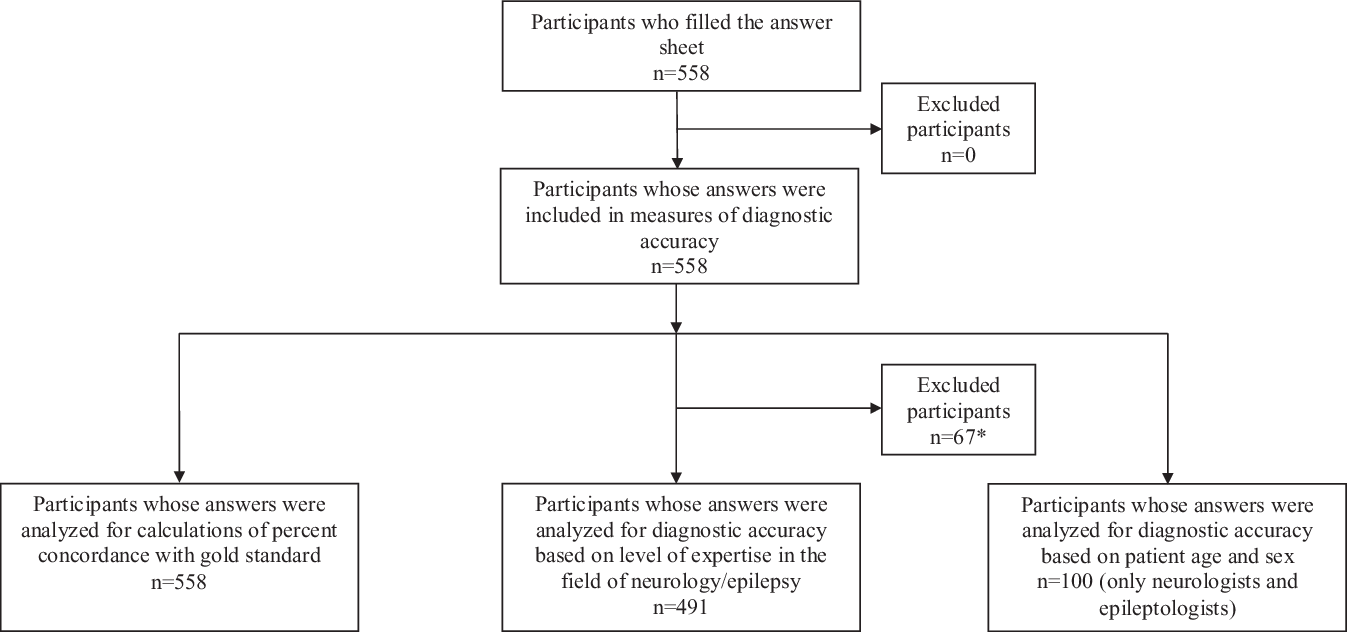
Figure 1: Flow diagram of the study participants according to the Standards for Reporting of Diagnostic Accuracy (STARD) guideline. *Including 14 participants who did not identify their profession on the form, 32 participants whot were part of a wide variety of health care professional or student groups with few representants in each category (e.g. one pharmacist, two neuropsychologists, etc.), and 21 participants who identified themselves as working in research or administration (without significant direct patient care)
Table 2: Health care professionals or students’ diagnostic accuracy of PNES versus ES diagnosis
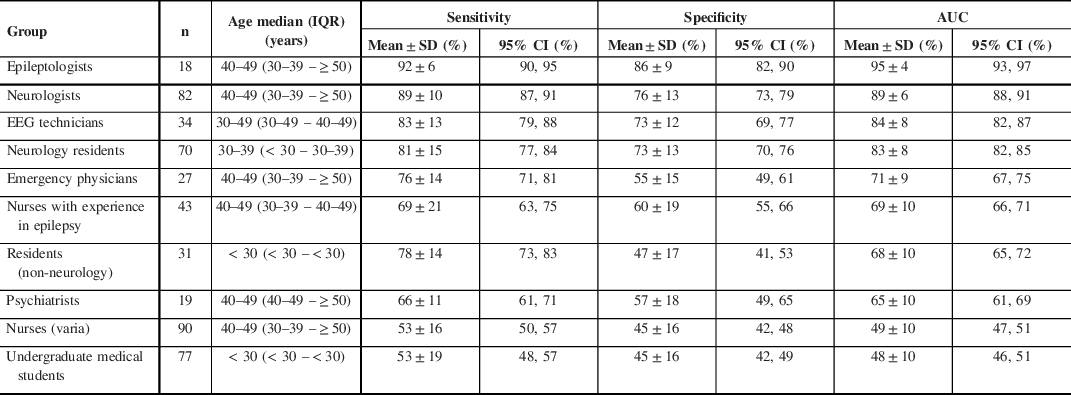
n = total number; IQR = interquartile range; SD = standard deviation; CI = confidence interval; AUC = area under the curve
Seizure Diagnostic Difficulty
The mean HCPs’ and students’ percent concordance with the gold standard were not statistically significant between PNES (69.1 ± 12.9%) and ES (58.5 ± 19.6%) (p = 0.06) and varied between the 36 seizures from 5.1% to 88.3% (Table 1). The percent concordance with the gold standard was between 37.7% and 88.3% (inclusively) for the majority of seizures (35/36), whereas the percent concordance with the gold standard was only 5.1% for video no. 15 (focal automatism ES). Additionally, four out of five seizures that were easiest to diagnose (i.e. had the highest percent concordance with the gold standard) were PNES, whereas four out of five seizures that were the most difficult to diagnose were ES. The diagnostic difficulty varied according to the specific semiology of each type of PNES or ES: for example, the percent concordance with the gold standard for the nine rhythmic motor PNESs ranged from 57.9% to 87.9% and from 51.8% to 83.4% for the four tonic ES.
Diagnostic Accuracy Based on Level of Expertise
The mean sensitivity, specificity, and AUC of SROC for the groups of HCPs or students are summarized in Table 2. Diagnostic accuracies expressed as the AUC ranged from as high as 95% (epileptologists) to as low as 48% (medical students). An AUC of 48% is worse than luck; the wrong diagnosis is more likely to be chosen that the correct one. There was a statistically significant difference between groups of HCPs or students as determined by one-way ANOVA (p ≤ 0.001). A Tukey–Kramer HSD post hoc test comparing the difference between each pair of group AUCs revealed statistical difference between most groups (p ≤ 0.001), while there was no statistical difference between a few groups (p ≥ 0.1) (Table 3).
Table 3: Differences in AUC means among health care professional or student groups using Tukey–Kramer HSD test
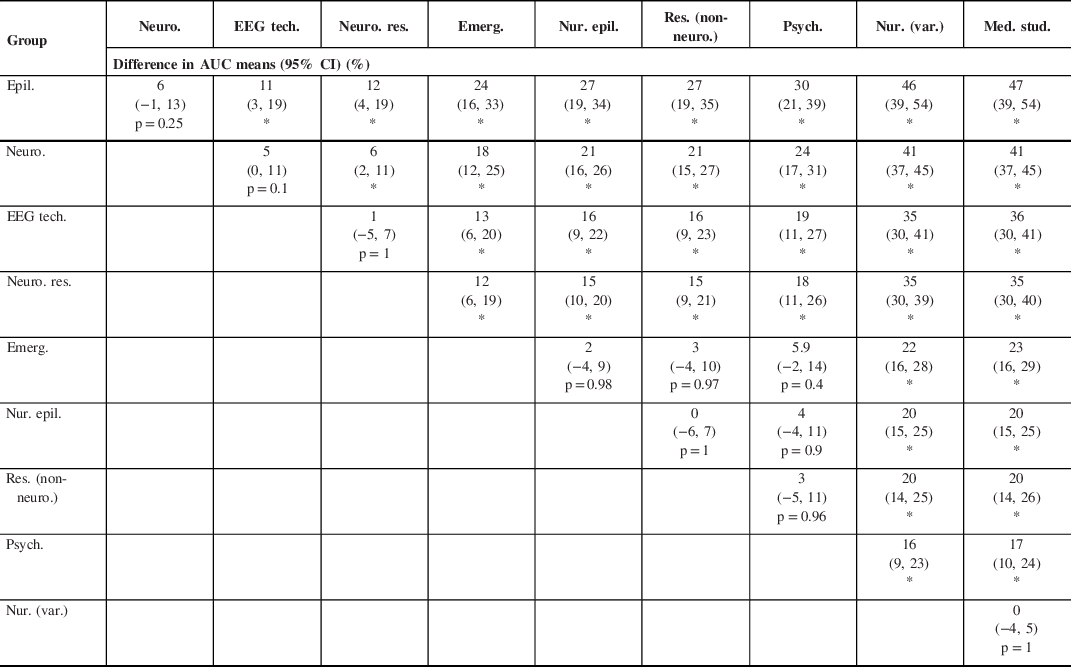
Epil. = epileptologists; Neuro. = neurologists; EEG tech. = EEG technicians; Neuro. res. = neurology residents; Emerg. = emergency physicians; Nur. epil. = nurses with experience in epilepsy; Res. (non-neuro.) = residents (non-neurology); Psych. = psychiatrists; Nur. (var.) = Nurses (varia); Med. stud. = undergraduate medical students
* p-value ≤ 0.001
The mean sensitivity, specificity, and AUC of SROC for groups of neurologists with increasing years of experience are summarized in Table 4. There was a statistically significant difference between the AUCs averaged for groups of neurologists with increasing years of experience as determined by one-way ANOVA (p = 0.048). A Tukey–Kramer HSD post hoc test revealed that the AUCs averaged for neurologists with < 10 years of experience (AUC = 91%) were significantly higher (p = 0.04) when compared to neurologists with > 20 years of experience (AUC = 86%). There was no statistically significant difference between the groups of neurologists < 10 years and 10–20 years (p = 0.81) and between groups of neurologists 10–20 years and > 20 years (p = 0.20) of experience.
Table 4: Impact of years of experience on neurologists’ diagnostic accuracy of PNES versus ES diagnosis
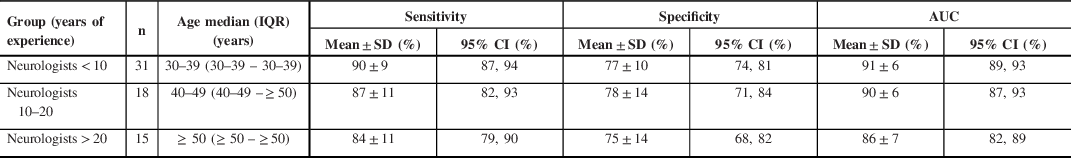
n = total number; IQR = interquartile range; CI = confidence interval; AUC = area under the curve
Diagnostic Accuracy of Neurology Specialists Based on Patient Age and Sex
Due to video quality or anonymization-rendering distinction between male or female patients ambiguous, four seizure clips were excluded from this analysis (videos #10, 17, 21, and 30; Table 1). The diagnostic accuracy (Sn, Sp, and AUC) was similar in adult versus pediatric and female versus male patients (Table 5).
Table 5: Neurology specialists’ (pediatric and adult epileptologists and neurologists) diagnostic accuracy of PNES versus ES diagnosis based on patient age and sex

n = total number; CI = confidence interval; AUC = area under the curve
Discussion
Our results confirmed our hypotheses that the ability of Canadian HCPs or students to distinguish PNES from ES based on video-recorded semiology varied overall according to (1) seizure type and semiology, and (2) a HCP or student’s level of expertise in the field of neurology/epilepsy. However, (3) we did not identify evidence that the patient’s age and sex affect diagnostic performance in the group of neurology specialists.
Seizure Diagnostic Difficulty
Similar to Seneviratne et al. and Jin et al., Reference Jin, Wu and Xu15,Reference Seneviratne, Rajendran, Brusco and Phan16 we found that the HCPs’ and students’ percent concordance with the gold standard (video-EEG) varied greatly between the different seizure types and semiology. Additionally, we found that while percent concordance with the gold standard was similar between PNES and ES, the highest percent concordance was obtained for PNES types, whereas the lowest percent concordance was obtained for ES types. Participants might instinctively be prompted to choose PNES as a diagnosis when semiology appears intentional/voluntary or overly dramatic. Indeed, the four out of five easiest (PNES) and four out of five most difficult (ES) seizures to identify had features of partial obedience to the examiner’s command, trashing, and violent or nonrhythmic motor signs, dramatic vocalizations, and abrupt onset of symptoms appearing to occur only at the most opportune moments. Recognition of features characteristic of ES is often not as instinctive. For example, typical oral automatisms were key semiological features for the correct diagnosis of the first, third, and fifth most missed seizures. In the first most missed seizure (with a percent concordance of 5.1%), only paying attention to the most prominent semiology (symmetric repetitive flexion of the upper limbs while still being able to hand over an object to the examiner) would not allow for a clear differential diagnosis.
Diagnostic Accuracy Based on Level of Expertise
The diagnostic accuracy of PNES versus ES based on video-recorded semiology varied overall proportionately with the caregiver’s level of expertise in the field of neurology/epilepsy (Table 2): as expected, HCPs and students with more training performed better. Based on the results obtained, participants can be separated into three groups according to decreasing order of diagnostic performance (Table 3): (1) neurology specialists (epileptologists and neurologists), EEG technicians, and neurology residents all performed better than (2) emergency physicians, nurses with experience in epilepsy, residents (non-neurology), and psychiatrists. The latter group performed better than (3) nurses (varia) and undergraduate medical students. Within the first group, neurology specialists performed better than neurology residents. There was a strong trend toward statistical difference, with AUC 95% CIs that were not overlapping between epileptologists (95% CI 93, 97) compared to neurologists (95% CI 88, 91) and neurologists compared to EEG technicians (95% CI 82, 87). However, multiple pairwise comparisons with the conservative Tukey–Kramer HSD test revealed no statistical difference (p = 0.25 and 0.1, respectively). Neurology residents performed similarly to EEG technicians. HCP and students within group 2 and within group 3 performed similarly. These findings are overall consistent with previous studies Reference Jin, Wu and Xu15–Reference Ristic, Draskovic, Bukumiric and Sokic18,Reference Wasserman and Herskovitz20 including smaller samples of groups of HCP or students, with a few differences to be noted. Seneviratne et al. found that neuroscience nurses performed similarly to undergraduate medical students, which could in part be explained by differences in HCP training/exposure between countries (Australia versus Canada). Reference Seneviratne, Rajendran, Brusco and Phan16
Increasing experience within the same field/scope of practice might not lead to a better ability to differentiate PNES form ES, as neurologists with 10–20 or > 20 years of experience did not have a better performance than neurologists with < 10 years of experience (Table 4). Furthermore, neurologists with < 10 years of experience performed better than neurologists with > 20 years of experience (p = 0.04). First, these results could indicate that the learning curve for visual distinction of PNES from ES might reach a plateau in HCPs with expertise in neurology/epilepsy, above which additional knowledge or experience does not lead to better performance. This ‘learning plateau’ might explain that seizure diagnosis solely on the basis of videos remains challenging, even when reaching high levels of expertise: more experienced neurologists and epileptologists did not attain a diagnostic accuracy of 100%. Similarly, Erba et al. found that in only about one-third of cases, neurologists could establish a confident diagnosis of PNES/ES based on video data alone. Reference Erba, Giussani and Juersivich21 Second, these results emphasize the need for continuing medical education, even among HCPs with the highest expertise.
These findings are of practical relevance. Awareness of the difficulty of PNES semiology differentiation from ES and the importance of early diagnosis in prognosis should prompt HCPs to consider this diagnosis earlier and to seek help from neurology specialists. Likewise, specialists should obtain video-EEG as a diagnostic aid in some cases. Diagnostic suspicion of PNES should remain high in patients with confirmed ES, since an estimated 10%–30% of patients with PNES have coexisting ES, Reference Benbadis, Agrawal and Tatum36 and epilepsy may be a risk factor for PNES. This is especially relevant for mental health professionals, since they are involved in the management of the highly prevalent psychiatric comorbidities in patients with epilepsy and PNES (that might be undiagnosed). Reference Dworetzky and Baslet37,Reference Hingray, Biberon, El-Hage and de Toffol38 Additionally, short teaching sessions focusing on differentiating the non-stereotypical semiology of PNES from ES using videos could be an effective and time-efficient strategy to improve diagnostic accuracy in less experienced HCPs or students. Jin et al. showed that the diagnostic reliability can be improved by observing more seizures within the same viewing session, but only in the neurologists and other physicians groups, and not in the group of epileptologists. Reference Jin, Wu and Xu15 Two recent studies showed that the accuracy of visual discrimination of seizures improved immediately after a 15-min teaching presentation Reference O’Sullivan, Redwood, Hunt, McMahon and O’Sullivan17 and 3 and 6 months after a targeted video-based training. Reference Seneviratne, Ding, Bower, Craig, Leech and Phan19
Diagnostic Accuracy Based on Patient Age and Sex
We found that neurology specialists (including pediatric and adult neurologists and epileptologists) were as likely to diagnose PNES in adult versus pediatric, and female versus male patients. This goes against the conception that since PNESs are far more common in women, clinicians are likely to have a lower threshold to diagnose PNESs in women while having a higher threshold to diagnose PNESs in men, as suggested by Dworetzky et al. Reference Dworetzky and Baslet37
Limitations
Our study has certain limitations. First, the small sample sizes in some groups limit the interpretation of results, for example, when comparing the diagnostic accuracy of PNES versus ES diagnosis based on patient age (24 adult and 12 pediatric patients) and sex (16 female and 16 male patients), or the diagnostic accuracy of neurologists with > 20 years of experience (n = 15) compared to < 10 years of experience (n = 31). Second, despite the comparison of multiple groups, adjustment for multiple tests was not carried in our study. In exploratory analyses, multiple test adjustments are not strictly required, and it might be preferable that data should be analyzed without multiplicity adjustment. Reference Bender and Lange39 Furthermore, in our study, significant findings in pairwise comparisons were quite strong (p ≤ 0.001). Third, our results may underestimate the true diagnostic accuracy for seizure diagnosis, given that the participants were only shown portions of seizures and were unable to interact, question the patient, or consult the chart for additional clinical details. It must be noted, however, that in real clinical practice, physicians often rely solely on visual diagnosis in cases where obtaining a detailed history is not possible, such as a patient having a seizure in the emergency department. Also, we made sure that all selected video clips contained sufficient semiology information for making a diagnosis. Fourth, the suboptimal quality of some of the videos recorded at night, and the blurring of the eyes required for anonymization may have slightly hampered the interpretation, although we made sure sufficient clues were available for participants to render an informed diagnosis. Although videos where sex and age could not be discerned were excluded from analysis when analyzing potential bias, results might not be representative as this information is usually known without ambiguity to the HCP and student when taking care of a patient. Finally, some participants might not have appropriately identified their profession on the response form. For example, nurses with experience in epilepsy were required to check an additional box identifying themselves as such.
Acknowledgments
Authors would like to acknowledge the support of the Canadian League Against Epilepsy (CLAE; 2015 CLAE Undergraduate Summer Studentship Award, supported through funding from the Canadian Epilepsy Alliance, UCB Canada and Sunovion Pharmaceuticals, awarded to VB) and the Canada Research Chair Program (DKN).
Conflicts of Interest
MRK reports unrestricted educational grants from UCB and Eisai, and research grants from UCB and Eisai. The remaining authors have no conflicts of interest to declare.
Statement of Authorship
Study conceptualization and methodology (VB, MRK, AL, and DKN), including review and selection of seizure video-EEG clips (VB, AL, and DKN); data acquisition (VB and DKN); data analysis (VB, MRK, and DKN); drafting and revision of the manuscript (all authors); and study supervision and final correction (DKN).


