


Magnetic resonance imaging (MRI) is a valuable tool for studying neurological and psychiatric disorders, as well as typical neurodevelopment and aging, given its ability to yield quantitative information about brain structure and function. However, variation in scanner hardware and pulse sequences, acquisition parameters, and image post-processing between research centers precludes establishment of universal normal ranges for advanced quantitative methods (diffusion imaging, quantitative susceptibility mapping, etc.). As a result, each study of a given clinical disorder must recruit its own control samples, which can be duplicative, time-consuming, and costly, particularly for multiple studies in the same center. In addition, clinicians typically have easier access to patients within their specialty, while recruiting appropriate matched controls can be more logistically challenging. Moreover, given that nearly all quantitative measures in the brain change with age and several differ between males and females, control databases must span wide age ranges with equal sex distributions to enable matched comparisons. This brief report describes a normative control sample of 378 neurotypical participants, ages 5–90 years, who underwent brain MRI on the same research-dedicated 3T Siemens Prisma using the same quantitative MRI protocol, as well as a brief cognitive and clinical assessment and a demographics questionnaire (the “UAlberta Normative Brain MRI” sample). The aims of this database were to (i) produce novel data about healthy brain development and aging across the lifespan, and (ii) provide a centralized database to prevent duplication of controls across multiple studies of various neurological disorders.
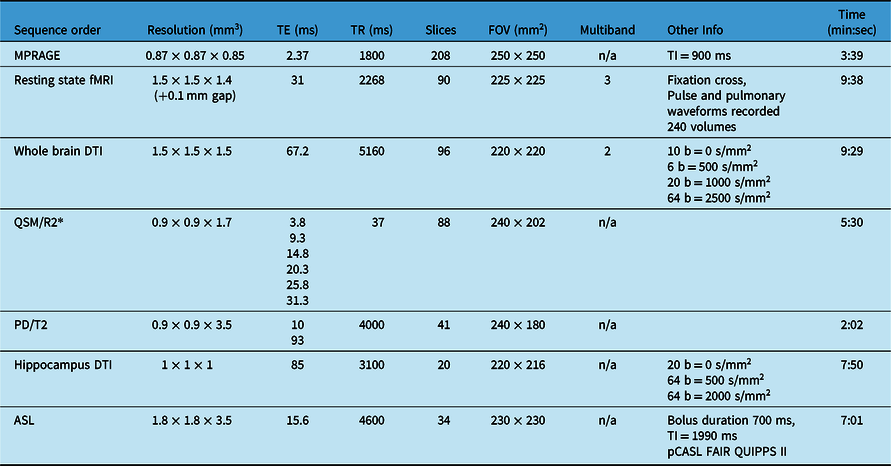
Participants were recruited through advertising or word of mouth, and were screened for self-reported history of psychiatric, neurological, or neurodevelopmental disorders, history of significant head injuries, or contraindications to MRI. Participants were scanned in the Peter S Allen MRI Research Centre at the University of Alberta, on a 3T Siemens Prisma with a 64-channel head/neck coil. Total scan time was ∼50 min and included high-resolution T1-weighted MPRAGE for measuring brain volumes and structure, high-resolution resting state functional MRI to measure functional networks, whole-brain, multi-shell, high-resolution diffusion tensor imaging (DTI) to measure white matter connectivity and microstructure, quantitative susceptibility mapping (QSM)/transverse relaxation rate (R2*) to measure brain iron, dual-echo proton density/T2 to measure myelination and white matter hyperintensities, high-resolution DTI of the hippocampus (specifically relevant in several neurological, neurodegenerative, and mood disorders), and arterial spin labeling (ASL) to measure perfusion (Table 1; Figure 1). This protocol was designed to optimize the capabilities of the 3T Prisma (e.g. 80 mT/m gradients) while including a protocol that would provide novel information about typical brain development and aging and be relevant to the patient populations commonly studied at this research center. Relative to other neuroimaging databases such as the Calgary Normative Study or the UK Biobank, Reference McCreary, Salluzzi and Andersen1,Reference Alfaro-Almagro, Jenkinson and Bangerter2 this protocol uses higher resolution methods, particularly for whole-brain T1, DTI, and resting state MRI.

Figure 1: Example images from a ∼50-min MRI scan protocol including (A) MPRAGE, (B) T2, (C) high-resolution resting state fMRI, (D) quantitative susceptibility mapping, (E) hippocampus DTI, (F) whole brain, high-resolution multi-shell diffusion tractography, and (G) cerebral blood flow map.
Table 1: MRI sequences acquired in total scan time of ∼50 min (including field map and B1 map not included below, shimming, slice positioning, etc.) on 3T Siemens Prisma with 64 channel head coil
Three hundred and ninety participants were enrolled in the study; 12 were unable to complete the first sequence due to claustrophobia or other limitations (inability to fit into the head coil, lie flat etc.), leaving 378 participants included here (Table 2; Figure 2). The remaining subjects produced good quality data for a minimum of one sequence (e.g. MPRAGE), with the vast majority completing the entire protocol. Given that data quality evaluations and thresholds vary by sequence, and subject motion can likewise vary over time within a single scan session, exclusions were made sequence by sequence and will be reported in respective publications, along with additional details regarding acquisition parameters and sequence-specific image processing methods.
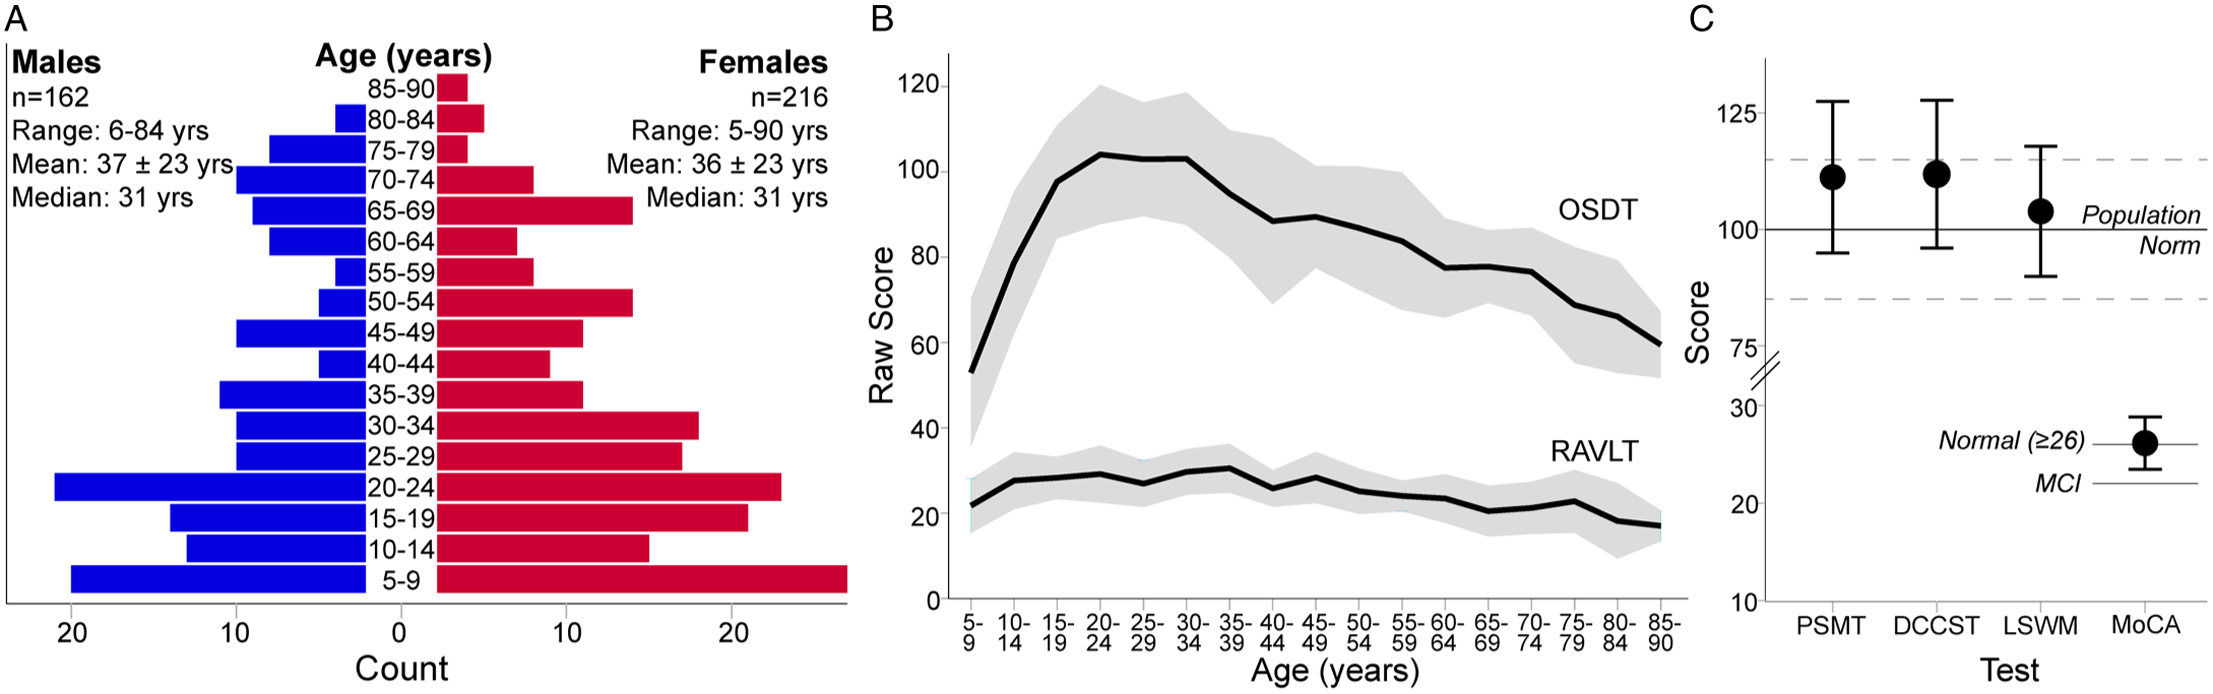
Figure 2: (A) Age and sex distribution and (B, C) cognitive scores of the 378 participants in this normative sample. (A) Subjects span from 5 to 90 years old, but are skewed towards younger ages and more females, albeit with a similar age distribution within each sex. (B) Raw scores for the Oral Symbol Digit Test (OSDT) and Rey Auditory Verbal Learning Test (RAVLT) indicate change in raw score performance with age, most notably for the OSDT (note standard scores are not produced for these subtests). (C) Means (± 1 SD) of age-corrected standard scores for the Picture Sequence Memory Test (PSMT), Dimensional Change Card Sort Test (DCCST) and List Sorting Working Memory test (LSWMT) indicate above average performance relative to the population norm of 100 ± 15. Raw scores on the MoCA indicate average performance for subjects over the age of 55 (normal = raw score ≥ 26; mild cognitive impairment (MCI) ≤ 22).
Table 2: Participant demographic and clinical data for the 378 participants
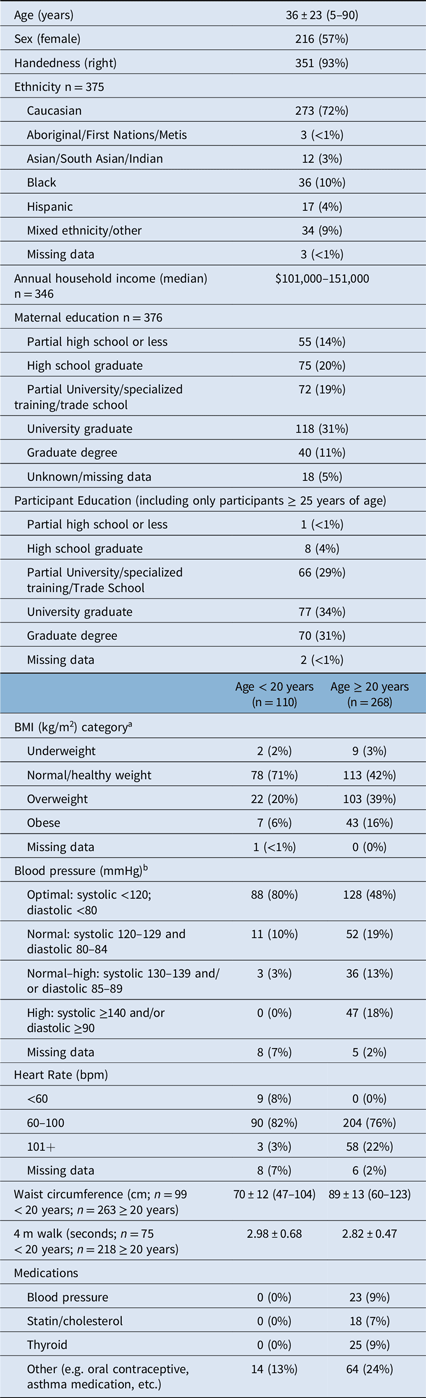
a As per CDC guidelines: for subjects over 20 years of age underweight defined as BMI <18.5, normal BMI = 18.5–24.9; overweight BMI = 25–29.9; obese BMI ≥ 30. For participants <20 years of age, BMI category determined via reference to BMI growth curves.
b Health Canada Guidelines (https://www.canada.ca/en/public-health/services/chronic-diseases/cardiovascular-disease/hypertension.html)
The final sample included 216 females and 162 males, spanning the ages of 5–90 years. Despite efforts to recruit an even age and sex distribution, the cohort includes more females than males, and is skewed towards younger participants (Figure 2A). A greater proportion of female participants has been observed in other larger normative databases, e.g. UK Biobank, Reference Alfaro-Almagro, Jenkinson and Bangerter2 while other studies such as the Human Connectome Project have purposely oversampled females to assess hormonal influence on brain connectivity. Reference Bookheimer, Salat and Terpstra3 Regardless, the age distribution spans the entire age range and the median age of this sample matches the median age of the city Edmonton in which the study was conducted. 4 Seven percent of this sample was left-handed, in comparison with ∼10% of the general population, Reference Papadatou-Pastou, Ntolka and Schmitz5 and 72% self-identified as Caucasian (Table 2). Despite efforts to recruit a diverse sample, the rates of visible minorities in this sample are lower (28%) than the rate of 37% reported for the city of Edmonton. 4
Participants underwent a brief (∼30 min) cognitive assessment using the NIH Toolbox Cognition battery including: the Oral Symbol Digit Test (OSDT), Rey Auditory Verbal Learning Test (RAVLT), Picture Sequence Memory Test (PSMT), Dimensional Change Card Sort Test (DCCST), List Sorting Working Memory Test (LSWMT), and 4-m walk test. Reference Gershon, Cella, Fox, Havlik, Hendrie and Wagster6 Participants over 55 were also administered the Montreal Cognitive Assessment (MoCA). Reference Nasreddine, Phillips and Bédirian7 The NIH toolbox does not produce age-corrected standard scores for the RAVLT and OSDT, which are both shown to change with age in this sample (Figure 2B). For example, raw scores of the OSDT, a measure of processing speed, followed a distinct pattern with age, peaking in performance in the early 20s. Age-corrected standard scores for the PSMT, DCCST, and LSWMT indicate high-average performance in this sample (Figure 2C). The MoCA indicated intact neurocognitive performance in subjects >55 years of age (Figure 2C).
Socioeconomic status (SES) is difficult to accurately capture, particularly in samples with a wide age range. Here, we collected annual household income and maternal education as a proxy for SES. Median annual household income was $101–151,000 CAD, suggesting that this sample has above-average income relative to the reported median of $87,225 CAD for the city of Edmonton. 4 In addition, 31% of this sample reported that their mothers had a university degree, again confirming that this is a high-SES sample. However, this lifespan study also brings into question the validity of using maternal education as a proxy for SES in samples with a wide age range, given that maternal education is tied to changes in social opportunity over time. For example, the median age of participants whose mothers hold a graduate degree was 21 years of age, while the median age of participants whose mothers had less than a high school education was 65 years.
The snapshot indicators of physical health collected in this study were: 4-m walk test, height, weight, waist circumference, blood pressure (after 5 minutes seated), heart rate, and current medications. The NIH toolbox 4-m walk test was found to be of limited utility here, as this test is intended to identify gait disturbances and thus nearly all participants performed within normal limits. Reference Bohannon and Wang8 Forty percent of participants ≥ 20 years of age and 20% of subjects under 20 years of age were overweight (body mass index; BMI = 25–29.9), while 16% of participants ≥ 20 years and 6% of participants under 20 were obese (BMI ≥ 30) calculated from measured height and weight (Table 2). Obesity rates in this sample roughly match Canada-wide obesity rates reported at ∼20% in adults and ∼5–10% in children. 9 Elevated (systolic 130–139 and/or diastolic 85–89) or high blood pressure (systolic ≥ 140 and/or diastolic ≥ 90) was found in 31% of the adults in this sample. This is above the national average of ∼20% of Canadian adults with diagnosed hypertension, 10 though it should be noted that this reflects a single blood pressure measurement taken on the day of research participation and does not equate to a diagnosis of hypertension. Indeed, only 9% of the adults in this sample were taking a blood pressure medication at the time of study participation. Overall health measures collected here indicate that this sample is representative of the larger population of Canadians.
Limitations of this sample include a skew in the age and sex distribution (more females and younger subjects), as well as above-average SES and cognitive performance. This may reflect recruitment methods and bias in the demographic of people interested in participating in research (note that subjects received no direct benefit for participation), which here included many participants from within the university community. The scan protocol was designed to suit a range of research questions relevant to a variety of neurological or psychiatric disorders, but nonetheless requires patient studies to use this exact (or portions of this exact) scan protocol. Other research scans of interest (e.g., magnetic resonance spectroscopy, magnetization transfer, etc.) were not included given the already ∼50 minute scan time.
This large dataset of controls spanning 5–90 years of age will yield novel information about trajectories of healthy brain development and aging via several novel, quantitative MRI measures. Importantly, it will primarily serve as a normative control database for the study of neurological and psychiatric disorders that require large numbers of well-characterized participants.
Acknowledgments
Funding was provided by the Canadian Institutes of Health Research (CIHR), Women’s and Children’s Health Research Institute (WCHRI) and the University of Alberta Hospital Foundation (UHF). Salary support (author CB) was provided by Canada Research Chairs program.
Conflicts of Interest
The authors have no conflicts of interest to declare.
Statement of Authorship
ST contributed to study design, oversaw data collection, completed analysis, and wrote the manuscript. CB secured funding, designed the study, and oversaw data collection/analysis. DE reviewed the scan protocol and images. JR, ES and KS collected the data. PS collected and analyzed data.
Data Availability
All data from this normative sample will be made publicly available following publication embargos. For download links and data access, please email the Principal Investigator, Christian Beaulieu at christian.beaulieu@ualberta.ca.


 Open access