Globally, both under- and over-nutrition are major health problems in children (de Onis & Blossner, Reference de Onis and Blossner2003). The prime medical importance of obesity lies with the insulin resistance it causes, which in turn depends on the fat mass relative to lean mass, and its location. Body weight and BMI do not reflect either body composition or fat distribution and for research purposes several methods of determining body composition and fat distribution have been devised, some more accessible than others (Ellis, Reference Ellis2000; Heymsfield et al. Reference Heymsfield, Lohman, Wang and Going2005). Such methods include hydrodensitometry (underwater weighing), isotope dilution (3H-labelled water, 2H-labelled water, or 18O), bioelectrical impedance analysis (BIA), whole-body counting (for example, total body K), dual-energy X-ray absorptiometry (DEXA), magnetic resonance imaging, and computed tomography (Ellis, Reference Ellis2000; Heymsfield et al. Reference Heymsfield, Lohman, Wang and Going2005). There is, however, no ‘gold standard’ technique, as direct analysis of body composition can only be carried out by chemical analysis of cadavers.
Failing direct analysis, magnetic resonance imaging and computed tomography are considered as criterion methods since they provide visual images of adipose tissue and can reliably distinguish between intra-abdominal and subcutaneous fat. These methods have also been directly validated against cadaver analyses of body composition (Ross & Janssen, Reference Ross, Janssen, Heymsfield, Lohman, Wang and Going2005). DEXA is more suitable for use in children because of the minimal radiation exposure and relative comfort. DEXA has been shown to be accurate and precise (Lohman & Chen, Reference Lohman, Chen, Heymsfield, Lohman, Wang and Going2005), and its adoption as a criterion method is justified by successful validation against multi-compartment models (Sopher et al. Reference Sopher, Thornton, Wang, Pierson, Heymsfield and Horlick2004; Lohman & Chen, Reference Lohman, Chen, Heymsfield, Lohman, Wang and Going2005) and against chemical analysis of animal models (Pintauro et al. Reference Pintauro, Nagy, Duthie and Goran1996).
DEXA, however, is of limited availability, relatively expensive and time consuming. BIA is quick, cheap, and easy to use, making it particularly suitable for large-scale studies in children. BIA measures the body's impedance and the technique is based on the differing electrical conductivities (water content) of various components of the body (Kyle et al. Reference Kyle, Bosaeus and De Lorenzo2004a,Reference Kyle, Bosaeus and De Lorenzob).
The traditional technique of BIA uses gel electrodes attached to wrist and ankle, and is in widespread use, but pressure-contact electrode systems (similar to bathroom scales) have since been introduced, which are more practical and convenient. Validation studies have been carried out in adults and adolescents (Jebb et al. Reference Jebb, Cole, Doman, Murgatroyd and Prentice2000), and several studies that assess the foot-to-foot system include young children (Jartti et al. Reference Jartti, Hakanen, Paakkunainen, Raittinen and Ronnemaa2000; Tyrrell et al. Reference Tyrrell, Richards, Hofman, Gillies, Robinson and Cutfield2001; Sung et al. Reference Sung, Lau, Yu, Lam and Nelson2001; Goss et al. Reference Goss, Robertson, Williams, Sward, Abt, Ladewig, Timmer and Dixon2003; Parker et al. Reference Parker, Reilly, Slater, Wells and Pitsiladis2003; Pietrobelli et al. Reference Pietrobelli, Rubiano, St-Onge and Heymsfield2004). Previous studies, however, have been limited by a wide age range and/or small sample size (Sung et al. Reference Sung, Lau, Yu, Lam and Nelson2001; Parker et al. Reference Parker, Reilly, Slater, Wells and Pitsiladis2003; Pietrobelli et al. Reference Pietrobelli, Rubiano, St-Onge and Heymsfield2004), or lack of criterion method for comparison (Jartti et al. Reference Jartti, Hakanen, Paakkunainen, Raittinen and Ronnemaa2000; Goss et al. Reference Goss, Robertson, Williams, Sward, Abt, Ladewig, Timmer and Dixon2003). There is still therefore a lack of information of the validity of foot-to-foot BIA compared with DEXA in young children (Tyrrell et al. Reference Tyrrell, Richards, Hofman, Gillies, Robinson and Cutfield2001), and some doubt remains over its adequacy (Lukaski & Siders, Reference Lukaski and Siders2003). The aim of the present study was to assess the validity of the foot-to-foot BIA in a large cohort of healthy young children using DEXA as the standard.
Methods
EarlyBird is a non-intervention prospective cohort study of 307 healthy school entrants (170 boys, 137 girls; mean age 4·9 years) in the city of Plymouth (UK). The study's rationale, recruitment procedures and protocol have been detailed previously (Voss et al. Reference Voss, Kirkby, Metcalf, Jeffery, O'Riordan, Murphy and Wilkin2003). Exclusion criteria were diabetes, pathological states likely to affect growth or body composition, moderate or severe physical disability, and long-term use of oral steroids assessed using a detailed medical history questionnaire (updated every 6 months). Measurements were made at recruitment and annually thereafter of height, weight, BMI, sum of skinfold thickness at five sites on the left-hand side of the body (triceps, biceps, subscapular, supra-iliac and umbilical) by skinfold callipers (Holtain Ltd, Crosswell, Dyfed, UK), and waist circumference by metal circumference measure (Chasmors Ltd, London, UK). All skinfolds and circumferences are the mean of two repeats. Height was recorded to the nearest 1 mm (Leicester Height Measure; Child Growth Foundation, London, UK) and the mean of three measures taken, weight to the nearest 100 g by the BIA (integral to the system). Reproducibility of the anthropometric measurements is expressed by the CV. Within-observer CV for height was 0·15 and 0·13 % for observers 1 and 2 respectively. Within-observer CV for waist circumference was 0·9 % for both observers. For the sum of five skinfold thickness sites, the CV was 3·7 and 4·0 % for observers 1 and 2 respectively. Foot-to-foot BIA was performed using the Tanita Body Composition Analyser TBF-300M (Tanita UK Ltd, West Drayton, Middlesex, UK), which is a stand-on system and the manufacturer's in-built equation was used for calculation of body composition. The within- and between-day CV for this system have previously been reported as 0·9% (SD 0·5) and 2·1% (SD 1·0) respectively in adults (Nunez et al. Reference Nunez, Gallagher, Visser, Pi-Sunyer, Wang and Heymsfield1997). Whole-body DEXA scans were performed with the Lunar Prodigy Advance fan-beam densitometer and analysed using EnCore 2004 software (version 8.10.027; GE Lunar Corporation, Madison, WI, USA). CV for total body analysis by this system have recently been reported to range from 0·18 to 1·97 % among paediatric subjects (Margulies et al. Reference Margulies, Horlick, Thornton, Wang, Ioannidou and Heymsfield2005). All measurements were performed between 08.30 and 09.00 hours after a minimum 10 to 11 h fast with the subjects in bare feet and light clothing. The data reported here relate to 203 children (106 boys; ninety-seven girls) who completed both measurements at mean age 8·9 (sd 0·3) years. All were Caucasian except for five who were of mixed race.
Statistical analysis
Skinfold data were not normally distributed and were therefore subject to log transformation before analysis. The mean and CI therefore required anti-logging. Anthropometric and body composition comparisons between sexes were made using ANOVA. Differences between methods were explored using paired t tests and Bland–Altman analyses (Bland & Altman, Reference Bland and Altman1986). Pearson's correlation coefficient was used to determine the association between techniques and between the size of the measurements and the difference between them. Where there was no relationship between the size of the measurements and the difference between them, the limits of agreement were calculated by d ± 1·96sddiff (where d is mean difference and sddiff is standard deviation of the differences). However, where there was such a relationship, the above calculation would give limits of agreement that are too far apart, failing to account for the relationship between the difference and the mean. In this situation, the limits of agreement were determined using a regression-based approach, where the difference between methods (D) was regressed on the average of the two methods (A), giving 

Statistical significance was set at the 0·05 level and all statistical analyses were carried out using SPSS for Windows (version 11.5.1; SPSS Inc., Chicago, IL, USA).
Results
Anthropometry
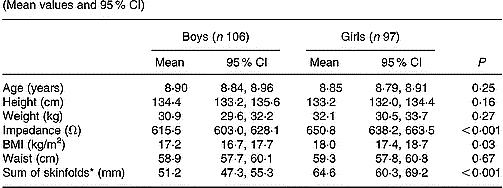
The waist circumferences of the girls and boys were similar, but the mean sum of skinfold thicknesses of the girls was almost 30 % higher (Table 1), indicating higher adiposity (percentage body fat) of the girls.
Table 1 Anthropometric characteristics of the EarlyBird cohort at 9 years (Mean values and 95 % CI)
* Back-transformed mean and CI of logged data.
Densitometry and bioelectrical impedance
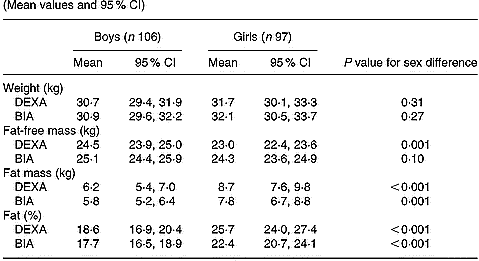
The correlations between DEXA and BIA measures of fat-free mass, fat mass, and percentage fat were high in both boys and girls. For fat-free mass the correlations between DEXA and BIA were r 0·93 and r 0·95 for boys and girls respectively. For fat mass the correlations between DEXA and BIA were r 0·97 and r 0·99 for boys and girls respectively. For percentage fat the correlations between DEXA and BIA were r 0·92 and r 0·95 for boys and girls respectively. Table 2 compares body composition of the children using DEXA and BIA. The absolute fat-free mass recorded by BIA was greater than by DEXA both in boys (2·4 %; P < 0·001) and in girls (5·7 %; P < 0·001), and the absolute fat mass lower (boys 6·5 %, P = 0·004; girls 10·3 %, P < 0·001). The percentage fat recorded by BIA was, accordingly, also lower than by DEXA (boys 5·0 %, P < 0·01; girls 13·7 %, P < 0·001).
Table 2 Body composition by dual-energy X-ray absorptiometry (DEXA) and foot-to-foot bioelectrical impedance analysis (BIA) in the EarlyBird cohort at 9 years (Mean values and 95 % CI)
Systemisation of differences between bioelectrical impedance analysis and dual-energy X-ray absorptiometry
Table 2 also shows how the differences between BIA and DEXA were greater in the girls for all three variables measured (fat-free mass, fat mass and percentage fat (all P < 0·001)). However, Table 3 examines each difference as a function of the variable measured in boys and girls separately and it can be seen that, for the boys, but not for the girls, the differences between BIA and DEXA were dependent upon the size of the variable in each case. Transcribed onto Bland–Altman plots, Fig. 1 shows how in boys, but not in girls, BIA tended systematically to underestimate fat-free mass at low levels of FFM, but to overestimate it progressively at higher levels. Also in boys, but not in girls, BIA overestimated fat mass (Fig. 2) and percentage fat (Fig. 3) at low levels of fat and to underestimate both at higher levels. In girls, BIA tended to overestimate throughout the range of fat free mass (Fig. 1), while fat mass (Fig. 2) and percentage fat (Fig. 3) tended to be underestimated throughout the range.
Table 3 Differences and limits of agreement at the 25th, 50th and 75th centiles of fat-free mass, fat mass and percentage fat measured by dual-energy X-ray absorptiometry (DEXA) and foot-to-foot (BIA) in children at 9 years (Mean differences and 95 % limits of agreement)

* Mean difference only is given where there was no relationship between difference and mean (girls).
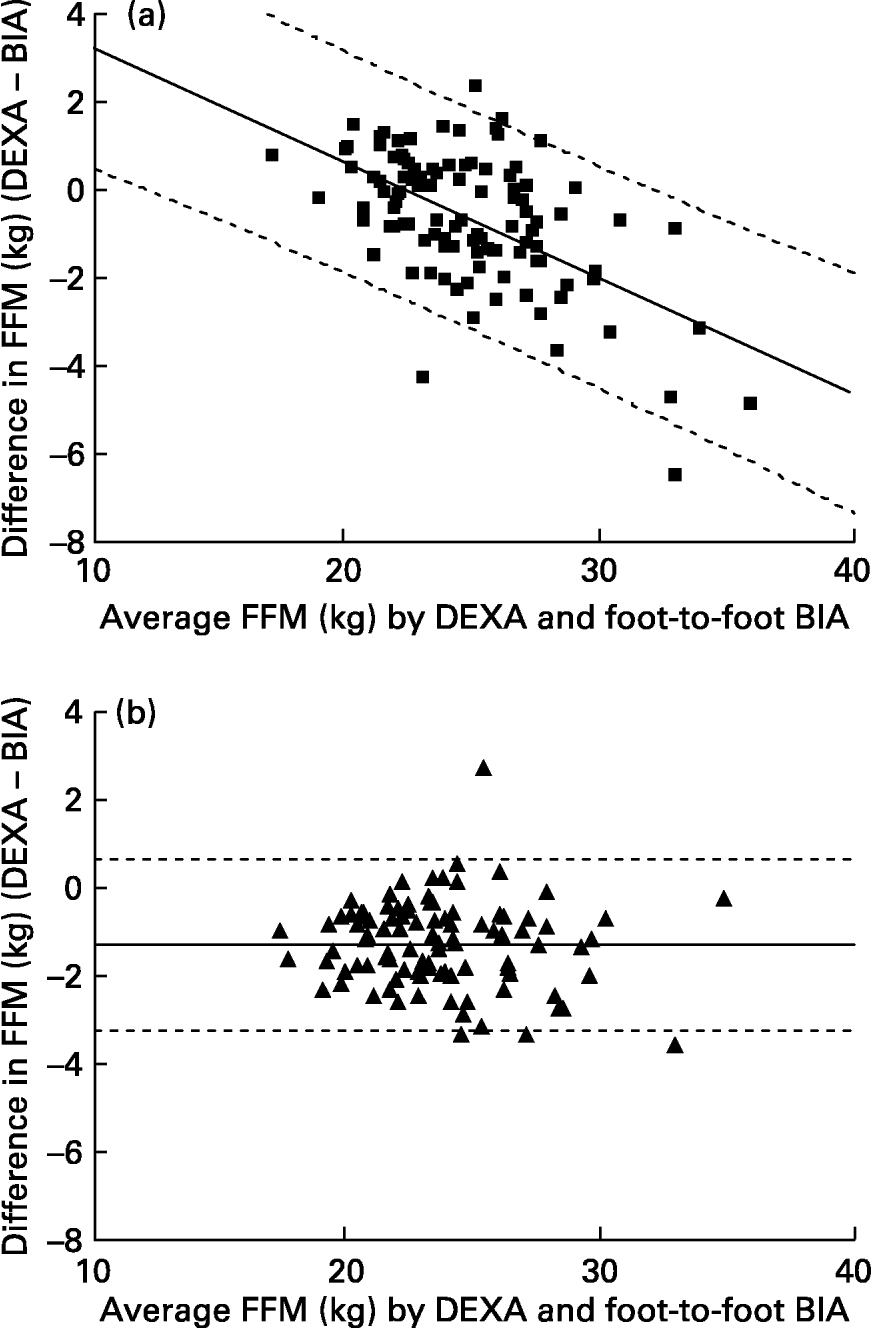
Fig. 1 Bland–Altman plot relating to fat-free mass (FFM) measured by dual-energy X-ray absorptiometry (DEXA) and foot-to-foot bioelectrical impedance analysis (BIA) in healthy 9-year-old boys (a) and girls (b). Lines are the regression slope ± 1·96 sd of residuals.
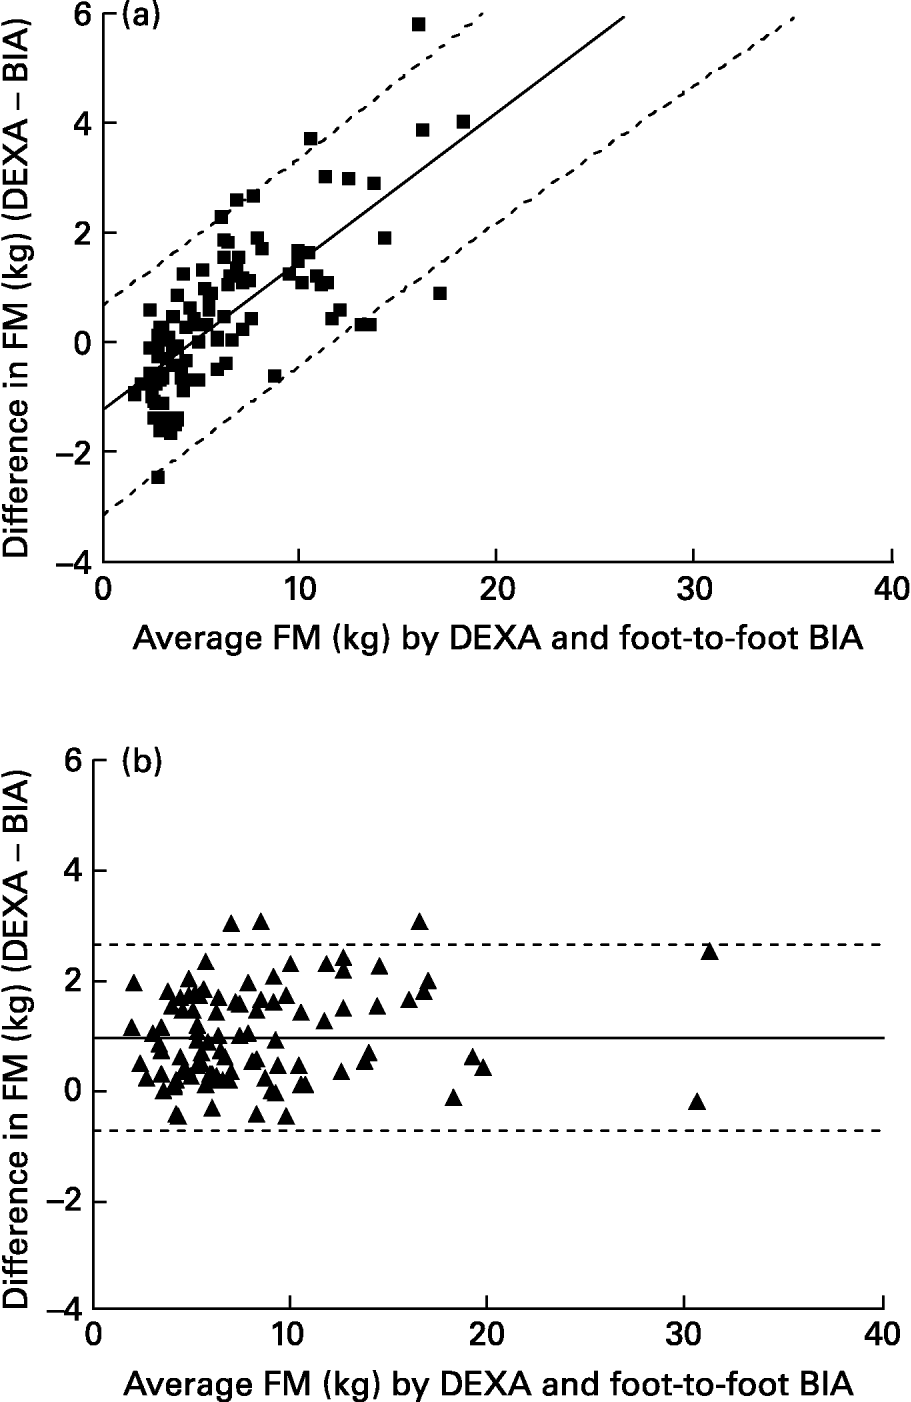
Fig. 2 Bland–Altman plot relating to fat mass (FM) measured by dual-energy X-ray absorptiometry (DEXA) and foot-to-foot bioelectrical impedance analysis (BIA) in healthy 9-year-old boys (a) and girls (b). Lines are the regression slope ± 1·96 sd of residuals.
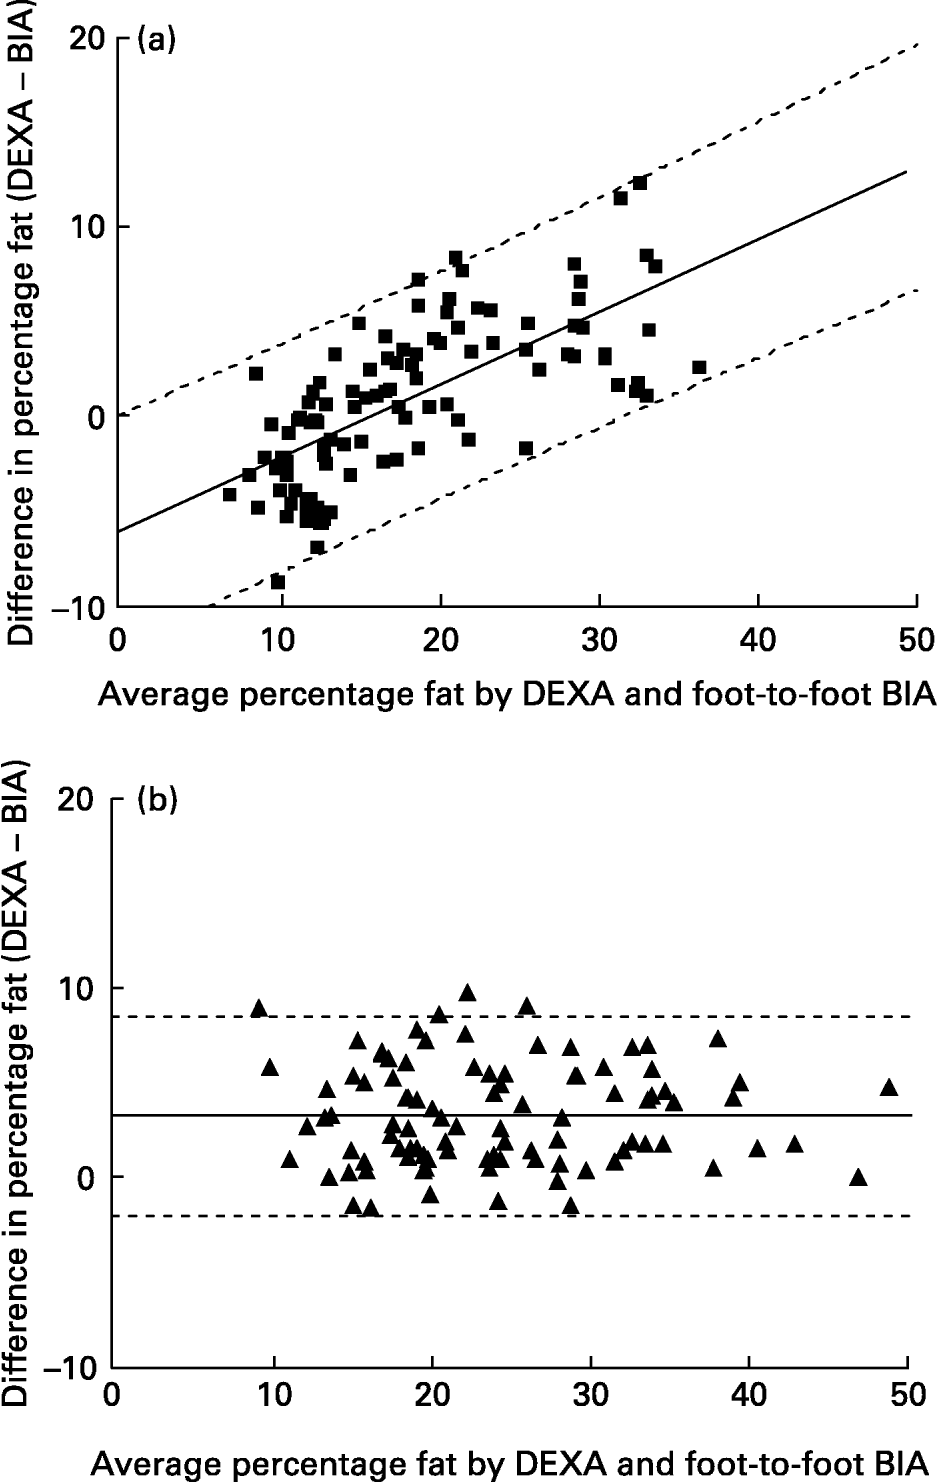
Fig. 3 Bland–Altman plot relating to percentage fat measured by dual-energy X-ray absorptiometry (DEXA) and foot-to-foot bioelectrical impedance analysis (BIA) in healthy 9-year-old boys (a) and girls (b). Lines are the regression slope ± 1·96 sd of residuals.
Thus, in the boys but not the girls, the direction of the differences was dependent upon size of the child. The influence of size on the accuracy of measurement was sometimes substantial: r − 0·74 (P < 0·001) in the case of fat mass (boys), r 0·69 (P < 0·001) for percentage fat (boys) and r − 0·57 (P < 0·001) for fat-free mass (boys).
Discussion
We have examined the validity in young children of body composition estimates by foot-to-foot BIA, using DEXA as the criterion measure. We sought to establish whether the differences between BIA and DEXA measures of body composition were sex-sensitive and whether they were influenced by body size. The data suggest that estimates of body composition in 9-year-old children by foot-to-foot BIA are not interchangeable with those from DEXA, owing to the influence of one of the variables it is designed to measure – body fat. As a result, foot-to-foot BIA tended to underestimate percentage fat in fatter boys and to overestimate percentage fat in leaner boys. In girls, the mean differences in body composition between the two techniques were larger than in the boys, but they were not influenced by the size of the measures. It is also important to note that although the mean differences may be small, of more relevance are the 95 % limits of agreement, which are a more accurate reflection of the validity of the measure in an individual.
Previous validation studies in adults and children have variously found foot-to-foot BIA to underestimate, or to overestimate, body fat in relation to DEXA (Tyrrell et al. Reference Tyrrell, Richards, Hofman, Gillies, Robinson and Cutfield2001; Sung et al. Reference Sung, Lau, Yu, Lam and Nelson2001; Lazzer et al. Reference Lazzer, Boirie, Meyer and Vermorel2003; Lukaski & Siders, Reference Lukaski and Siders2003). Different populations, life or developmental stage, ethnicity and use of different systems may explain some of these discrepancies. Comparison with other studies is difficult, as few have attempted to validate foot-to-foot BIA directly against DEXA in young children. Those that made measurements using both BIA and DEXA have a wider age range than the present study, and age-related differences in fat patterning may be critical to the performance of body composition equations. Pietrobelli et al. (Reference Pietrobelli, Rubiano, St-Onge and Heymsfield2004), for example, measured forty subjects aged between 6 and 64 years, comparing both segmental and foot-to-foot BIA with DEXA and found no between-method bias. However, although the mean difference between methods was not statistically significant (probably due to small sample size), the correlation between techniques was lower (r 0·82) than in the present study. In addition, neither the Bland–Altman plots nor 95 % limits of agreement were presented, which are important to determine validity at an individual level.
Our population incorporated a large number of healthy, pre-pubertal children of uniform age. Others have included, or studied exclusively, adolescents (Sung et al. Reference Sung, Lau, Yu, Lam and Nelson2001; Lazzer et al. Reference Lazzer, Boirie, Meyer and Vermorel2003; Parker et al. Reference Parker, Reilly, Slater, Wells and Pitsiladis2003; Pietrobelli et al. Reference Pietrobelli, Rubiano, St-Onge and Heymsfield2004). Consistent with the present findings, Lazzer et al. (Reference Lazzer, Boirie, Meyer and Vermorel2003) found that foot-to-foot impedance underestimated fat mass and percentage body fat when compared with DEXA in twenty male and thirty-three female overweight adolescents. Tyrell et al. (2001) compared body composition measured by foot-to-foot BIA and anthropometry to that measured by DEXA in a multi-ethnic group of eighty-two children aged between 4·9 and 10·9 years. However, in place of the manufacturer's equation used in the present study, they customised an equation based on their study population. In contrast to the findings of the present study, BIA overestimated rather than underestimated percentage fat (Tyrrell et al. Reference Tyrrell, Richards, Hofman, Gillies, Robinson and Cutfield2001). The use of different BIA equations and different DEXA technologies may explain the discrepancies. The present study used a fan-beam system, the aforementioned a pencil-beam machine. Also, in contrast to the present study, Sung et al. (Reference Sung, Lau, Yu, Lam and Nelson2001) also found that BIA overestimated fat mass and percentage fat in seventeen obese and thirty-two non-obese Hong Kong Chinese children aged between 7 and 18 years, but with narrower limits of agreement and smaller differences between methods than the present study. The different ethnicity and age range of the populations under study, as well as the different DEXA technologies used, may again at least partly explain this discrepancy.
There are some shortcomings to the present study. Although widely considered a gold-standard technique in the measurement of body composition, DEXA may not be universally acceptable. The present study used a fan-beam DEXA system, whose measures have been shown to differ from the older pencil-beam systems (Tothill & Hannan, Reference Tothill and Hannan2000; Genton et al. Reference Genton, Hans, Kyle and Pichard2002; Lohman & Chen, Reference Lohman, Chen, Heymsfield, Lohman, Wang and Going2005). Much previous validation of DEXA was carried out using pencil-beam machines (Lohman & Chen, Reference Lohman, Chen, Heymsfield, Lohman, Wang and Going2005), and validation of the fan-beam DEXA is ongoing (Chauhan et al. Reference Chauhan, Koo, Hammami and Hockman2003; Norcross & Van, Reference Norcross and Van2004; Lohman & Chen, Reference Lohman, Chen, Heymsfield, Lohman, Wang and Going2005; Genton et al. Reference Genton, Karsegard, Zawadynski, Kyle, Pichard, Golay and Hans2006). An assumption of DEXA is that anteroposterior thickness of the subject does not affect the measurement but there is some evidence to suggest that this is not the case, particularly at thicknesses greater than 25 cm (Lohman & Chen, Reference Lohman, Chen, Heymsfield, Lohman, Wang and Going2005). However, there may be less of an effect for subject thicknesses less than 20 cm (Lohman & Chen, Reference Lohman, Chen, Heymsfield, Lohman, Wang and Going2005) and use of the appropriate scan mode should help overcome this problem. Furthermore, other so-called ‘gold-standard’ techniques are not suitable for use in young children, and are not themselves free of limitations. The strengths of the present study lie with the large sample size and largely homogeneous population with respect to ethnicity and age.
In conclusion, in young children (boys and girls aged about 9 years), the two techniques are not directly interchangeable for individual children owing to the wide limits of agreement. However, the foot-to-foot BIA device may be suitable for use in large-scale epidemiological studies due to the high correlation and small mean differences between techniques, and its simplicity and its speed may offer particular advantage to children. Further validation studies would increase the utility of foot-to-foot BIA in individual children.
Acknowledgements
The present study was funded by Diabetes UK, Child Growth Foundation, Eli Lilly and London Law Trust. The paper was jointly written by all the authors and all took part in the study design. T. J. W. had the original idea and is guarantor for the EarlyBird study and L. D. V. is study coordinator. J. H. was responsible for the data analysis and writing the manuscript. B. S. M. provided statistical consultation for data analysis. A. N. J. was responsible for collection of the data. We also thank Sharan Griffin who was responsible for DEXA scanning. There are no conflicts of interest.


