


Malnutrition typically occurs in the last third of the gestation period in sheep and goats(Reference Cal-Pereyra, Acosta-Dibarrat and Benech1) because of the rapid increase in nutritional demands of the rapidly developing fetal placental unit and the decreased energy intake resulting from reduction in rumen volume(Reference Cal-Pereyra, Acosta-Dibarrat and Benech1,Reference Rook and Herdt2) . In China, the native Hu sheep is more susceptible to malnutrition during pregnancy due to its high fecundity with a reported average ovulation rate over 2·2–3·14(Reference Yue3). Previous studies suggest that malnutrition may result in a concurrent negative energy balance (NEB), which further leads to fat mobilisation stored in adipose tissue to provide energy(Reference Herdt4,Reference Esposito, Irons and Webb5) .
However, due to the lack of sufficient oxaloacetate, the acetyl-CoA produced by the oxidation of mobilised fat cannot enter the tricarboxylic acid (TCA) cycle and instead forms ketone bodies, which could lead to metabolic acidosis, electrolytic spoliation and dehydration, and neurological symptoms(Reference Cal-Pereyra, Acosta-Dibarrat and Benech1). In addition, excessive mobilisation of fatty acids accumulates in the liver and causes fatty liver, reducing endogenous glucose production and resulting in a vicious cycle, as the liver is considered to be the primary glucogenic organ(Reference Herdt4,Reference Chilliard, Ferlay and Faulconnier6) . To date, the pathogenesis is not completely known due to a lack of understanding of the changes in metabolites and the pathways involved, as well as the effect of treatments for malnutrition(Reference Cal-Pereyra, Acosta-Dibarrat and Benech1).
To date, normalising the metabolic parameters was the effective treatment for malnutrition, including providing additional energy sources and improving liver metabolic function. Glucose infusion was the common treatment, while a previous study indicated that glucose infusion could decrease neoglucogenesis, and rapid intravenous injection of glucose led to a transient hyperglycaemia and an increase in urine output(Reference Herdt and Emery7). In addition, oral glycerol can directly participate in gluconeogenesis by passage through the rumen(Reference Osman, Allen and Mehyar8) or being fermented in the rumen, producing propionate, the main precursor of glucose, which lead to the increase in blood glucose concentration by a relatively long period(Reference Hunt9), despite the fact that the proportion of ruminal degradation of glycerol and its absorption was inconsistent throughout different studies(Reference Omazic, Kronqvist and Zhongyan10,Reference Piantoni and Allen11) .
However, little research on glycerol treatment for gestational malnutrition in advanced pregnant ewes was conducted, as well as its effect on metabolic profiles. Choline was claimed to be able to improve liver function by increasing VLDL exportation from the liver in transition dairy cows(Reference Shahsavari, D’Occhio and Al Jassim12). However, due to various supplementation periods and duration, along with the level of supplementation, the consequences were inconsistent(Reference Shahsavari, D’Occhio and Al Jassim12). To the best of our knowledge, there was no research focused on the effect of choline chloride on the metabolic profiles in advanced pregnant ewes suffering from malnutrition.
Metabolomics technology makes it possible to explore global changes in metabolites and the involved metabolic pathways to better understand the disease process. Moreover, it has been used for biomarker identification, disease diagnosis and mechanism exploration in ruminants(Reference Ametaj, Zebeli and Saleem13–Reference Yang, Zheng and Zhao15). However, there is dearth of information regarding metabolic processes in advanced pregnant ewes suffering from malnutrition, as well as the effects of glycerol or rumen-protected choline chloride.
The pregnant ewes model is suitable for human nutrition research, particularly pregnant women suffering from malnutrition(Reference Barry and Anthony16,Reference Gonzalez-Bulnes, Astiz and Parraguez17) . This study hypothesises that a metabolomics approach would extend our understanding of changes in urine metabolites in malnutrition and further that glycerol or rumen-protected choline chloride would improve a metabolic disorder in advanced pregnant ewes suffering from malnutrition. Thus, the aim of the present study is to explore the metabolic profiles of pregnancy malnutrition induced by feed restriction (FR) and the counteracting effects of glycerol and rumen-protected choline chloride supplementation.
Materials and methods
The experimental design and procedures of this study have been approved by the Animal Care and Use Committee of Nanjing Agricultural University following the requirements of the Regulations for the Administration of Affairs Concerning Experimental Animals (The State Science and Technology Commission of People’s Republic of China, 1988. No. SYXK(Su)2015-0656).
Animals and experimental design
The first experiment is a continuation of previous research, where the malnutrition and lipid metabolism disorder in livers of ewes were induced by FR(Reference Xue, Guo and Hu18). Briefly, twenty pregnant Hu sheep (body weight 60·6 (sd 4·9) kg) carrying multiple fetuses with similar parity (2–3 parity) and a gestation period of 108 d were randomly divided into two groups after 7 d of adaption period. Each treatment group had ten replicated pens, and each pen had one ewe. The ewes in the control (CON) group were offered 100 % of their nutritional requirements as recommended by National Research Council (1·56 kg total mixed ration, DM basis), while the FR group was offered 30 % of feed intake of the CON for 15 d. The ewes were maintained in individual pens (2 × 2 m) with free access to water and in good health condition and were fed twice daily at 08.00 and 17.00 hours. The ingredients and chemical compositions of the total mixed ration in the first experiment are summarised in online Supplementary Table S1. The ambient temperature was maintained at 12–18°C, and the living environment was in accordance with animal welfare guidelines.
To explore the counteracting effects of glycerol and rumen-protected choline chloride supplementation on the malnutrition in advanced pregnant ewes suffering from malnutrition, the second experiment was designed. Eighteen pregnant Hu sheep (body weight 67·7 (sd 7·7) kg) with similar parity (2–3 parity) and a gestation period of 100 d were offered a feed intake comprising 30 % of the National Research Council-recommended nutritional requirements twice daily and had free access to water. Each treatment group had six replicated pens, and each pen had one ewe. The sheep were randomly divided into three groups: the feed restriction (FR2) group with no supplementation, the glycerol (GLY) group, which received 40 ml of glycerol (Nanjing Yunbo Chemical Co. Ltd) per d, and the rumen-protected choline chloride (RPC) group, which received 10 g of rumen-protected choline chloride (Hangzhou King Technology Feed Co. Ltd) per d. These dose of supplements were in accordance with previous studies(Reference de Veth, Artegoitia and Campagna19,Reference Baldi and Pinotti20) . The supplements were mixed with a portion of the morning diet to make sure the ewes consume all the supplements. The remaining diet was then provided to the ewes after consuming the first portion. The ewes were maintained in individual pens (2 × 2 m) and in good health condition and were fed twice daily at 08.00 and 17.00 hours. The ingredients and chemical compositions of the total mixed ration in the second experiment are summarised in online Supplementary Table S2. Supplements were given during morning feedings over a 9-d period. The ambient temperature was maintained at 12–18°C, and the living environment was in accordance with animal welfare guidelines.
Sampling procedures
On the 15th d of the first experiment, all the ewes were slaughtered 4 h after morning feeding. Instead of collecting liver samples as done in other studies, urine samples were collected only once from the bladder. On the ninth day of the second experiment, a sterile sponge was fixed to the urethral orifice of the ewe by a rope before morning feeding. The sponges were collected from each ewe within 4 h when the sponges were wet. This collection of urine samples was done once, and all the collected urine samples were stored in liquid N2 prior to analysis.
Liquid chromatography-MS analysis
Eight urine samples from ewes in each group were randomly selected in the first experiment, and all the ewes’ urine samples in the second experiment were used for metabolomics analysis. One hundred microlitres of the urine samples was mixed with 0·3 ml of methanol and 10 μl l-2-chlorophenylalanine (interior label), and the mixture was vortexed for 30 s and then centrifuged at 13 800 g for 10 min at 4°C. Two hundred microlitres of the supernatant was transferred to the injection vial. Four microlitres of urine samples were injected into the liquid chromatography-MS (LC/MS) system (Thermo, Ultimate 3000LC, Orbitrap Elite) with an Agilent C18 column (Hypergod C18, 100 mm × 4·6 mm × 3 μm) and maintained at 40°C.
The mobile phases A and B used water with 0·1 % (v/v) formic acid and acetonitrile with 0·1 % (v/v) formic acid with a flow rate of 0·3 ml/min. The elution procedure was 5 % B for 0–2 min, 5–95 % B for 2–12 min, 95 % B for 12–15 min and 95–5 % B for 15–17 min. MS was operated in either positive or negative ion mode. N2 was used as nebuliser gas with a flow rate of 8 litres/min, scan time of 0·03 s, interscan time of 0·02 s and scan range of 50–1000 m/z. Parameters for positive ion mode were as follows: heater temperature 300°C, sheath gas flow rate 45 arb, aux gas flow rate 15 arb, sweep gas flow rate 1 arb, spray voltage 3·0 KV, capillary temperature 350°C and S-Lens RF level 30 %. Parameters for negative ion mode were as follows: heater temperature 300°C, sheath gas flow rate 45 arb, aux gas flow rate 15 arb, sweep gas flow rate 1 arb, spray voltage 3·2 kV, capillary temperature 350°C and S-Lens RF level 60 %.
The raw data were preprocessed by SIEVE software (ThermoFisher Scientific) for LC/MS data where parameters were as follows: intensity threshold, 100 000; m/z range, 50–1000; m/z width, 10 ppm; frame time width, 0·5 min; retention time start and end values were 0·01–20 min, respectively. Then, they were normalised according to the interior label and post-edited in EXCEL 2010 software. The Kyoto Encyclopedia of Genes and Genomes Database (http://www.genome.jp/kegg) and the online Human Metabolome Database (http://www.hmdb.ca) were used to align the molecular mass data to identify metabolites, and a retention time index was used in the analysis. When the difference between theoretical mass and observed mass was <10 ppm, the metabolite would be reported and further validated by isotopic distribution measurement. Commercial reference standards were utilised to validate and confirm the urine metabolites with high confidence by comparison of their MS/MS spectra and retention time. The principal component analysis (PCA) and partial least squares-discriminate analysis (PLS-DA) were carried out in SIMCA-P software (Umetrics). Differentially expressed metabolites were identified according to variable importance in projection >1 and adjusted P < 0·05, which were obtained from PLS-DA and statistical analysis, respectively. The concentration table of differentially expressed metabolites was then imported in the module of ‘pathway analysis’ in website of MetaboAnalyst 4.0 (http://www.metaboanalyst.ca) for pathway enrichment analysis. The number of sheep per group were calculated by G*Power 3.1.9.4 assuming a hypothesised effect size F of 0·9, a type I error of 0·05 (two sided) and a statistical power of 0·80, based on F test using one-way ANOVA.
Results
Glucose and β-hydroxybutyric acid concentrations
During the whole experimental period, there were no adverse events. The blood concentrations of glucose and β-hydroxybutyric acid (BHBA) in the first experiment have been published(Reference Xue, Guo and Hu18) and are shown in online Supplementary Fig. S1(A) and (B). In summary, FR increased blood BHBA concentration (P < 0·001) and decreased blood glucose concentration (P < 0·001) in advanced pregnant ewes. The second experiment revealed that glycerol and RPC prevented a decrease in blood glucose concentration (P = 0·010) and an increase in blood BHBA concentration (P < 0·001) (online Supplementary Fig. S1(C) and (D), under review).
Liquid chromatography/MS compound identification and quantification
In total, LC/MS detected 431 and 445 unique and non-overlapping valid peaks in the urine samples of the first and second experiments, respectively. A total of 268 and 240 metabolites were identified and quantified in the first and second experiments, respectively.
Multivariate analysis
In the first experiment, the PLS-DA model explained 95·7 % (R 2Y) and predicted 89·2 % (Q 2) of the data. In the second experiment, the PLS-DA model explained 64·7 % (R 2Y) and predicted 68·2 % (Q 2) of the data when comparing the FR2 and GLY groups, while it explained 60 % (R 2Y) and predicted 62 % (Q 2) of the data when comparing the FR2 and RPC groups. These results indicated that the PLS-DA was an adequate model. The PCA and PLS-DA showed clear separation between the CON group and FR group in the first experiment (Fig. 1(a) and (b)) and among the FR2, GLY and RPC groups in the second experiment (Fig. 2(a)–(c)), indicating that there was a noticeable difference in urine metabolites between the CON and FR groups and among the FR2, GLY and RPC groups. In the first experiment, the first and second principal components of the PCA score plot accounted for 39·3 and 15·1 % of the variation, respectively (Fig. 1(a)), while PLS axis 1 explained 38·8 % and axis 2 explained 12·5 % of the variation, as shown in Fig. 1(b). In the second experiment, the first principal component of the PCA score explained 41·7 %, while the second one explained 23·9 % of the variation (Fig. 2(a)). The score plots of PLS-DA showed that PLS axes 1 and 2 explained 44·8 and 24·3 % of the variation, respectively, for the GLY and FR2 groups (Fig. 2(b)), and 33·0 and 27·2 % of the variation for the RPC and FR2 groups, respectively (Fig. 2(c)). One dot represents one observation sample, and the distance between two dots represents the similarity of the sample’s metabolite composition. In the present study, the PCA and PLS-DA revealed clear separations in urine metabolites between CON and FR groups (Fig. 1(a) and (b)). There was also clear distinction among the groups of FR2, GLY and RPC groups (Fig. 2(a)–(c)).

Fig. 1. (a) Principal component analysis (PCA) and (b) partial least squares-discriminate analysis (PLS-DA) scores plot of urine metabolites based on liquid chromatography/MS from control (CON) and feed restriction (FR) groups. CON, offered 100 % of their National Research Council recommended nutritional requirements; FR, restricted to 30 % of feed intake of CON. ![]() , CON;
, CON; ![]() , FR.
, FR.

Fig. 2. (a) Principal component analysis (PCA) scores plot of urine metabolites based on liquid chromatography (LC)/MS from the feed restriction group in the second experiment (FR2), glycerol (GLY) group and rumen-protected choline chloride (RPC) group. (b) Partial least squares-discriminate analysis (PLS-DA) scores plot of urine metabolites based on LC/MS from GLY and FR2 groups. (c) PLS-DA scores plot of urine metabolites based on LC/MS from RPC and FR2 groups. FR2, offered 30 % of the National Research Council (NRC)-recommended nutritional requirements; GLY, offered 30 % of the NRC-recommended nutritional requirements and received 40 ml of glycerol per d; RPC, offered 30 % of the NRC-recommended nutritional requirements and received 10 g of RPC per d. (a) ![]() , FR2;
, FR2; ![]() , GLY;
, GLY; ![]() , RPC; (b)
, RPC; (b) ![]() , FR2;
, FR2; ![]() , GLY; (c)
, GLY; (c) ![]() , FR2;
, FR2; ![]() , RPC.
, RPC.
Identification of different metabolites
Based on the criteria (variable importance in projection > 1 and corrected P < 0·05), there were 135 differentially expressed metabolites between the CON and FR groups (Table 1) in the first experiment. In the second experiment, there were thirty-three and thirty metabolites affected by GLY (Table 2) and RPC (Table 3), respectively, as compared with the FR2 group. In general, the different metabolites in this study were mainly involved in carbohydrates, amino acid and fatty acids metabolism. Specifically, compared with the CON group, FR decreased the level of d-glucose, lactic acid, levoglucosan, α-ketoglutarate, phosphohydroxypyruvic acid and glucose 6-phosphate, while increased the level of pyruvate and fumaric acid in urine. For different metabolites involved in lipid metabolism, all the carnitines, six species of phosphatidic acid (PA), all the phosphatidylglycerol (PG), one species of monoacylglycerol (MG), three species of fatty acid, including nervonyl carnitine, l-octanoylcarnitine acetylcarnitine, butyryl-l-carnitine, decanoyl-l-carnitine, l-hexanoylcarnitine, PA (19 : 3 (10Z,13Z,16Z)/0 : 0), PA (20 : 0/0 : 0), PA (14 : 0/0 : 0), PA (20 : 3 (8Z,11Z,14Z)/0 : 0), PA (22 : 6 (4Z,7Z,10Z,13Z,16Z,19Z)/0 : 0), PA (6 : 0/6 : 0), PG (12 : 0/0 : 0), PG (18 : 1 (9Z)/0 : 0), PG (O-18 : 0/17 : 0), PG (O-18 : 0/17 : 2 (9Z,12Z)), MG (0 : 0/16 : 1 (9Z)/0 : 0), decenedioic acid, 4-hydroxydodecanedioic acid and stearidonic acid were significantly increased, while only one species of PA, three species of MG, all the methyl donors and three species of fatty acids, including PA (O-18 : 0/19 : 1 (9Z)), proline betaine, acetylcholine, phosphocholine, phosphorylcholine, MG (0 : 0/20 : 4 (5Z,8Z,11Z,14Z)/0 : 0), MG (0 : 0/22 : 1 (13Z)/0 : 0), MG (16 : 0/0 : 0/0 : 0), eicosatrienoic acid, undecanedioic acid and hexadecanedioic acid were decreased in the FR group than in the CON group.
Table 1. Identification of significantly different metabolites in urine between ewes from control (CON) and feed restriction (FR) groups
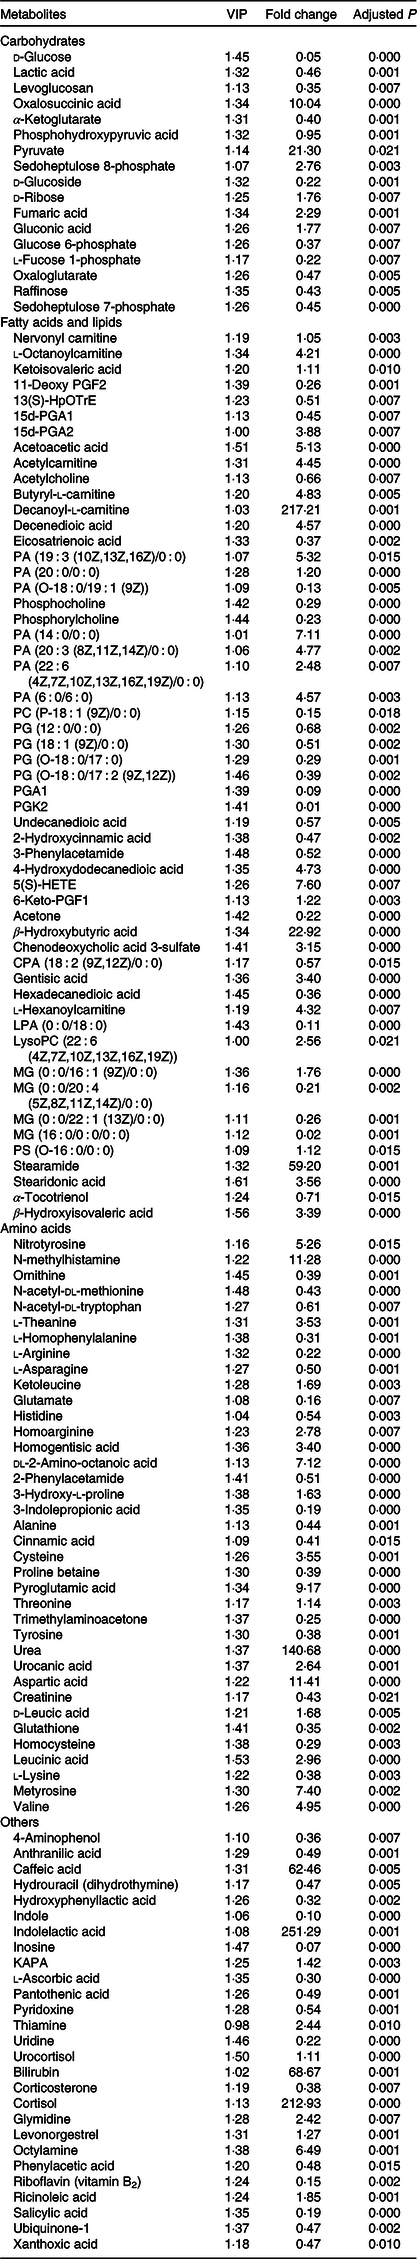
CON, offered 100 % of their National Research Council recommended nutritional requirements; FR, restricted to 30 % of feed intake of CON; VIP, variable importance in projection; fold change, mean peak area of FR group/mean peak area of CON group.
Table 2. Identification of significantly different metabolites in urine between ewes from the glycerol (GLY) group and feed restriction group in the second experiment (FR2)

GLY, offered 30 % of the National Research Council (NRC)-recommended nutritional requirements and received 40 ml of glycerol per d; FR2, offered 30 % of the NRC-recommended nutritional requirements; VIP, variable importance in projection; fold change, mean peak area of GLY group/mean peak area of FR2 group.
Table 3. Identification of significantly different metabolites in urine between ewes from the rumen-protected choline chloride (RPC) group and feed restriction group in the second experiment (FR2)

RPC, offered 30 % of the National Research Council (NRC)-recommended nutritional requirements and received 10 g of rumen-protected choline chloride (RPC) per d; FR2, offered 30 % of the NRC-recommended nutritional requirements; VIP, variable importance in projection; fold change, mean peak area of RPC group/mean peak area of FR2 group.
For different metabolites involved in amino acid metabolism, the ketogenic compounds (leucine and lysine) and the glycogenic amino acid (including alanine, cysteine, valine and aspartic acid) were increased, while the glycogenic amino acids (including glutamate, histidine, arginine, tyrosine and asparagine) were decreased in the FR group rather than the CON group.
In the second experiment, compared with the FR2 group, supplementing glycerol increased the levels of d-glucose, glucose-6-phosphate, malic acid, citric acid, α-ketoglutarate, succinic acid, l-tyrosine, l-proline and norepinephrine, while decreased the levels of 3-dehydroxycarnitine, l-octanoylcarnitine, glutaconylcarnitine, cholic acid and 7-ketodeoxycholic acid. Compared with the FR2 group, supplementing RPC increased the levels of proline betaine, acetylcholine, l-carnitine, decenedioic acid, l-proline, l-tyrosine and 2-ketoglutarate, while decreasing the levels of isovalerylcarnitine, LysoPA (8 : 0/0 : 0), MG (0 : 0/15 : 0/0 : 0), MG (0 : 0/16 : 0/0 : 0), BHBA, l-acetylcarnitine and propenoylcarnitine.
To comprehensively explore how the pathways changed in response to FR, glycerol and RPC, pathway enrichment analysis was performed based on various metabolites (Figs. 3–5). Through pathway topology analysis, the pathway was selected when the pathway impact value was higher than 0·1, which is the cut-off value for relevance. The pathway with its P value and impact value is listed in Table 4.Finally, to more intuitively observe metabolic profiles in malnutrition and the effect of glycerol or RPC on it, a metabolic network map was performed (Fig. 6).

Fig. 3. Metabolome view map of the differentially expressed metabolites identified in the ewes’ urine between the control (CON) and feed restriction (FR) groups. The CON group was offered 100 % of their National Research Council recommended nutritional requirements; the FR group was restricted to 30 % of feed intake of CON. The larger size indicates higher pathway enrichment, and the darker colour indicates higher pathway impact values.

Fig. 4. Metabolome view map of the differentially expressed metabolites identified in the ewes’ urine between the glycerol (GLY) group and feed restriction group in the second experiment (FR2). GLY, offered 30 % of the National Research Council (NRC)-recommended nutritional requirements and received 40 ml of glycerol per d; FR2, offered 30 % of the NRC-recommended nutritional requirements. The larger size indicates higher pathway enrichment, and the darker colour indicates higher pathway impact values. TCA, tricarboxylic acid.

Fig. 5. Metabolome view map of the differentially expressed metabolites identified in the ewes’ urine between the rumen-protected choline chloride (RPC) group and feed restriction group in the second experiment (FR2). RPC, offered 30 % of the National Research Council (NRC)-recommended nutritional requirements and received 10 g of RPC per d. FR2, offered 30 % of the NRC-recommended nutritional requirements. The larger size indicates higher pathway enrichment, and the darker colour indicates higher pathway impact values.
Table 4. Enriched pathways based on differentially expressed metabolites in different treatments

CON, control group; FR, feed restriction; GLY, glycerol group; FR2, FR in the second experiment; RPC, rumen-protected choline chloride.

Fig. 6. Overview of energy metabolism alteration in response to feed restriction, glycerol and rumen-protected choline chloride (RPC). ![]() , Significant increased metabolites in former group compared with the latter group;
, Significant increased metabolites in former group compared with the latter group; ![]() , no difference;
, no difference; ![]() , decrease; CON, offered 100 % of their National Research Council (NRC) recommended nutritional requirements; FR, restricted to 30 % of feed intake of CON; FR2, offered 30 % of the NRC-recommended nutritional requirements; GLY, offered 30 % of the NRC-recommended nutritional requirements and received 40 ml of glycerol per d; RPC, offered 30 % of the NRC-recommended nutritional requirements and received 10 g of RPC per d.
, decrease; CON, offered 100 % of their National Research Council (NRC) recommended nutritional requirements; FR, restricted to 30 % of feed intake of CON; FR2, offered 30 % of the NRC-recommended nutritional requirements; GLY, offered 30 % of the NRC-recommended nutritional requirements and received 40 ml of glycerol per d; RPC, offered 30 % of the NRC-recommended nutritional requirements and received 10 g of RPC per d.
Discussion
Urine metabolome alterations in malnutrition
The first objective of this study was to explore the changes in the urine metabolome in advanced pregnant ewes suffering from malnutrition. Previously, we discovered that malnutrition caused by FR resulted in lipid metabolism disorder in livers in pregnant ewes(Reference Xue, Guo and Hu18). In the present study, we attempted to explore the global metabolic profiles in urine based on LC/MS metabolomics. In this study, PCA and PLS-DA revealed a clear distinction between the CON and FR groups, indicating there was significant difference between the two groups, which was consistent with previous research that showed the metabolic condition would shift to catabolism from anabolism during NEB(Reference Garcia-Garcia21).
The body undergoes mobilisation of body reserves to support a balance of blood glucose. Lipids are physiological fuels with low water content and high energy density(Reference McCue22). In the present study, some fatty acids and all the carnitines in the urine increased in malnutrition. Given that high level of NEFA that exists in ruminants during NEB and carnitines function as transporters of fatty acids into the mitochondria for subsequent β-oxidation(Reference Drackley, Overton and Douglas23), the results of this study indicated increased mobilisation and subsequent β-oxidation of fatty acids in malnutrition.
Interestingly, we found that the level of cortisol was 212·9-fold greater in the FR group than that of the CON group. Cortisol has been proven to increase the hepatic and renal gluconeogenic enzyme activities, including glucose-6-phosphatase and aspartate transaminase(Reference Fowden, Mijovic and Silver24). A large increase in cortisol level in this study indicates that ewes suffering from malnutrition responsively increase endogenous glucose production through endocrine regulation. However, in this study, we observed lower levels of phosphohydroxypyruvic acid and glucose 6-phosphate and an increased pyruvate level in the FR group compared with the CON group. Moreover, the concentration of blood glucose was still low, and the concentration of BHBA was still high (online Supplementary Fig. S1(A) and (B)). The reason may be attributed to a disorder in gluconeogenesis.
Specifically, it seems as if the process of pyruvic acid producing phosphohydroxypyruvic acid and subsequent glucose 6-phosphate was blocked. Because the pyruvic acid produces oxaloacetate and then enters the malate shuttle to produce phosphohydroxypyruvic acid, while the acetyl-CoA produced by β-oxidation of mobilised fatty acids should also combine with oxaloacetate and enter a TCA cycle to provide energy. Thus, the oxaloacetate deficiency was related to a disorder in the process of transforming pyruvic acid into oxaloacetate, resulting in the hinderance of acetyl-CoA from entering the TCA cycle. This speculation was evidenced by previous study which showed that supplementation of biotin, a cofactor of pyruvate carboxylase function as a catalyst of the reaction of transforming pyruvic acid into oxaloacetate, increased blood glucose concentration and decreased TAG and NEFA concentration in transition dairy cows during NEB(Reference Wei, Yin and Zhao25).
In addition, the present study revealed that all the cholines (acetylcholine, phosphocholine and phosphorylcholine) and proline betaine decreased in the FR group. Betaine and cholines participate in the production of phosphorylcholine, which plays a key role in combining with TAG to synthesise VLDL(Reference Chandler and White26). These results indicated excessive mobilisation of fatty acids and accumulation in the liver due to insufficient methyl donors. Given that potential drain of phosphorylcholine may impair lipid membrane integrity(Reference Li, Agellon and Allen27), the abnormal level of membrane lipid (PA and PG), d-ribose and inosine in the FR group probably indicated the increased cell apoptosis, as malnutrition could induce macrophage apoptosis and significantly host immunosuppression, resulting in increased morbidity and mortality(Reference Rivadeneira, Grobmyer and Naama28).
In the present study, the ketogenic compounds (leucine and lysine) and the glycogenic amino acids (including alanine, cysteine, valine and aspartic acid) were increased, while the glycogenic amino acids (including glutamate, histidine, arginine, tyrosine and asparagine) were decreased in the FR group compared with the CON group. When the lipid level reaches critical threshold, the physiological switch from lipid-dominated catabolism to protein-dominated catabolism(Reference McCue22) and the amino acids mobilised from muscles become important gluconeogenesis substrates in malnutrition(Reference Ruderman29). The increased ketogenic compounds (leucine and lysine) probably indicate that the high level of BHBA in the FR group feedback inhibited their synthesis from the ketogenic compounds.
The decreased glycogenic amino acids (including glutamate, histidine, arginine, tyrosine and asparagine) which could enter TCA cycle likely indicate that they were used to provide energy. However, some other glycogenic amino acids (including alanine, cysteine, valine and aspartic acid) were increased. The increase in the levels of alanine and cysteine may be partly explained by the rise in pyruvic acid discussed above. Other causes of elevated alanine likely relate to liver glucogenic function, as alanine and glutamine are primary precursors of glucose in the liver and kidney, respectively(Reference Mithieux, Rajas, Gautier-Stein, Preedy and Patel30). In malnutrition, the gluconeogenesis in liver from alanine (an endergonic process) was replaced in the kidney and intestines (an exergonic process) from glutamine(Reference Mithieux, Rajas, Gautier-Stein, Preedy and Patel30). In the present study, the increased level of alanine and decreased level of glutamine was consistent with this finding.
Effect of glycerol or rumen-protected choline chloride supplementation on profiles of urine metabolome in advanced pregnant ewes
The second aim of this study was to determine the effects of the supplementations on the urine metabolome in ewes suffering from malnutrition. Glycerol may participate in gluconeogenesis directly or indirectly(Reference Ferraro, Mendoza and Miranda31). Glycerol showed potential to stabilise the concentrations of blood glucose and BHBA (online Supplementary Fig. S1). In the present study, we attempted to investigate the changes in the urine metabolome in ewes treated with FR. Compared with the FR2 group, supplementing glycerol increased the levels of d-glucose, glucose-6-phosphate, malic acid, citric acid, α-ketoglutarate and succinic acid, indicating increased gluconeogenesis in ewes receiving glycerol, which was consistent with a previous study in dairy cows(Reference Osman, Allen and Mehyar8). Interestingly, the level of norepinephrine was 2·3-fold greater in the GLY group than in the FR2 group. Norepinephrine, one of the catecholamines, was involved in inhibiting insulin secretion, stimulating glucagon secretion and increasing the gluconeogenic substrate supply(Reference Mitrakou32).
In addition, the pathway of citrate cycle (TCA cycle) (P < 0·001, impact value = 0·221) and glycolysis or gluconeogenesis (P = 0·083, impact value = 0·102) were also enriched when comparing the GLY group with the FR2 group. These results indicate that supplementing glycerol increased the TCA cycle and gluconeogenesis process by hormones, apart from being a precursor of glucose. In addition, we also found decreased levels of 3-dehydroxycarnitine, l-octanoylcarnitine, glutaconylcarnitine, cholic acid and 7-ketodeoxycholic acid in the GLY group, which could be attributed to its diminishment of fat mobilisation in the malnutrition discussed above.
Compared with the FR2 group, supplementing RPC increased the levels of proline betaine and acetylcholine. In line with previous studies, RPC and gastro-intestinal supplementation of choline and methionine up-regulated arterial levels of choline metabolites(Reference de Veth, Artegoitia and Campagna19,Reference Baldi and Pinotti20) . Although choline could be synthesised endogenously(Reference Zeisel33), the external choline was also required and the absence of choline, considered a lipotropic factor, could lead to fatty liver degeneration during the periparturient period and FR in dairy cows(Reference de Veth, Artegoitia and Campagna19,Reference Zom, van Baal and Goselink34,Reference Cooke, del Rio and Caraviello35) . We also found increased levels of l-carnitine and decreased levels of isovalerylcarnitine, l-acetylcarnitine, propenoylcarnitine, MG (0 : 0/15 : 0/0 : 0) and MG (0 : 0/16 : 0/0 : 0). A previous study indicated that choline deficiency can increase the serum carnitine level, decrease the tissue carnitine concentration, as well as the total body pool of carnitine and alter the carnitine turnover in rats(Reference Sheard and Krasin36).
Overview of energy metabolism alteration (Fig. 6) showed that, the significant decrease of glucose and glucose-6-phosphate levels was reversed by GLY but not RPC. However, both GLY and RPC reversed the increased BHBA level induced by FR. These results indicated the improved energy metabolism in the GLY and RPC groups when comparing with the FR2 group. The higher level of malic acid, α-ketoglutaric acid and glucose-6-phosphate in GLY group indicated that GLY improves NEB mainly by increasing gluconeogenesis, while, as expected, the RPC mainly by increasing the level of cholines to improve energy metabolism. In future studies, the combined effect of GLY and RPC on ewes suffering malnutrition should be investigated and also its underling mechanisms.
Conclusion
Urine metabolome analysis revealed that malnutrition clearly induced mobilisation of lipids and amino acids by hormones, leading to the disorder of lipid metabolism, amino acid metabolism and the TCA cycle. Both GLY and RPC counteracted some of these changes and modulated the urine metabolome in advanced pregnant ewes suffering from malnutrition. This study can be considered a reliable reference for human nutrition studies, and GLY and choline may have a positive role in pregnant human health.
Acknowledgements
The authors wish to thank Hossam-eldin Seddik for language and structure suggestions. The authors also thank Shanghai Sensichip Infotech Co. Ltd, Shanghai, People’s Republic of China.
This research was funded by the National Key Research and Development Program of China (grant number 2016YFD0501200), Jiangsu Agriculture Science and Technology Innovation Fund (grant number CX(18)2003) and Science and Technology Project of Huzhou City of China (grant number 2017GY18).
The authors’ contributions are as follows: C. G. and S. M. designed research; Y. X., Y. Y., H. X. and F. H. conducted research. C. G. and S. M. analysed data and wrote the paper. S. M. had primary responsibility for final content.
The authors declare that there are no conflicts of interest.
Supplementary material
For supplementary materials referred to in this article, please visit https://doi.org/10.1017/S000711452000063X


