


‘Trans-fatty acids (TFA) are unsaturated fatty acids with at least one double bond in the trans configuration’(Reference Brouwer, Wanders and Katan1). Recent evidence suggests that excessive consumption of TFA is linked to obesity(Reference Jacome-Sosa, Borthwick and Mangat2). Zhao et al. (Reference Zhao, Shen and Zhu3) found that high-trans-fat diets induced higher rates of obesity than standard diets in male C57BL/6 mice. In humans, high 18 : 2 TFA intake appears to increase visceral and subcutaneous adiposity(Reference Smit, Willett and Campos4).
Furthermore, some researchers have also shown a direct association between obesity and intestinal dysbiosis in male C57BL/6 mice(Reference Turnbaugh, Ley and Mahowald5). Since several animal studies have indicated that high-fat (HF) diets may lead to inflammation(Reference de La Serre, Ellis and Lee6), gut microbiota disarray and obesity(Reference Carvalho, Moura and Roquetto7) and that chronic metabolic disorders can be anticipated due to the abnormal microbiota. The most frequent report is that HF diets can significantly destroy the structure of the gut microbiome and promote the development of metabolic diseases(Reference Daniel, Gholami and Berry8). Hildebrandt et al.(Reference Hildebrandt, Hoffmann and Sherrill-Mix9) showed that ‘a HF diet based on saturated fatty acids alters gut microbiota, even typically reduces the number of Bacteroidetes, and increases the numbers of Firmicutes and Proteobacteria’ in RELMβ-knockout mice. Turnbaugh et al.(Reference Turnbaugh, Ley and Mahowald5) showed that the gut microbiota of ob/ob mice, which are hyperphagic and become morbidly obese, indicated an altered ratio of Bacteroidetes:Firmicutes, which are the two dominant bacterial divisions. Moreover, Ley et al.(Reference Ley, Turnbaugh and Klein10) observed a similar phenomenon in obese humans.
Although previous studies have shown that HF diets or high-SFA diets can cause changes in the gut microbiota composition that are associated with obesity(Reference de Wit, Derrien and Bosch-Vermeulen11), the mechanisms by which TFA influence the gut microbiota still remain obscure. Notably, only a few studies have investigated how a TFA-rich diet influences obesity by altering the gut microbiome. That excessive TFA consumption induces adverse effects on public health has received considerable attention, but the underlying mechanisms of how TFA influence the gut microbiota need to be further investigated.
Our present study examined the influence of TFA diets on gut microbiota though the use of rat models. Male Sprague–Dawley rats were fed low-fat or HF diets, some containing TFA, for 8 weeks; then, their blood and brain parameters were measured, and the 16S ribosomal DNA gene segments from the faecal samples were sequenced to investigate the impact of HF/TFA-rich diets on the gut microbiota.
Materials and methods
Animals and diets
All animal experiments in the present study were carried out in accordance with the Guidelines for the Care and Use of Laboratory Animals and approved by the Animal Experimentation Ethics Committee of Capital Medicine University (Ethics Review no. AEEI-2017-002). A total of forty male Sprague–Dawley rats (140–160 g), aged 5 weeks old, were purchased from Beijing Vital River Laboratory Animal Technology Co. Ltd (SCXK – (Jing) 2016-0011) and provided with a standard chow diet for 7 d for acclimation. Four weight-matched groups were randomly assigned to the rats (n 10 per group), including the basal diet, a HF diet, a HF diet with 1 % TFA and a HF diet with 8 % TFA. The specific diets were obtained from Beijing Keao Xieli Feed Co. Ltd. Animals were group-housed two per cage with an artificial environment (inverted 12 h light/dark cycle) and ad libitum access to water and food at the SPF Laboratory Animal Center. The rats were monitored daily and their body weights were recorded weekly. All faecal samples were collected from the rats aged 14 weeks old on two consecutive days for bacterial 16S ribosomal RNA (rRNA) high-throughput sequencing. At 16 weeks old, 12-h fasted rats were anaesthetised with 10 % chloral hydrate and then killed. The blood from the heart was collected with tubes for separation gel coagulation and EDTA anticoagulation. The serum and plasma were obtained, respectively, after centrifugation and stored at –80°C until analysis. The brain, perirenal adipose tissue, epididymal adipose tissue and the omental adipose tissue were collected and weighed for the related indices detection. The ratio of all adipose tissues collected:body weight was determined as the body fat ratio.
Three kinds of fat were used in the various diets: soyabean oil (all groups), lard (all groups) and partially hydrogenated soyabean oil (TFA-diet groups). Four types of diets, with low or high levels of lard or partially hydrogenated plant oil, were designed as follows: (1) the basal diet with a low level of lard (control (CON) group), (2) the HF diet with a high level of lard (diet-induced obesity (DIO) group), (3) the HF diet with a low level of partially hydrogenated soyabean oil (1 % TFA group) and (4) the HF diet with a high level of partially hydrogenated soyabean oil (8 % TFA group). The formulation and nutrient composition of the experimental diets are shown in Table 1.
Table 1. Formulation and nutrient composition of diets

CON, control; DIO, diet-induced obesity; 1 % TFA, high-fat diet with 1 % trans-fatty acids; 8 % TFA, high-fat diet with 8 % trans-fatty acids; TFA, trans-fatty acids.
Analysis of blood and brain parameters
The concentrations of serum lipids, TAG, total cholesterol and glucose were measured with the oxidase method, and HDL-cholesterol and LDL-cholesterol were measured with the direct method, which were used an AU480 automatic biochemical analyser (Olympus) and presented as mmol/l. The specific reagents were purchased from Xiamen Intec Products, Inc. The serum level of apo E was measured using immunoturbidimetry on a C501 automatic biochemical analyser and presented in mg/l. Relevant reagents were obtained from Beijing Bioassay Technologies Co. Ltd. The insulin level was analysed using a RIA on an XH-6080 Gamma RIA counter made in Xi’an. The reagents were from the Beijing North Institute of Biotechnology. Serum levels of insulin are shown in μIU/ml. In addition, the lipid profiles from the brain and plasma were measured by fast GC on a Shimadzu GC-2010 Gas Chromatograph equipped with a flame ionisation detector and split/splitless injector, which is similar to our previous study(Reference Fan, Zhao and Ding12), and presented as % and mg/ml.
Analysis of gut microbiota composition by high-throughput sequencing of the 16S ribosomal RNA gene
Six animals were randomly selected per group. A total of twenty-four faecal samples were collected with sterile materials for the 16S rRNA gene sequencing analysis. Faeces were collected with a piece of sterile filter paper from the rats directly after defecation in a clean cage. The faecal samples were placed in 15 ml Eppendorf tubes and frozen at –80°C immediately. All samples were then used in the 16S rRNA gene sequencing analysis. DNA was isolated using the E.Z.N.A.® Soil DNA Kit according to the instructions (Omega Bio-Tek). After DNA isolation, concentration and purification testing were conducted with a NanoDrop 2000 UV-vis spectrophotometer (Thermo Scientific), and the final DNA integrity was evaluated by 1 % agarose gel electrophoresis. The bacterial 16S rRNA hypervariable regions V3–V4 were PCR amplified with primers 338 F (5′-ACTCCTACGGGAG GCAGCAG-3’) and 806 R (5′-GGACTACHVGGGTWT CTAA T-3′) (GeneAmp 9700; ABI). The reaction conditions were denaturation at 95°C for 3 min, twenty-seven cycles of 95°C for 30 s, annealing at 55°C for 30 s, elongation at 72°C for 40 s and a final extension at 72°C for 10 min. PCR was performed in triplicate 20 μl mixture containing 2 μl of deoxyribonucleoside triphosphate (dNTP) Mix (2·5 mm each), 4 μl of 5 × FastPfu Buffer, 10 ng of template DNA, 0·8 μl of each primer (5 μm) and 0·4 μl of FastPfu Polymerase. The PCR products were recovered using a 2 % agarose gel, further purified with the AxyPrep DNA Gel Extraction Kit (Axygen Biosciences) and quantified with QuantiFluor™-ST (Promega). The purified amplicons were pooled in equimolar amounts and paired-end sequenced (2 × 300) using the Illumina MiSeq platform (Illumina Inc.) according to the manufacturer’s instructions by Majorbio Bio-Pharm Technology Co. Ltd. The raw reads were deposited into the National Center for Biotechnology Information (NCBI) Sequence Read Archive database (Sequence Read Archive accession: PRJNA555676). The operational taxonomic units (OTU) clustered the reads with 97 % similarity using Uparse (version 7.1; http://drive5.com/uparse/), and chimeric sequences were identified and removed by Uchime. The phylogenetic affiliation of each 16S rRNA gene sequence was analysed by the Ribosomal Database Project (RDP) Classifier algorithm (http://rdp.cme.msu.edu/) using the Silva (SSU132) 16S rRNA database with a confidence threshold of 70 %.
Statistical analysis
Data are presented as means with their standard errors or as medians. Statistical analyses were carried out using SPSS 20.0 software unless otherwise specified. The differences among groups were analysed using one-way ANOVA followed by a Bonferroni post hoc test with GraphPad Prism version 6.0 and Fisher’s protected least significant difference, or we used the Kruskal–Wallis H test followed by pairwise multiple comparisons. α-Diversity analyses, including community diversity parameters (Shannon and Simpson) and community richness parameters (Chao 1 and phylogenetic diversity), were calculated with version 1.30 of the mothur software. β-Diversity measurements, including principal component analysis based on the OTU level and the heat map, were visualised using the R package software(Reference Lozupone, Lladser and Knights13). The overall community difference was statistically analysed and visualised by R stats and the Python scipy package software. Clusters of Orthologous Groups (COG) category assignments were performed using phylogenetic investigation of the community by reconstruction of the unobserved states in PICRUSt 1.1.0. The statistical power of the test was 80 %, and the two-sided significance level was 0·05.
Results
Effect of trans-fatty acids on physiological parameters
Fig. 1 shows the body weight of each group of rats over time on the different diets. From the 3rd week to the 10th week, rats fed the HF diet (DIO group) or the HF diet containing TFA (1 and 8 % TFA groups) had significantly higher body weight gain than the rats fed the basal diet (CON group) (all P < 0·05). As shown in Fig. 2, the rat perirenal adipose, epididymal adipose and omental adipose tissues showed no significant differences among all groups (all P > 0·05). Compared with the CON group, the DIO, 1 % TFA and 8 % TFA groups exhibited elevated body fat ratios (P = 0·012, P = 0·048 and P = 0·017, respectively), while there was no significant difference in the body fat ratios among these three groups (all P > 0·05) (Fig. 2).

Fig. 1. Effects of diet on the body weight of rats. The black line represents the rats on the basal diet (![]() ); the yellow line represents the rats on the high-fat (HF) diet (
); the yellow line represents the rats on the high-fat (HF) diet (![]() ); the blue line represents the rats on the HF diet with 1 % trans-fatty acids (TFA) (
); the blue line represents the rats on the HF diet with 1 % trans-fatty acids (TFA) (![]() ) and the red line represents the rats on the HF diet with 8 % TFA (
) and the red line represents the rats on the HF diet with 8 % TFA (![]() ). Data are means with their standard errors (n 10). * P < 0·05, ** P < 0·01. Statistical analyses were performed with ANOVA and Fisher’s protected least significant difference post hoc test among the four groups.
). Data are means with their standard errors (n 10). * P < 0·05, ** P < 0·01. Statistical analyses were performed with ANOVA and Fisher’s protected least significant difference post hoc test among the four groups.

Fig. 2. Comparisons of percentage body fat in rats. (a) Comparison of the levels of epididymal fat among the four groups. (b) Comparison of the levels of perirenal fat among the four groups. (c) Comparison of the levels of omental fat among the four groups. (d) Comparison of the body fat ratios among the four groups. Data are means with their standard errors of each group (n 10). * P < 0·05. Statistical analyses were performed with ANOVA and Bonferroni test among the four groups. ![]() , Control (CON);
, Control (CON); ![]() , diet-induced obesity (DIO);
, diet-induced obesity (DIO); ![]() , 1 % trans-fatty acids (TFA);
, 1 % trans-fatty acids (TFA); ![]() , 8 % TFA.
, 8 % TFA.
Effect of different diets on blood and brain parameters
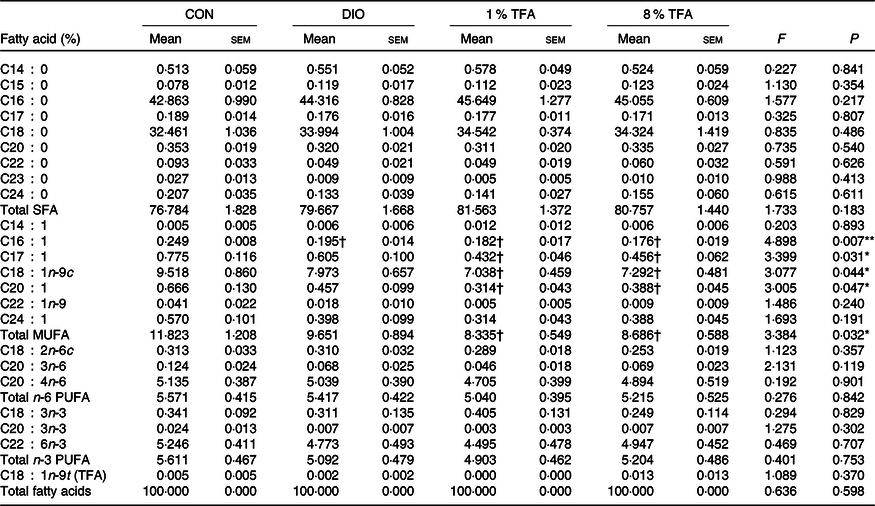
We then investigated the effects of dietary fatty acids components on several blood and brain parameters. Table 2 shows that the serum levels of total cholesterol, LDL-cholesterol and glucose of the DIO, 1 % TFA and 8 % TFA groups were significantly higher than those of the CON group (all P < 0·05), while these parameters showed no significant differences among the three HF-diet groups (all P > 0·05). The rats in the 8 % TFA group had a much higher insulin level than the other three groups (all P < 0·05) (Table 2). In addition, the lipid profiles in the brain and plasma of the animals were also assayed. The DIO, 1 % TFA and 8 % TFA groups showed significant decreases in C16 : 1 in the brain compared with the CON group (Table 3, all P < 0·05). The contents of C17 : 1, C18 : 1n-9c, C20 : 1 and total MUFA in the brain of the 1 % TFA and 8 % TFA groups were lower than those in the CON group (Table 3, all P < 0·05). As shown in Table 4, the concentrations of C14 : 0 and C16 : 1 in the plasma displayed a significant decrease in the DIO, 1 % TFA and 8 % TFA groups compared with the CON group (all P < 0·05). The C18 : 0 in the plasma of the DIO and 1 % TFA group was higher than that of the CON group (both P < 0·05), but the C18 : 0 concentration of the 8 % TFA group was lower than that of the DIO group (P < 0·05). Compared with those of the DIO and CON groups, the plasma levels of C18 : 1n-9c, total MUFA and C18 : 2n-6c were decreased in the 8 % TFA group (all P < 0·05). The total MUFA of the 1 % TFA group were lower than that of the CON group (P < 0·05), and the level of C18 : 2n-6c in the 1 % TFA group was lower than that in the DIO and CON groups (both P < 0·05). Moreover, the 8 % TFA group showed a significant increase in plasma C18 : 1n-9t (TFA) concentration compared with the other groups (all P < 0·05). The other blood and brain parameters did not show significant differences among the four groups (all P > 0·05).
Table 2. Serum lipids, glucose, Apo E and insulin (INS) levels of rats in different groups (n 10 per group)
(Mean values with their standard errors)
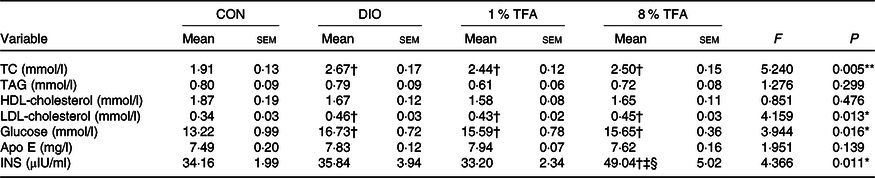
CON, control; DIO, diet-induced obesity; 1 % TFA, high-fat diet with 1 % trans-fatty acids; 8 % TFA, high-fat diet with 8 % trans-fatty acids; TC, total cholesterol.
* P < 0·05, ** P < 0·01.
† P < 0·05, compared with CON group.
‡ P < 0·05, compared with DIO group.
§ P < 0·05, compared with 1 % TFA group.
Table 3. Effect of diets on the fatty acid composition of brain (n 8 per group)
(Mean values with their standard errors)
CON, control; DIO, diet-induced obesity; 1 % TFA, high-fat diet with 1 % trans-fatty acids; 8 % TFA, high-fat diet with 8 % trans-fatty acids; TFA, trans-fatty acids.
* P < 0·05, ** P < 0·01.
† P < 0·05, compared with CON group.
Table 4. Effect of diets on the fatty acid composition of plasma (n 10 per group)
(Mean values with their standard errors)

CON, control; DIO, diet-induced obesity; 1 % TFA, high-fat diet with 1 % trans-fatty acids; 8 % TFA, high-fat diet with 8 % trans-fatty acids; TFA, trans-fatty acids.
* P < 0·05, ** P < 0·01, *** P < 0·001.
† P < 0·05, compared with CON group.
‡ P < 0·05, compared with DIO group.
§ P < 0·05, compared with 1 % TFA group.
Effect of diet type on gut bacterial diversity and richness
The effect of dietary types on bacterial diversity and richness within the gut microbiota was then measured by the Shannon–Weaver diversity index, Simpson diversity index, Chao 1 richness index and phylogenetic diversity index at the bacterial OTU level. As shown in Fig. 3, no significant differences in the microbial diversity and richness among the four groups were discovered at the OTU level (all P > 0·05).

Fig. 3. Comparisons of α-diversities of the gut microbiota among the four groups. Bacterial community diversity was measured by (a) the Shannon index, (b) the Simpson index, (c) the Chao 1 index and (d) the phylogenetic diversity (PD) index in the four groups. Data are means with their standard errors of each group (n 6). * P < 0·05, ** P < 0·01. Statistical analyses were performed with ANOVA and Bonferroni test. ![]() , Control (CON);
, Control (CON); ![]() , diet-induced obesity (DIO);
, diet-induced obesity (DIO); ![]() , 1 % trans-fatty acids (TFA);
, 1 % trans-fatty acids (TFA); ![]() , 8 % TFA. OTU, operational taxonomic units.
, 8 % TFA. OTU, operational taxonomic units.
Structural changes in the gut microbial communities
A principal component analysis of the Euclidean distance metric showed significantly separated clustering of the gut microbiota structure between the CON group and the other dietary groups (analysis of similarity, R 0·352; P = 0·001); the main principal component (PC) scores were PC1 = 41·51 % and PC2 = 14·08 %. These results demonstrated that there were clear differences in microbial compositions when rats were fed different diets (Fig. 4(a)). The box plots represent the dispersion of the distribution of different groups on the PC1 axis (Fig. 4(b)).

Fig. 4. Principal component (PC) analysis (PCA) of bacterial operational taxonomic unit (OTU) level in four different diet groups (n 6 per group). (a) PC1 explained 41·51 % of the variation, and PC2 explained 14·08 %. (b) The box plots represent the dispersion of the distribution of different groups on the PC1 axis. ![]() , Control (CON);
, Control (CON); ![]() , 8 % trans-fatty acids (TFA);
, 8 % trans-fatty acids (TFA); ![]() , 1 % TFA;
, 1 % TFA; ![]() , diet-induced obesity (DIO).
, diet-induced obesity (DIO).
Distinct microbial community profiles were observed among the dietary groups at the phylum and genus levels. The dominant phyla in the four groups were Firmicutes, Bacteroidetes, Proteobacteria, Tenericutes and Verrucomicrobia. The proportions of Firmicutes in the four groups were 56·48 % (CON), 52·19 % (DIO), 58·89 % (1 % TFA) and 60·61 % (8 % TFA). The proportions of Bacteroidetes were 38·91, 41·33, 35·98 and 32·68 %, respectively. The percentage of Proteobacteria in the CON group (2·96 %) was lower than that in the DIO, 1 % TFA and 8 % TFA groups (4·48, 3·47 and 3·58 %, respectively). The proportions of Tenericutes showed no significant differences across the diet groups (1·22, 1·28, 1·15 and 1·19 %, respectively); likewise, the proportions of Verrucomicrobia were 0·00, 0·49, 0·00 and 1·62 %, respectively. The dominant genus of the intestinal microbiota was Bacteroides. Detailed information on the proportions of the microbial community is shown in Fig. 5. The heat map also displayed the microbial community structures at the phylum and genus levels of the gut microbiota across all four diet groups (Fig. 6).

Fig. 5. Average composition of taxa among the rats consuming different diets (n 6 per group). (a) Overall structures of the gut microbiota at the phylum level. (b) Overall structures of the gut microbiota at the genus level. CON, control; DIO, diet-induced obesity; 1 % TFA, high-fat diet with 1 % trans-fatty acids; 8 % TFA, high-fat diet with 8 % trans-fatty acids.

Fig. 6. Heat map analyses of abundant phyla and genera in each group. The y-axis is a neighbour-joining phylogenetic tree; each row is a different phylotype. The colour of the spots in the right panel represents the mean relative abundance of the phyla in each group (n 6 per group). (a) Heat map of the gut microbiota at the phylum level in each group. (b) Heat map of the abundant genera. CON, control; DIO, diet-induced obesity; 1 % TFA, high-fat diet with 1 % trans-fatty acids; 8 % TFA, high-fat diet with 8 % trans-fatty acids.
Taxonomy-based comparisons of the intestinal microbiota
We further compared the relative proportions of gut microbiota in all groups at the phylum and genus levels by the Kruskal–Wallis H test. No significant differences were observed in the relative abundance of gut microbiota at the phylum level (Fig. 7(a), P > 0·05), but at the genus level, Bacteroides and Muribaculaceae showed different abundances among the diet groups (Fig. 7(b)). The proportion of genus Bacteroides was increased in the DIO (P = 0·0133) and 1 % TFA (P = 0·0071) groups compared with the CON group. The proportions of Muribaculaceae in the DIO, 1 % TFA and 8 % TFA groups were lower than that in the CON group (all P < 0·001).

Fig. 7. Comparisons of relative abundance (percentage of sequences) of the top five main bacterial phyla and genera (n 6 per group). (a) Comparison of dominant phyla among diet-induced obesity (DIO), 1 % trans-fatty acid (TFA) and 8 % TFA and control (CON) groups. (b) Comparison of dominant genera in the DIO, 1 % TFA, 8 % TFA and CON groups. (c) Comparison of the genus Bacteroides between two groups. (d) Comparison of Muribaculaceae in any two groups. * P < 0·05, ** P < 0·01, *** P < 0·001. Statistical analyses were performed with the Kruskal–Wallis H test followed by pairwise multiple comparisons among the four groups. (a) and (b): ![]() , CON;
, CON; ![]() , DIO;
, DIO; ![]() , 1 % TFA;
, 1 % TFA; ![]() , 8 % TFA; (c) and (d):
, 8 % TFA; (c) and (d): ![]() , CON;
, CON; ![]() , 8 % TFA;
, 8 % TFA; ![]() , 1 % TFA;
, 1 % TFA; ![]() , DIO.
, DIO.
Metagenomic comparisons by functional investigations
The predicted proteins were functionally categorised and assessed on COG, and the distribution in each category is displayed by box plots in Fig. 8. In these COG categories, the cluster for ‘carbohydrate transport and metabolism’ displayed the largest abundance among all groups, followed by ‘transcription’, ‘function unknown’ and ‘amino acid transport and metabolism’ clusters. Table 5 shows that the five functional categories were significantly different across the four dietary groups (P < 0·05). Compared with the CON group, the functional category called ‘intracellular trafficking, secretion and vesicular transport’ showed a marked increase in the 8 % TFA group (P < 0·05). Compared with the DIO group, the functional category called ‘replication, recombination and repair’ indicated a significant increase in the 8 % TFA group (P < 0·05). Compared with the 8 % TFA group, the functional categories showed marked decreases in the CON, DIO and 1 % TFA groups, including ‘transcription’, ‘general function prediction only’ and ‘function unknown’ (P < 0·05).

Fig. 8. Clusters of orthologous group (COG) functional classification among four dietary groups (n 6 per group). (a) Abundance of COG functional categories in the control (CON) group. (b) Abundance of COG functional categories in the diet-induced obesity (DIO) group. (c) Abundance of COG functional categories in the 1 % trans-fatty acid (TFA) group. (d) Abundance of COG functional categories in the 8 % TFA group. Boxes represent the interquartile range (IQR) between the top quartile and the bottom quartile. The lines inside the boxes indicate medians, and the whiskers represent the minimum and maximum values within 1·5 × IQR. The circles denote the outliers outside 1·5 × IQR.
Table 5. Comparisons of clusters of orthologous group functional abundance among four dietary groups
(Median values)

CON, control; DIO, diet-induced obesity; 1 % TFA, high-fat diet with 1 % trans-fatty acids; 8 % TFA, high-fat diet with 8 % trans-fatty acids.
* P < 0·05.
† P < 0·05, compared with CON group.
‡ P < 0·05, compared with DIO group.
§ P < 0·05, compared with 1 % TFA group.
Discussion
‘Diet is one of the most important determinants of human health’(Reference Turnbaugh, Ridaura and Faith14). Although the intake of TFA has decreased considerably over the past two decades(Reference Brouwer, Wanders and Katan1), ‘partially hydrogenated plant oils or margarine are also widely used in the daily foods, such as deep-fried and packaged snacks, leading to the inevitable intake of TFAs’(Reference Lichtenstein15). Some animal and human studies have linked the intake of HF and TFA diets to the risk of obesity. Chajès et al.(Reference Chajès, Biessy and Ferrari16) found that doubling elaidic acid intake showed a trend of a risk of weight gain during the 5-year follow-up, particularly in women. The results from our study showed the HF diet and two types of TFA diets increased the body weights in the 1 % TFA, 8 % TFA and DIO groups of the rats, which is consistent with the research conducted by Chajès et al.(Reference Chajès, Biessy and Ferrari16). At the end of our study, due to the Morris water maze test, the overall weight of rats decreased, but the body weights in test groups were still higher than that in the CON group (all P < 0·05). Axen et al. (Reference Axen, Dikeakos and Sclafani17) reported that HF diets with high amounts of TFA produced obesity in rats. Moreover, Smit et al.(Reference Smit, Willett and Campos18) suggested that ‘specific TFA isomers may have divergent effects on adiposity’. However, others did not observe obvious relationships between TFA consumption and body weight(Reference Chajès, Biessy and Ferrari16). An animal study showed that TFA diets did not induce weight gain in the low-fat or HF diet groups of C57BL/6 mice(Reference Ge, Liu and Tao19). Therefore, the causal relationship between TFA consumption and obesity needs additional investigation. Our results also showed that the serum concentrations of total cholesterol, LDL-cholesterol and glucose were significantly higher in the 1 % TFA, 8 % TFA and DIO groups, which are consistent with the findings of previous studies(Reference Uauy, Aro and Clarke20,Reference Mozaffarian, Aro and Willett21) . Some clinical and animal studies also showed that increasing TFA intake resulted in a significant elevation of LDL-cholesterol accompanied by a lesser decrease in HDL-cholesterol levels(Reference Mauger, Lichtenstein and Ausman22,Reference Awney23) . Interestingly, compared with the other three groups, the insulin was markedly higher in the 8 % TFA group. Furthermore, Mohammed et al. (Reference Mohammed, Tang and Jahangiri24) found that HF diets increased the risk for insulin resistance by triggering inflammation, which might be mediated by specific commensal bacteria. These results demonstrated that TFA consumption might lead to adverse serum parameter effects and obesity in rats.
In addition, the lipid profiles revealed that most MUFA showed a significant decrease in both the brain and plasma of the TFA groups. The levels of C18 : 2n-6c (linoleic acid) were strikingly decreased in the plasma of both TFA groups. These changes were balanced by an increase in C18 : 1n-9t (TFA), particularly in the plasma. The results of Phivilay et al. (Reference Phivilay, Julien and Tremblay25) support this phenomenon, indicating that most TFA are produced at the expense of decreases in linoleic acid. In addition, Albouery et al. (Reference Albouery, Buteau and Grégoire26) pointed out that intestinal colonisation by a microbiota profoundly modified the brain lipid composition. Our study showed that TFA could lead to modifications of lipid profiles in the brain and plasma.
‘The nutritional value of food is influenced partly by gut microbiota and its component genes’(Reference Turnbaugh, Ridaura and Faith14), and at the same time, the gut microbiota is influenced by daily diets. Understanding the relationships between the structure of intestinal microbial communities and dietary components is essential when studying the effect of diets on human health. Although the test groups did not show decreased gut microbial diversity or richness at the OTU level, the distinct clustering of the test groups in the principal component analysis plot was very different than the CON group in the present study. Lin et al. (Reference Liu, Zou and Chen27) reported that the intestinal microbiota structures of standard chow diet and HF diet groups were also markedly separated from each other in the principal coordinates analysis plot, which is similar to our outcome. According to the results of Tomas et al. (Reference Tomas, Mulet and Saffarian28), a HF diet reduced the diversity and richness of the faecal microbiota in C57BL/6 mice, which is different from our outcome. The differences in our conclusion might be due to using different proportions of TFA.
We found that the composition of the gut microbiota differed among the diet groups at the phylum level. The most abundant bacterial phylum in the faecal bacterial community was Firmicutes, followed by Bacteroidetes, then Proteobacteria. Ge et al.(Reference Ge, Liu and Tao19) observed that the second most abundant phylum in the intestinal microbial community of mice fed TFA diets is Proteobacteria, which is consistent with our findings. We also observed that the proportion of the phylum Proteobacteria did increase in the DIO, 1 % TFA and 8 % TFA groups, but these differences were NS (P > 0·05). Proteobacteria is a potential diagnostic criterion for several chronic diseases, such as CVD, inflammatory bowel disease and colitis-associated colorectal cancer(Reference Shih, Manzi and Shaw29,Reference Shin, Whon and Bae30) . Many previous studies have reported an increase in the abundance of Proteobacteria in inflammatory bowel disease(Reference Seksik, Sokol and Lepage31).
The results from our study showed that compared with that in the CON group, the abundance of the phylum Firmicutes decreased in the DIO group, instead of increasing in the 1 % TFA and 8 % TFA groups. In contrast, the proportion of the phylum Bacteroidetes increased in the DIO group, instead of decreasing in the 1 % TFA and 8 % TFA groups. This trend was particularly obvious in the 8 % TFA group rather than in the 1 % TFA group. However, these differences were NS (P > 0·05). Previous studies showed obese mice induced by a HF diet or by leptin administration harboured gut microbiota enriched in the phylum Firmicutes and depleted in Bacteroidetes(Reference Turnbaugh, Ley and Mahowald5,Reference Ley, Backhed and Turnbaugh32) . Another report indicated that the relative abundance of Bacteroidetes was reduced in faecal samples from twelve obese human subjects(Reference Ley, Turnbaugh and Klein10). These findings are consistent with the results in the 1 % TFA and 8 % TFA groups of our study. A similar study also showed a significant decrease in the proportion of the phylum Bacteroidetes in the TFA groups, contrary to the non-TFA groups, in mice(Reference Ge, Liu and Tao19), and likewise, a reduction in the phylum Bacteroidetes has been linked to several metabolic diseases, such as diabetes and cardiac diseases(Reference Yamashita, Emoto and Sasaki33).
Furthermore, our results included comparisons at the genus level of gut microbiota. Compared with the CON group, the genus Bacteroides increased in the DIO and 1 % TFA groups (P < 0·05). Some early studies demonstrated that a combination of a HF/high-sugar diet elevated Bacteroides species, leading to dysbiosis, in agreement with our results(Reference Agus, Denizot and Thevenot34). Moreover, our results are in accordance with a previous report by Schwiertz et al.(Reference Schwiertz, Taras and Schafer35), who showed that the proportion of Bacteroidetes was significantly enriched in overweight and obese subjects. Zhang et al.(Reference Zhang, DiBaise and Zuccolo36) found that Prevotellaceae within the class Bacteroidetes was significantly increased in obese individuals. Carvalho et al. (Reference Carvalho, Moura and Roquetto7) and Yang et al.(Reference Yang, Lee and Kim37) showed that the potentially beneficial Bacteroides acidifaciens was not depressed in mice in response to a trans-fat diet, which is consistent with our results. Some studies have linked Bacteroides abundance to the consumption of a diet rich in animal adipose and protein(Reference Lawrence, Corinne and Rachel38,Reference De Filippis, Pellegrini and Laghi39) . In conclusion, the increase in Bacteroides caused by intake of TFA or HF diets indicated that the gut microflora of the rats was disordered. In our results, Muribaculaceae decreased in the DIO, 1 % TFA and 8 % TFA groups (P < 0·01). A related report also showed that the intake of TFA diets decreased the relative abundance of Muribaculaceae in mice(Reference Ge, Liu and Tao19). Tomas et al. (Reference Tomas, Mulet and Saffarian28) found that the relative abundance of Muribaculaceae was significantly lower in HF diet-fed mice. In a recent study carried out by Deng et al. (Reference Deng, Li and Sun40), the fluctuation in Muribaculaceae in the intestinal tracts may have significant effects on inflammation and the rate of tumourigenesis.
Many potential functions of the gut microbiota influence whole-body metabolism and play key roles in the pathology of obesity(Reference Everard, Lazarevic and Gaia41). Among the functional categories, we observed that most COG categories were generally increased in the 8 % TFA group, including ‘transcription’, ‘general function prediction only’, ‘function unknown’ and ‘intracellular trafficking, secretion and vesicular transport’, compared with the CON group; including ‘transcription’, ‘replication, recombination and repair’, ‘general function prediction only’ and ‘function unknown’, compared with the DIO group; and including ‘transcription’, ‘general function prediction only’ and ‘function unknown’, compared with the 1 % TFA group. Many of these COG potentially relate to adiposity, obesity and energy balance regulation(Reference Hou, Kwok and Zheng42). We assumed that the significant differences in functional categories among the 8 % TFA group and other three groups might be linked to the proportion of TFA. Everard et al. (Reference Everard, Lazarevic and Gaia41) also found that HF diets increased the proportion of COG related to obesity in mice, such as the sugar-specific phosphotransferase system, ABC transporters and cell motility. Hence, we assumed that the structural changes in the gut microbial communities in response to dietary components induce alterations in physiological functions, potentially influencing the host metabolism.
The rat and human gut microbiota are similar at the phylum level, but different at the genus level. Furthermore, diversity of the intestinal microbiome in rats may exceed that in humans by 2–3 times(Reference Manichanh, Reeder and Gibert43). Due to the higher diversity of the microbiome, the rat is a suitable animal model for analysing the causal link between obesity and gut microbiota. Our study has the following limitations. First, we did not perform a metabolomics analysis of the faecal samples. This analysis would be helpful to explain how the TFA/HF diets influenced the gut microbiota. Second, no population research was conducted. Although our present results were obtained from rats and cannot be applied directly to humans, this study could provide the theoretical guidance in human studies and open the door for comparable investigations of the interactions between humans and their microbial communities.
Conclusion
In summary, the HF/TFA-rich diets could induce obesity, adverse serum parameters, modifications of lipid profiles in the brain and plasma and gut dysbiosis. Based on the hypotheses of Mohammed et al. (Reference Mohammed, Tang and Jahangiri24) and Albouery et al. (Reference Albouery, Buteau and Grégoire26), we speculated that dietary TFA might lead to modifications of insulin level in the serum and lipid profiles in the brain and plasma through the gut microbiota. All of the results demonstrated links between the HF/TFA-DIO and dysfunction of the gut microbiota, including adverse blood and brain parameters, an increase in Bacteroidetes, a decrease in Muribaculaceae, etc. Dysbiosis of the gut microbiota caused by the intake of HF/TFA-rich diets might play roles in multiple metabolic diseases, such as obesity(Reference Ge, Liu and Tao19,Reference Cani, Bibiloni and Knauf44,Reference Lecomte, Kaakoush and Maloney45) . Our results indicated that the gut microbiome has potential for use as a biomarker and as a new therapeutic target for obesity.
Acknowledgements
The study was financed by the grants from the National Natural Science Foundation of China (grants no. 81773406 and no. 81472982).
W. M. conceived and designed the study; R. F. and C. T. carried out major experiments; Y. H. performed the statistical analyses; X. Q. and M. Z. collected the data; Y. H. and L. Z. wrote the manuscript; R. X. and W. M. interpreted the data and revised the manuscript. All authors read and approved the final manuscript.
The authors declare no conflicts of interest.


