


Dietary protein restriction is one of the major components of therapy in chronic kidney disease (CKD), and it can slow the progression of renal failure. However, dietary protein restriction could have adverse effects on patients with CKD, as it might aggravate malnutrition and loss of muscle mass( Reference Lucas, Meadows and Roberts 1 ). Although a low-protein diet with ketoanalogues of amino acids (ketoacids; KA) is known to improve nutritional status and reduce muscle atrophy among patients with CKD( Reference Jahn, Rose and Schmitt 2 ), the mechanism of its preventive effects on muscle atrophy in CKD remains unclear.
The principal mechanism causing muscle atrophy in CKD involves activation of the ubiquitin–proteasome system (UPS)( Reference Rajan and Mitch 3 ). In the UPS, proteins are tagged through covalent attachment of a chain of ubiquitin molecules to their proteolytic substrates for degradation by the 26S proteasome. The 26S proteasome is composed of one 20S core proteasome and two 19S complexes. The 19S complex can also catalyse the unfolding of substrate proteins and facilitate transport of the unfolded proteins into the 20S core proteasome, which carries protease activities including chymotrypsin- and trypsin-like activities( Reference Lee, Schwartz and Prakash 4 ). Meanwhile, it has been reported that chymotrypsin- and trypsin-like activities and protein abundance of ubiquitin are elevated in compression-induced muscle atrophy( Reference Siu, Teng and Pei 5 ). Moreover, two new ubiquitin ligases have been found to be specifically involved in myofibrillar protein degradation, namely muscle atrophy F-box/atrophy gene-1 (MAFbx/atrogin-1) and muscle ring finger-1 (MuRF1)( Reference Bodine, Latres and Baumhueter 6 , Reference Gomes, Lecker and Jagoe 7 ). MAFbx and MuRF1 knockout mice have been found to be partially resistant to denervation atrophy of skeletal muscle( Reference Bodine, Latres and Baumhueter 6 ). MuRF1 knockout mice have been found to be resistant to muscle atrophy caused by dexamethasone treatment( Reference Baehr, Furlow and Bodine 8 ), while the knockout of MAFbx spares muscle mass deterioration in fasting animals( Reference Cong, Sun and Liu 9 ).
Besides, as a tightly regulated process of programmed cell death, apoptosis can lead to cell death in mononucleated cells, but can cause cell atrophy in multinucleated cells such as myocytes( Reference Allen, Linderman and Roy 10 ). Recently, apoptosis of skeletal muscle has been increasingly recognised as a contributory factor to the pathogenesis of muscle atrophy with ageing and in chronic diseases( Reference Busquets, Deans and Figueras 11 , Reference Dirks and Leeuwenburgh 12 ). In addition, caspases, a family of cysteine proteases, have been disclosed to be involved in the initiation and execution of apoptosis as well as myofibrillar proteolysis in skeletal muscle. Among them, caspase-3 can perform initial cleavage by cutting actomyosin, thereby producing substrates that can be rapidly degraded by the UPS( Reference Du, Wang and Miereles 13 ). This cleavage process of caspase-3 can be identified as it leaves behind a characteristic 14 kDa C-terminal fragment of actin, which is detectable in the insoluble fraction of muscle proteins( Reference Du, Wang and Miereles 13 ). Caspase-3 activation and subsequent protein degradation are triggered by the released cytochrome c from the mitochondria in response to changes in the ratio of pro- and anti-apoptotic members of the Bcl-2 family of proteins( Reference Dupont-Versteegden 14 ). Additionally, increased pro-apoptotic signalling through the mitochondrial Bcl-2 family has been identified as an important mechanism leading towards muscle cell loss and atrophy( Reference Bua, McKiernan and Wanagat 15 , Reference Leeuwenburgh 16 ). Enhanced Bax expression and increased Bax:Bcl-2 ratio have been reported in the skeletal muscles of aged experimental animals( Reference Song, Kwak and Lawler 17 ).
Moreover, the Wnt7a/Akt/p70S6K signalling pathway also serves as one of the critical pathways involved in maintaining skeletal muscle mass. Wnt7a bypassing signals through the receptor Fzd7 can activate the planar-cell-polarity pathway and drive the symmetric expansion of satellite stem cells that increase the repair of skeletal muscle. In differentiated myofibres, binding of Wnt7a to Fzd7 directly activates the Akt/p70S6K growth pathway, thereby inducing myofibre hypertrophy( Reference von Maltzahn, Bentzinger and Rudnicki 18 , Reference Le Grand, Jones and Seale 19 ). The reason for this is that Akt, a serine/threonine kinase, can be activated predominantly in response to Wnt7a. Once fully activated, Akt dissociates from the plasma membrane and phosphorylates the fork-head transcription factors (FoxO1, -3 and -4)( Reference Stitt, Drujan and Clarke 20 ), and consequently enters the nucleus to stimulate the transcription of MAFbx and MuRF1. Meanwhile, Akt activates another target protein p70S6K, which can block the up-regulation of both MAFbx and MuRF1, ultimately inhibiting protein degradation and increasing protein synthesis via its downstream target 4E (eIF4E) binding protein 1 (4E-BP1)( Reference Glass 21 , Reference Kandarian and Jackman 22 ).
Consequently, as atrophy in skeletal muscle seems to be a highly regulated process that may serve distinct functions under different pathological conditions( Reference Zhang, Chen and Fan 23 ), a better understanding of these signalling pathways during muscle atrophy is warranted. Furthermore, no data are available to elucidate the potential roles of these pathways in muscle atrophy in CKD. Therefore, the present study aimed to demonstrate that CKD was involved in the instigation of signalling pathways entailing the initiation and the development of muscle atrophy. Moreover, according to the above elaboration, we hereby hypothesised that KA supplementation enhanced muscle mass by up-regulating the Wnt7a/Akt/p70S6K pathway and suppressing the activation of the UPS and caspase-3-dependent apoptosis in CKD.
Experimental methods
Animals and experimental design
Male Sprague–Dawley rats (obtained from the Experimental Animal Center of Southern Medical University, China, certification no. SCXK (Yue) 2006-0015) weighing 180–220 g were housed in a room at a constant temperature with a 12 h light–12 h dark cycle, and were given free access to food and water. These rats were kept according to the guidelines of Care and Use of Laboratory Animals formulated by the Ministry of Science and Technology of China, and all experimental procedures concerned were approved by the ethics committee of Southern Medical University. Male rats were randomly assigned to either the 5/6 nephrectomy group or the sham-operated group. Each animal in the nephrectomy group underwent 5/6 nephrectomy by the ablation of two-thirds mass of the left kidneys and subsequent right unilateral nephrectomy after 1 week. In a sham-operated rat, a sham operation was performed. Then, at 1 week after the operation, the 5/6 nephrectomy group was randomly separated and maintained on three different diets: a normal-protein diet (22 % protein, NPD), a low-protein diet (6 % protein, LPD) or a LPD supplemented with KA (5 % protein and 1 % KA, LPD+KA). The sham group with the intake of the NPD acted as the control. Each group included ten rats. These diets were fed to the groups for a period of 24 weeks. At the end of the study, two NPD rats, one LPD rat and one LPD+KA rat died, but none of the rats died in the sham group.
Experimental diets
Rats were fed either a NPD, LPD or LPD+KA. KA was provided by Beijing Fresenius Kabi Pharmaceutical Company Limited. The KA composition was as follows (mg/630 mg): racemic keto isoleucine, 67 mg; ketones leucine, 101 mg; phenylalanine ketone, 68 mg; ketones valine, 86 mg; dl-methionine hydroxy, 59 mg; lysine acetate, 105 mg; threonine, 53 mg; tryptophan, 23 mg; histidine, 38 mg; tyrosine, 30 mg; total N, 36 mg. The three diets were formulated according to the American Institute of Nutrition for Rodent Diets, AIN-93, and all had the same content of energy (15·7 kJ/g (3·8 kcal/g)), vitamin and mineral mix. The details of the composition of the three diets are described in Table.1. The animals in all groups had free access to the diets and water was provided ad libitum. Between 09.00 and 10.00 hours daily, animals were weighed and food and water were renewed.
Table 1 Composition of the experimental diets (g/kg)
KA, ketoacids.
Blood and urine examination
The 24 h urine samples were collected using metabolism cages. Immediately before euthanasia, blood samples were drawn from the retro-orbital sinus for the analysis of renal function parameters. Serum creatinine, blood urea N and serum albumin were measured using a commercial kit (Roche Diagnostics), and 24 h urinary protein excretion was measured with another commercial kit (Tonein-TPII; Otsuka) according to the manufacturer's instructions.
Histochemistry: myofibre cross-sectional area measurements
After killing the rats, tibialis anterior (TA) muscle samples were fixed in paraformaldehyde and embedded in paraffin. The muscle samples were sectioned and stained with haematoxylin and eosin in line with standard procedures. Myofibre cross-sectional area was then determined as reported previously( Reference Baltgalvis, Berger and Pena 24 ). In each muscle, six sections of fifty contiguous myofibres were demarcated so that an average of 300 fibres were obtained for fibre area measurement. With the aid of an image morphometry program (Image J 1.32 j; NIH), the borders were delineated with a calibrated pen by circling each fibre. Each fibre was further traced with a handheld mouse to pixel of μm2 in area.
Protein synthesis and protein degradation
Protein synthesis was measured in vitro in the soleus muscle using the incorporation of [14C]phenylalanine as described previously( Reference Voltarelli and de Mello 25 ). [14C]Phenylalanine (0·05 μCi/ml) was obtained from the China Institute of Atomic Energy (Beijing, China). Protein synthesis was calculated by dividing the protein-bound radioactivity by the specific activity of free phenylalanine in the incubation medium, and is expressed as pmol phenylalanine incorporated/mg protein per 2 h.
Protein degradation was measured using tyrosine release from the isolated muscle as described previously by Fulks et al. ( Reference Rannels, Kao and Morgan 26 ). Tyrosine was purchased from Sigma-Aldrich. The strips of soleus muscle were pre-incubated for 30 min in Krebs Ringer buffer (NaCl 1·2 mmol/l, KCl 4·8 mmol/l, NaHCO3 25 mmol/l, CaCl2 2·5 mmol/l, KH2PO4 1·2 mmol/l and MgSO4 1·2 mmol/l; pH 7·4), supplemented with glucose (5·5 mmol/l), bovine serum albumin (1·0 g/l), insulin (5 U/ml) and cyclohexamide (5 mmol/l), saturated with a gas mixture of 95 % O2/5 % CO2. They were then transferred into a fresh medium of the same composition and incubated for 2 h. At the end of the incubation, samples of the incubation medium were used for the assay of tyrosine by the procedure of Waalkes & Udenfriend( Reference Waalkes and Udenfriend 27 ).
Measurements of proteasome activities
The chrymotrypsin- and trypsin-like activities of the 20S proteasome were measured in vitro in the gastrocnemius muscle as described previously( Reference Magne, Savary-Auzeloux and Migne 28 ). To measure the chymotrypsin-like and trypsin-like activities, 15 μg of proteins from the resuspended pellets diluted in 15 μl of buffer A were added to 60 μl of medium containing 50 mm-Tris–Cl (pH 7·5), 11·25 mm-MgCl2, 1·25 mm-dithiothreitol, 0·01 U apyrase and 300 μm-N-succinyl-Leu-Leu-Val-Tyr-7-amido-4-methylcoumarin (Sigma) or 800 μM-Boc-Leu-Arg-Arg-7-amido-4-methylcoumarin (Enzo Life Sciences). Both activities were determined by measuring the accumulation of the fluorogenic cleavage product (amido-4-methylcoumarin; AMC) using a luminescence spectrometer FLX800 (Biotek) for 45 min at an excitation wavelength of 380 nm and an emission wavelength of 440 nm. The time course for the accumulation of AMC after hydrolysis of the substrate was analysed by linear regression to calculate activities, i.e. the slopes of best fit of accumulation of AMC v. time.
Immunohistochemistry and immunofluorescent staining
Frozen tissue cross-sections were cut into a thickness of 10 μm in a cryostat at − 20°C. The sections were air-dried at room temperature and fixed with 10 % formalin solution. Background activity was minimised by blocking the section with 5 % goat serum. After rinsing, the sections were incubated with anti-ubiquitin goat polyclonal (1:50; Santa Cruz Biotechnology), anti-MAFbx goat polyclonal (1:50; Santa Cruz Biotechnology) or anti-MuRF1 goat polyclonal (1:50; Santa Cruz Biotechnology). The sections were then processed by using the Vectastain Elite ABC Peroxidase kit (PK6100; Vector Laboratories) with the ImmPACT DAB (3,3′-diaminobenzidine) peroxidase substrate (SK4105; Vector Laboratories), or exposed to chicken anti-goat IgG fluorescein isothiocyanate (1:100; Santa Cruz Biotechnology) or chicken anti-goat IgG-TR (1:100; Santa Cruz Biotechnology). Negative controls were performed by eliminating the primary or secondary antibody. Images were captured with a Nikon DXM 1200C camera using Nikon ACT-1C software.
For all stainings, at least two sections from each animal were analysed. Photographs of nine regions of interest (1·03 mm2 each) covering all fibres in the cross-section were analysed to ascertain ubiquitin staining. The images were initially converted as a ‘grey-scale’ image. The ubiquitin-positive area was quantified using Image J software (Image J 1.32 j; NIH) by limiting the measure to thresholds. The high and low thresholds were assigned by determining the average low and high thresholds for the staining procedure and manually recording the ideal threshold values to distinguish the ubiquitin-positive area. Data are expressed as a percentage of ubiquitin-positive area per region of interest. The mean fluorescence intensity of MAFbx and MuRF1 was also quantified using quantitative image analysis with a Photoshop software application as described previously( Reference Kirkeby and Thomsen 29 ).
Terminal dUTP nick end labelling analysis
DNA strand breaks were assessed by fluorescent labelling of terminal dUTP nick end labelling (TUNEL) using the one-step TUNEL apoptosis assay kit (Beyotime Institute of Biotechnology) as described( Reference Siu, Teng and Pei 5 ). Images were captured with a Nikon DXM 1200C camera using Nikon ACT-1C software. Within the delineated areas (measured and assisted with Stereo Investigator software), TUNEL-positive cells were counted, and then their densities were calculated.
Western blotting
Aliquots of gastrocnemius muscle tissue (40 mg) were snap-frozen and ground in a mortar, thawed and homogenised in lysis buffer (7 m-urea, 2 m-thiourea, 4 % (w/v) CHAPS, 20 mm-Tris, 65 mm-dithiothreitol and 0·2 % carrier ampholytes (Pharmalytes®, pH 3–10) supplemented with 8 μl of protease inhibitor cocktail (Calbiochem) and phosphatase inhibitor cocktail (Sigma-Aldrich), and then centrifuged at 15 000 g for 30 min at 4°C. Protein concentrations were determined by a Bio-Rad microtitre plate assay, which was a modification of the Bradford assay( Reference Bradford 30 ). Protein lysates were loaded onto 10 % SDS–polyacrylamide gel for separation, electrotransferred to polyvinylidene fluoride membranes and blocked in 5 % non-fat milk in Tris-buffered saline with Tween-20 (100 mm-NaCl, 50 mm-Tris and 0·1 % Tween-20, pH 7·5). The membranes were incubated with primary antibodies (anti-Wnt7a mouse monoclonal (1:200; Santa Cruz Biotechnology) and anti-MAFbx goat polyclonal (1:200; Santa Cruz Biotechnology), anti-MuRF1 goat polyclonal (1:200; Santa Cruz Biotechnology), anti-phospho-Akt (Ser473) rabbit monoclonal (1:1000; Cell Signaling Technology), anti-Akt (pan) rabbit monoclonal (1:1000; Cell Signaling Technology), anti-phospho-p70S6 kinase (Thr389) rabbit monoclonal (1:1000; Cell Signaling Technology), anti-p70 S6 kinase rabbit monoclonal (1:1000; Cell Signaling Technology), anti-Bax rabbit polyclonal (1:1000; Cell Signaling Technology), anti-Bcl-2 rabbit polyclonal (1:1000; Cell Signaling Technology), anti-caspase-3 rabbit monoclonal (1:1000; Cell Signaling Technology), anti-cleaved caspase-3 rabbit monoclonal (1:1000; Cell Signaling Technology), anti-actin rabbit, affinity isolated antibody (1:100; Sigma-Aldrich) or anti-glyceraldehyde 3-phosphate dehydrogenase rabbit monoclonal (1:1000; Cell Signaling Technology) overnight at 4°C, followed by the secondary antibody diluted at 1:10 000. Horseradish peroxidase-linked secondary antibodies included sheep anti-mouse IgG (GE Healthcare), donkey anti-rabbit IgG (GE Healthcare) and donkey anti-goat IgG (Santa Cruz Biotechnology). Chemiluminescence (Amersham Biosciences) detection was performed, and images were captured and documented with a CCD system (Image Station 2000MM; Kodak). The quantitative analysis of these images was performed using Molecular Imaging Software version 4.0 provided by the Kodak 2000MM System.
Statistical analysis
SPSS 13.0 (SPSS, Inc.) was used for statistical analysis. For data that were normally distributed, one-way ANOVA was implemented, followed by pairwise comparison by the least significant difference test. When the experimental groups were unequal and non-parametric, data were analysed by ANOVA on ranks and then by Dunn's method for pairwise comparison. Data are expressed as means and standard deviations. P< 0·05 was considered as statistically significant.
Results
Effects of ketoacid treatment on body weight and tibialis anterior muscle weight
The body and TA muscle weights of rats from the sham group were significantly heavier than those of the 5/6 nephrectomy groups. Among the rats in the 5/6 nephrectomy groups, body weight was found to be lightest in the LPD group, significantly increased in the LPD+KA group and heaviest in the NPD group. The wet and dry weights of TA muscle were found to be lightest in the LPD group with significant increases in the LPD+KA group, but no statistical differences were observed between the NPD and LPD+KA groups. The dry weight of TA muscle corrected for body weight significantly decreased in the LPD group with the LPD+KA group being the heaviest, and no statistical differences were observed between the NPD and LPD groups (Table 2). The cross-sectional area in the measurements of muscle fibre size was considered as the best indicator for muscle atrophy, thus avoiding potential confounding factors related to changes in extracellular space. The mean cross-sectional area of TA muscle in the LPD group was 20 % lower than that in the sham group (2926 (sd 168) v. 3663 (sd 155) μm2, P< 0·01). Fibre atrophy was attenuated in the LPD+KA group compared with the LPD group (3326 (sd 155) v. 2926 (sd 168) μm2, P< 0·05; Fig. 1(a) and (b)). No statistically significant differences were found in mean fibre cross-sectional area between the NPD and LPD+KA groups (Fig. 1(a) and (b)).
Table 2 Body weight and tibialis anterior muscle weight data (Mean values and standard deviations)
MDW/BW, muscle dry weight/body weight; Sham, normal-protein diet; NPD, normal-protein diet; LPD, low-protein diet; LPD+KA, low-protein diet supplemented with KA.
Mean value was significantly different from that of the sham group: * P< 0·05, ** P< 0·01.
Mean value was significantly different from that of the NPD group: †† P< 0·01.
Mean value was significantly different from that of the LPD group: ‡‡ P< 0·01.
§ For details of the diets, see the ‘Experimental methods’ section.
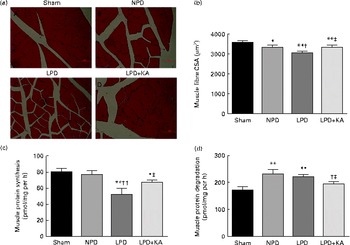
Fig. 1 Muscle fibre cross-sectional area (CSA), protein synthesis and protein degradation in the skeletal muscle of the experimental groups. (a) Cross-sections of tibialis anterior (TA) muscle stained with haematoxylin and eosin. Scale bar 50 μm. (b) Muscle fibre CSA (μm2) of TA muscles. (c) Protein synthesis was measured from the rate of incorporation of l-[U-14C]phenylalanine into isolated, incubated soleus muscles. (d) Protein degradation was measured as the rate of tyrosine released from isolated soleus muscles. Values are means, with standard deviations represented by vertical bars. Mean value was significantly different from that of the sham group: * P< 0·05, ** P< 0·01. Mean value was significantly different from that of the NPD group: † P< 0·05, †† P< 0·01. Mean value was significantly different from that of the LPD group: ‡ P< 0·05. Sham, normal-protein diet; NPD, normal-protein diet; LPD, low-protein diet; LPD+KA, low-protein diet supplemented with KA.
Effects of ketoacid treatment on proteinuria, serum albumin and renal function
Serum albumin was lower in the NPD and LPD groups than in the LPD+KA and sham groups. Blood urea N and urinary protein excretion, which were highest in the NPD group, were significantly reduced in the LPD group; the LPD+KA group had the lowest values. Meanwhile, 5/6 nephrectomy engendered increases in serum creatinine values with the LPD and LPD+KA groups being statistically different from that of the NPD group, but no statistical differences were observed between the LPD and LPD+KA groups. Urinary protein level was found to be highest in the NPD group, but significantly decreased in the LPD group and lowest in the LPD+KA group (Table 3). These results suggested that KA supplementation exerted more beneficial effects on preserving renal function than the LPD.
Table 3 Biochemical data from the experimental groups (Mean values and standard deviations)
Sham, normal-protein diet; NPD, normal-protein diet; LPD, low-protein diet; LPD+KA, low-protein diet supplemented with KA.
Mean value was significantly different from that of the sham group: * P< 0·05, ** P< 0·01.
Mean value was significantly different from that of the NPD group: † P< 0·05, †† P< 0·01.
Mean value was significantly different from that of the LPD group: ‡ P< 0·05, ‡‡ P< 0·01.
§ For details of the diets, see the ‘Experimental methods’ section.
Effects of ketoacid treatment on muscle protein synthesis and protein degradation
To analyse the consequences of KA supplementation on muscle protein metabolism, we evaluated the rates of protein synthesis and degradation in the isolated soleus muscle in vitro. The rate of protein synthesis was significantly lower in the LPD group than that in the sham group (45 (sd 10) v. 79 (sd 8) pmol/mg per h, P< 0·01), and KA supplementation increased the rate of protein synthesis in the LPD+KA group when compared with the LPD group (68 (sd 6) v. 45 (sd 10) pmol/mg per h, P< 0·01) (Fig. 1(c)). The rates of protein degradation were significantly higher in the NPD and LPD groups than in the sham group (P< 0·01), and KA supplementation decreased the rates of protein degradation in the LPD+KA group compared with the LPD group (225 (sd 15) v. 205 (sd 14) pmol/mg per h, P< 0·05) (Fig. 1(d)).
Effects of ketoacid treatment on the ubiquitin–proteasome system
The protein content of ubiquitin was examined by immunohistochemical analysis (Fig. 2(a)). Marked immune positive staining of ubiquitin was found to be localised in the cytoplasmic region of scattered muscle fibres in the muscle of the 5/6 nephrectomy groups, especially in the LPD group. The percentage of ubiquitin-positive areas calculated through semi-quantitative analysis was found to be significantly larger in the LPD group than in the other groups, whereas the value was curtailed with KA supplementation when compared with the LPD group (7·0 (sd 0·9) v. 4·3 (sd 1·1) %, P< 0·01; Fig. 2(b)). With respect to proteasome activities, both chymotrypsin- and trypsin-like activities were found to be stronger in the LPD group than in the sham group (78 (sd 4·4) v. 43 (sd 4·1) relative fluorescence units (RFU)/μg per min and 168 (sd 20·3) v. 63 (sd 7·9) RFU/μg per min, respectively; P< 0·01), whereas the activities were weakened with KA supplementation when compared with the LPD group (69 (sd 4·2) v. 78 (sd 4·4) RFU/μg per min and 90 (sd 8·9) v. 168 (sd 20·3) RFU/μg per min, respectively; P< 0·05) (Fig. 2(c) and (d)). Additionally, the expression of MAFbx and MuRF1 conducive to skeletal muscle atrophy was examined by immunofluorescent staining and Western blotting. The mean fluorescence intensity of MAFbx and MuRF1 remarkably increased in the LPD group than that in the sham group (P< 0·01), while the intensity was tamed with KA treatment when compared with the LPD group (P< 0·01) (Fig. 3(a)–(d)). The protein expression of MAFbx and MuRF1 assessed by Western blotting showed significant up-regulation in the LPD group but down-regulation with KA intervention (Fig. 3(e) and (f)), which is consistent with the results of immunofluorescence studies of MAFbx and MuRF1.
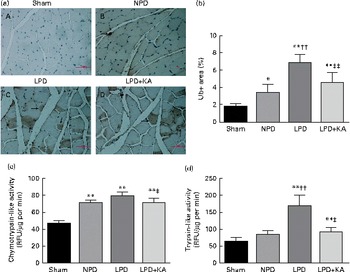
Fig. 2 Ubiquitin–proteasome pathway in the skeletal muscle of the experimental groups. (a) Immunohistochemical staining for ubiquitin in tibialis anterior muscle. Ubiquitin-positive areas are indicated by arrows. Scale bar 50 μm. (b) Ubiquitin (Ub)-positive areas were evaluated by determining the percentage of ubiquitin-positive areas per region of interest (nine regions of interest; 1·03 mm2 each region of interest). (c) Chymotrypsin-like activity of the 20S proteasome in gastrocnemius muscle was measured by using the fluorogenic substrate N-succinyl-Leu-Leu-Val-Tyr-7-amido-4-methylcoumarin. (d) Trypsin-like activity of the 20S proteasome was measured by using the Boc-Leu-Arg-Arg-7-amido-4-methylcoumarin. Values are means, with standard deviations represented by vertical bars. Mean value was significantly different from that of the sham group: * P< 0·05, ** P< 0·01. Mean value was significantly different from that of the NPD group: †† P< 0·01. Mean value was significantly different from that of the LPD group: ‡ P< 0·05, ‡‡ P< 0·01. Sham, normal-protein diet; NPD, normal-protein diet; LPD, low-protein diet; LPD+KA, low-protein diet supplemented with KA; RFU, relative fluorescence units.
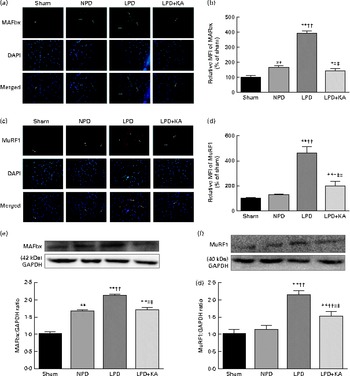
Fig. 3 Muscle atrophy F-box (MAFbx) and muscle ring finger-1 (MuRF1) in the skeletal muscle of the experimental groups. (a) Representative fluorescent images of MAFbx. MAFbx is stained in green and nuclei are labelled by 4′,6-diamidino-2-phenylindole (DAPI) staining in blue. MAFbx-positive areas are indicated by arrows. Scale bar 50 μm. (b) Relative mean fluorescence intensity (MFI) of MAFbx is expressed as the percentage of MFI relative to the sham group. (c) Representative fluorescent images of MuRF1.MuRF1 is stained in red and nuclei are labelled by DAPI staining in blue. MuRF1-positive areas are indicated by arrows. Scale bar 50 μm. (d) Relative MFI of MuRF1 is expressed as the percentage of MFI relative to the sham group. (e) Upper: representative immunoblotting of MAFbx and glyceraldehyde 3-phosphate dehydrogenase (GAPDH). Lower: the ratio of MAFbx:GAPDH normalised to the sham group. (f) Upper: representative immunoblotting of MuRF1 and GAPDH. Lower: the ratio of total MuRF1:GAPDH normalised to the sham group. Values are means, with standard deviations represented by vertical bars. Mean value was significantly different from that of the sham group: * P< 0·05, ** P< 0·01. Mean value was significantly different from that of the NPD group: † P< 0·05, †† P< 0·01. Mean value was significantly different from that of the LPD group: ‡ P< 0·05, ‡‡ P< 0·01. Sham, normal-protein diet; NPD, normal-protein diet; LPD, low-protein diet; LPD+KA, low-protein diet supplemented with KA.
Effects of ketoacid treatment on apoptotic signalling pathway
DNA fragments and the levels of cleaved caspase-3 and procaspase-3 in skeletal muscle were evaluated by TUNEL staining and immunoblotting. The TUNEL-positive nuclei of TA muscle were found to be significantly increased in the LPD group (7·9 (sd 1·8) %) when compared with the sham and NPD groups (4·2 (sd 1·6) v. 5·1 (sd 1·1) %, respectively; P< 0·01), but distinctly decreased in the LPD+KA group when compared with the LPD group (5·7 (sd 1·0) v. 7·9 (sd 1·8) %; P< 0·01) (Fig. 4(a) and (b)). The semi-quantification of cleaved caspase-3 also showed a similar result with TUNEL staining (Fig. 4(d)). In contrast, the semi-quantification of procaspase-3 showed a significant reduction in the LPD group when compared with the sham (P< 0·01) and NPD (P< 0·05) groups, but showed remarkable improvement with KA treatment when compared with the LPD group (P< 0·01) (Fig. 4(e)). In addition, to discern whether the activation of caspase-3 would lead to the degradation of actomyosin, immunoblotting was conducted to assess 14 kDa actin fragment proteins (Fig. 5(a)). The LPD group had substantially higher levels of 14 kDa actin fragment than the sham group (P< 0·01), while KA supplementation reduced the high levels of 14 kDa actin fragment when compared with the LPD group (P< 0·01) (Fig. 5(b)). Furthermore, to determine whether Bcl-2 family proteins would regulate the caspase-3-dependent apoptotic pathway, additional immunoblotting was performed to examine the protein expression of Bax and Bcl-2 (Fig. 5(a)). The findings demonstrated an up-regulated level of Bax but a down-regulated level of Bcl-2 in the LPD group when compared with the sham group (P< 0·01), while an up-regulated level of Bcl-2 but a down-regulated level of Bax were observed with KA treatment when compared with the LPD group (P< 0·01) (Fig. 5(c) and (d)). Therefore, as shown in Fig. 5(e), the ratio of Bax:Bcl-2 increased in the LPD+KA group in comparison with the LPD group (P< 0·01).
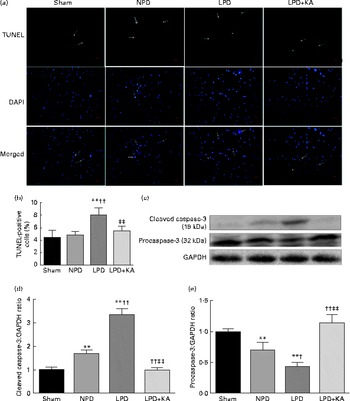
Fig. 4 Terminal dUTP nick end labelling (TUNEL) staining and caspase-3 in the skeletal muscle of the experimental groups. (a) Representative microphotographs of TUNEL staining in tibialis anterior muscle. TUNEL labelling is stained in red and nuclei are labelled by 4′,6-diamidino-2-phenylindole (DAPI) staining in blue. TUNEL-positive nuclei are indicated by arrows. Scale bar 50 μm. (b) The number of TUNEL-positive cells is expressed as the percentage of total cells. (c) Representative immunoblotting of cleaved caspase-3, procaspase-3 and glyceraldehyde 3-phosphate dehydrogenase (GAPDH). (d) The ratio of cleaved caspase-3:GAPDH normalised to the sham group. (e) The ratio of procaspase-3:GAPDH normalised to the sham group. Values are means, with standard deviations represented by vertical bars. Mean value was significantly different from that of the sham group: ** P< 0·01. Mean value was significantly different from that of the NPD group: † P< 0·05, †† P< 0·01. Mean value was significantly different from that of the LPD group: ‡ P< 0·05, ‡‡ P< 0·01. Sham, normal-protein diet; NPD, normal-protein diet; LPD, low-protein diet; LPD+KA, low-protein diet supplemented with KA.
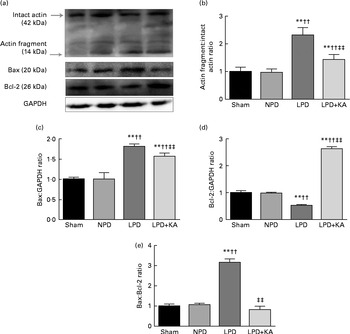
Fig. 5 14 kDa actin fragment, Bax and Bcl-2 in the skeletal muscle of the experimental groups. (a) Representative immunoblotting of 14 kDa actin fragment, Bax, Bcl-2 and glyceraldehyde 3-phosphate dehydrogenase (GAPDH). (b) The ratio of 14 kDa actin fragment:42 kDa intact actin normalised to the sham group. (c) The ratio of Bax:GAPDH normalised to the sham group. (d) The ratio of Bcl-2:GAPDH normalised to the sham group. (e) The ratio of Bax:Bcl-2 normalised to the sham group. Values are means, with standard deviations represented by vertical bars. Mean value was significantly different from that of the sham group: ** P< 0·01. Mean value was significantly different from that of the NPD group: †† P< 0·01. Mean value was significantly different from that of the LPD group: ‡‡ P< 0·01. Sham, normal-protein diet; NPD, normal-protein diet; LPD, low-protein diet; LPD+KA, low-protein diet supplemented with KA.
Effects of ketoacid treatment on the Wnt7a/Akt/p70S6K signalling pathway
Evidence indicates that Wnt7a directly activates the Akt/p70S6K pathway to induce myofibre hypertrophy. We examined the protein levels of Wnt7a, phosphorylated (p)-Akt, total (T)-Akt, p-p70S6K and T-p70S6K by immunoblotting (Fig. 6(a)). The data indicated a lower level of the Wnt7a protein in the LPD group than in the sham and NPD groups (P< 0·01), whereas KA treatment increased the level of the Wnt7a protein when compared with LPD group (P< 0·01) (Fig. 6(b)). Meanwhile, a downward trend in Akt and p70S6K phosphorylation in the LPD group was also observed compared with the sham and NPD groups (P< 0·01), but KA supplementation prompted an increase when compared with the LPD group (P< 0·01) (Fig. 6(c) and (e)). No statistical differences in the protein levels of T-Akt and T-p70S6K were evident in the skeletal muscle of the sham, NPD, LPD and LPD+KA groups (Fig. 6(d) and (f)).
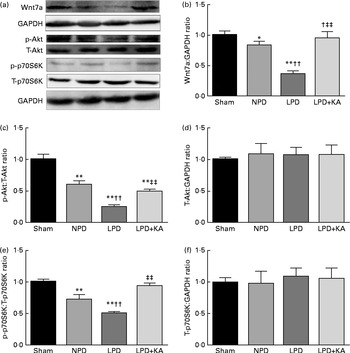
Fig. 6 Wnt7a/Akt/p70S6K signalling pathway in the skeletal muscle of the experimental groups. (a) Representative immunoblotting of Wnt7a, phosphorylated (p)-Akt, total (T)-Akt, p-p70S6K, T-p70S6K and glyceraldehyde 3-phosphate dehydrogenase (GAPDH). (b) The ratio of Wnt7a:GAPDH normalised to the sham group. (c) The ratio of p-Akt:T-Akt normalised to the sham group. (d) The ratio of T-Akt:GAPDH normalised to the sham group. (e) The ratio of p-p70S6K:T-p70S6K normalised to the sham group. (f) The ratio of T-p70S6K:GAPDH normalised to the sham group. Values are means, with standard deviations represented by vertical bars. Mean value was significantly different from that of the sham group: * P< 0·05, ** P< 0·01. Mean value was significantly different from that of the NPD group: †† P< 0·01. Mean value was significantly different from that of the LPD group: ‡‡ P< 0·01. Sham, normal-protein diet; NPD, normal-protein diet; LPD, low-protein diet; LPD+KA, low-protein diet supplemented with KA.
Discussion
In the present study, we demonstrated that activation of the UPS and caspase-3-dependent apoptosis contributed to the increase of protein degradation in the muscle of rats with chronic kidney disease on a low-protein diet (CKD-LPD). Meanwhile, we confirmed that down-regulation of the Wnt7a/Akt/p70S6K pathway is responsible for the suppression of protein synthesis in the muscle of CKD-LPD rats.
It has been reported that a decline in protein storage and serum albumin coupled with weight loss and decreased muscle mass can increase morbidity and mortality in CKD patients( Reference Avram and Mittman 31 , Reference Kopple 32 ). The present study confirms that a LPD may induce a marked reduction in body weight, muscle mass and serum albumin in CKD, while KA supplementation can preserve renal function and improve body weight and muscle mass, which is consistent with a previous observation( Reference Li, Long and Shao 33 ). Moreover, presumably resulting from the activation of protein degradation and/or the suppression of protein synthesis in skeletal muscle, muscle atrophy is ascertained in the present study due to the synergic effect of the two factors in CKD-LPD, which is in agreement with the report by Wang et al. ( Reference Wang, Du and Klein 34 ) on muscle atrophy in CKD. In addition, KA supplementation was proved to be able to stimulate protein synthesis and inhibit protein breakdown in the muscle of CKD-LPD rats.
The UPS is the major non-lysosomal proteolytic pathway for intracellular protein degradation in skeletal muscle in CKD and most other catabolic disorders( Reference Bailey, Wang and England 35 , Reference Pickering, Price and Bircher 36 ). A uniform finding about muscle atrophy is an increase in the mRNA level of ubiquitin and subunits of the proteasome in muscle( Reference Bailey, Wang and England 35 , Reference Pickering, Price and Bircher 36 ). The 20S proteasome is up-regulated in chymotrypsin- and trypsin-like activities that cut Ub-conjugated proteins into small peptides, leading to the degradation of myofibrillar proteins in catabolic conditions( Reference Merforth, Osmers and Dahlmann 37 , Reference Hobler, Williams and Fischer 38 ), whereas inhibition of the activities of the proteasome blocks the loss of muscle proteins( Reference Tawa, Odessey and Goldberg 39 ). In addition, recent reports have indicated that two of the E3 enzymes (MAFbx and MuRF1) are essential components in the UPS, and have been demonstrated with higher expression in starvation, CKD, acute insulin deficiency or cancer( Reference Lecker, Jagoe and Gilbert 40 , Reference Lee, Dai and Hu 41 ). The immunocytochemical and biochemical data derived from the present study illustrate that ubiquitin and MAFbx and MuRF1 protein expression and proteasome activity are elevated in the muscle of CKD-LPD rats. Furthermore, KA supplementation has been demonstrated to incur decreases in ubiquitin and MAFbx and MuRF1 protein expression and proteasome activity in the muscle of CKD-LPD rats. The present findings are consistent with previous suggestions that increased expression of MAFbx and MuRF1 were correlated with higher rates of protein degradation in CKD( Reference Xu, Li and Workeneh 42 ), and leucine supplementation induced a decrease in chymotrypsin- and trypsin-like activities after immobilisation during ageing( Reference Magne, Savary-Auzeloux and Migne 28 ). In addition, muscle proteolysis in animal models of muscle wasting is blocked by inhibitors of the UPS( Reference Pickering, Price and Bircher 36 , Reference Tiao, Hobler and Wang 43 , Reference Williams, Sun and Fischer 44 ). Therefore, this strengthens the case that increases in ubiquitin and MAFbx and MuRF1 protein expression and proteasome activity are linked to the proposed role of the UPS associated with muscle atrophy in CKD. Collectively, the present results indicate that KA supplementation plays a muscle-protective role in CKD-LPD, at least in part, via inhibition of the UPS.
Meanwhile, apoptosis proves another conduit for muscle atrophy. As the abnormalities of muscle cell signalling are closely associated with increased muscle protein catabolism, enhanced muscle cell apoptosis is revealed due to the activation of caspase-3. Caspase-3 activation in muscle is important because the UPS does not readily degrade actomyosin, but the loss of actomyosin characterises muscle wasting that occurs in catabolic conditions( Reference Mitch and Goldberg 45 , Reference Solomon and Goldberg 46 ). This cleavage process of caspase-3 can be identified by the accumulation of the 14 kDa actin band in muscles, a response that occurs in rats with chronic uraemia or insulin deficiency( Reference Du, Wang and Miereles 13 ). In the present study, we found increased cleaved caspase-3 in the muscle of CKD-LPD rats, correlating with the up-regulation of 14 kDa actin fragment and enhanced apoptosis of skeletal muscle cells. This corresponds to previous reports that the cleavage of caspase-3 acts to degrade muscle proteins in rodent models of uraemia, diabetes and angiotensin II-induced hypertension( Reference Wang and Mitch 47 ), and resonates with the findings of Boivin et al. ( Reference Boivin, Battah and Dominic 48 ) that increased caspase-3 activity during haemodialysis was associated with increased muscle protein catabolism and enhanced apoptosis of skeletal muscle cells. The accumulation of 14 kDa actin fragment has also been found to be significantly increased in diverse catabolic states in skeletal muscles or in the muscles of patients with dissipating muscle mass from a serious burn injury or in the muscles of haemodialysis patients( Reference Du, Wang and Miereles 13 , Reference Wang, Hu and Hu 49 ). Meanwhile, the activation of caspase-3 and the subsequent accumulation of 14 kDa actin fragment were associated with an increase in activated Bax, a pro-apoptotic factor in skeletal muscle( Reference Lee, Dai and Hu 41 ); thus we directly assessed the protein expression of Bax and Bcl-2. The present results demonstrate that the increase in Bax protein and the decrease in Bcl-2 protein induce apoptosis by increasing the ratio of Bax:Bcl-2 in the muscle of CKD-LPD rats. These findings are consistent with the view that disorder of the Bcl-2 signalling pathway results in caspase-3 activation and apoptosis in skeletal muscle( Reference Lee, Dai and Hu 41 ). Furthermore, we have demonstrated that KA supplementation ameliorated TUNEL-positive DNA fragment, and suppressed the activity of caspase-3, which resulted in decreased 14 kDa actin fragment by down-modulating the Bax:Bcl-2 ratio in the muscle of CKD-LPD rats. Overall, these results are in strong agreement with the notion that activated Bax promotes the release of cytochrome c from the mitochondria, resulting in the activation of caspase-3 and an increase in the 14-kDa actin fragment in the muscle of CKD-LPD rats, and KA supplementation prevents the activation of caspase-3-dependent apoptosis in the muscle of CKD-LPD rats.
Another signalling pathway that controls muscle growth has been identified that involves Wnt7a, an extracellular protein that acts both on satellite stem cells by increasing their numbers and on myofibres by activating the AKT/p70S6K pathway via its receptor Fzd7( Reference von Maltzahn, Bentzinger and Rudnicki 18 , Reference Le Grand, Jones and Seale 19 ). The present study reveals that CKD-LPD causes a reduction in Wnt7a protein that results in decreased p-Akt and p70S6K (p-p70S6K). On the one hand, low p-Akt has been reported to cause decreased phosphorylation of FoxO that can enter the nucleus to stimulate the expression of atrogin-1/MAFbx and MuRF1( Reference Sishi and Engelbrecht 50 ), and activated Akt has been proved to be a major stimulator of growth-related processes via phosphorylation of the downstream kinases mTOR (mammalian target of rapamycin) and p70S6K, thereby stimulating protein synthesis( Reference Wullschleger, Loewith and Hall 51 ). On the other hand, a low p-p70S6K can directly reduce protein synthesis and increase protein breakdown in muscles( Reference Wang, Hu and Hu 49 ). This therefore corresponds to the report by von Maltzahn et al. ( Reference von Maltzahn, Renaud and Parise 52 ) that Wnt7a treatment ameliorates muscular dystrophy in dystrophic muscles of mdx mice. Furthermore, KA treatment reverses decreases in the Wnt7a/Akt/p70S6K anabolic growth pathway in the muscle of CKD-LPD rats, giving rise to elevated levels of Wnt7a and enhanced levels of Akt and p70S6K phosphorylation compared with the LPD. These results strongly suggest that the Wnt7a/Akt/p70S6K pathway plays a role in the underlying mechanisms of muscle atrophy in CKD-LPD, and this pathway may be mediating the anti-atrophy effects of KA.
Conclusion
In summary, the present study provides a novel molecular explanation of KA in improving muscle atrophy in CKD-LPD. The results obtained lend strong support to the view that KA supplementation enhances muscle mass by preventing the activation of the UPS and caspase-3-dependent apoptosis and up-regulating the Wnt7a/Akt/p70S6K signalling pathway in the muscle of CKD-LPD rats. The present findings about the beneficial effects of KA illuminate that KA might be a better therapeutic strategy for muscle atrophy in CKD-LPD. More studies are still needed to determine the precise mechanism in which KA improves muscle atrophy in CKD.
Acknowledgements
The present study was supported by the National Science Foundation of China (no. 81173457). The National Science Foundation of China had no role in the design, analysis or writing of this article.
The authors' contributions are as follows: D.-T. W. participated in the experimental design and writing of the manuscript; L. L., Y. S. and Z.-B. G. participated in the experimental design; D.-T. W. was responsible for the Western blotting study, protein synthesis and protein degradation study, proteasome activities and TUNEL analysis; Y. Y. was responsible for the histopathological and immunocytochemical study; M. W. conducted the statistical analysis; L.-B. W. proposed the original design of the experiments, supervised experimental work and revised the manuscript.
The authors declare that there is no conflict of interest.


