


Obesity is a critical public health issue that affects 40 % of American adults, translating to 93 million individuals(Reference Hales, Fryar and Carroll1). Excess body weight increases the risk for type 2 diabetes, the metabolic syndrome, inflammation and many cancers(Reference Hursting and Hursting2) and costs the US healthcare system an estimated $48–66 billion per year(Reference Wang, McPherson and Marsh3). In 2015–2016, over 20 % of adolescents aged 12–19 years met the criteria for obesity(Reference Ogden, Carroll and Lawman4), or BMI at or above the 95th percentile (based on 2000 data) matched for age and sex(Reference Robinson5). Research indicates a link between adolescent and adulthood obesity; adolescents with obesity at age 15 years are over five times as likely to have adulthood obesity (BMI ≥ 30 kg/m2) by 35 years of age compared with their normal-weight counterparts(Reference Guo, Wu and Chumlea6). Thus, identifying risk factors for excess weight before adulthood may be critical for early treatment.
Recent studies have indicated ‘social jetlag’ as a risk factor for obesity in both adults(Reference Islam, Akter and Kochi7–Reference Zerón-Rugerio, Cambras and Izquierdo-Pulido11) and adolescents(Reference Malone, Zemel and Compher12). Social jetlag is the misalignment of sleep timing across the week(Reference Wittmann, Dinich and Merrow13). During the work or school week, individuals with later preferred timing of daily activities (e.g. sleep), or later chronotype, have later bedtimes but relatively early wake times due to work, school or other obligations(Reference Roenneberg, Wirz-Justice and Merrow14). Late bedtimes and early wake times during the work or school week result in short sleep duration, and individuals may attempt to compensate by delaying wake time and obtaining more sleep on the weekend(Reference Roenneberg, Wirz-Justice and Merrow14). Later chronotypes therefore tend to have a sleep interval with a later midpoint on the weekend compared with the work or school week(Reference Wittmann, Dinich and Merrow13). This difference in sleep–wake timing between the work or school week and the weekend is known as ‘social jetlag’(Reference Wittmann, Dinich and Merrow13).
Due to the combination of both a shift towards later chronotype during adolescence(Reference Roenneberg, Kuehnle and Pramstaller15) and early school start times(Reference Wheaton, Ferro and Croft16), adolescents experience short sleep during the school week and more social jetlag compared with adults(Reference Wittmann, Dinich and Merrow13). In addition to short sleep duration(Reference Ames, Holfeld and Leadbeater17–Reference Ruan, Xun and Cai19), some studies indicate that social jetlag is associated with higher BMI(Reference Islam, Akter and Kochi7–Reference Zerón-Rugerio, Cambras and Izquierdo-Pulido11) and larger waist circumference(Reference Islam, Akter and Kochi7,Reference Wong, Hasler and Kamarck10) among adults, though other studies indicate a null association(Reference Johnsen, Wynn and Bratlid20–Reference Zhang, Cajochen and Khatami23). One study that examined the relationship between social jetlag and BMI among adolescents found a positive association(Reference Malone, Zemel and Compher12), with another demonstrating an association between social jetlag and increased odds of obesity only among females(Reference Cespedes Feliciano, Rifas-Shiman and Quante24). However, one study found a negative association between social jetlag and BMI among adolescents(Reference de Zwart, Beulens and Elders25), indicating a need for more research in this population. The high prevalence of social jetlag in adolescence(Reference Wittmann, Dinich and Merrow13) and the evidence for a link with obesity among both adolescents(Reference Malone, Zemel and Compher12,Reference Cespedes Feliciano, Rifas-Shiman and Quante24) and adults(Reference Islam, Akter and Kochi7–Reference Wong, Hasler and Kamarck10) indicate that millions of adolescents may be at risk for excess body weight accompanying social jetlag.
Unhealthy eating behaviours are additional risk factors for obesity that are associated with social jetlag. For example, previous research in adults indicates an association between greater social jetlag and skipping breakfast(Reference Islam, Akter and Kochi7,Reference Teixeira, Mota and Crispim26) and higher consumption of sweets and saturated fat(Reference Mota, Silva and Balieiro27), which are risk factors for obesity(Reference Horikawa, Kodama and Yachi28–Reference Nour, Lutze and Grech35). However, there is a lack of research on the association between social jetlag and different aspects of unhealthy eating in the adolescent population specifically.
Racial/ethnic differences in social jetlag, eating behaviours and BMI have been observed. For example, Black(Reference Bellatorre, Choi and Lewin36) and Hispanic/Latino(Reference Combs, Goodwin and Quan37) adolescents exhibit less school night sleep duration compared with White adolescents. Shorter sleep during the school week increases the likelihood of social jetlag(Reference Wittmann, Dinich and Merrow13), suggesting racial and ethnic minorities may have more social jetlag compared with their White peers. Blacks and Hispanics/Latinos also exhibit eating behaviours associated with higher BMI. Compared with Whites, Black adolescents skip breakfast more frequently and consume more sweetened drinks(Reference Ford, Gordon and Howell38) and fewer fruits and vegetables(Reference Goff, Huang and Silva39). Hispanics skip breakfast more frequently(Reference Ford, Gordon and Howell38) and consume more fast food(Reference Arcan, Larson and Bauer40) and fewer vegetables(Reference Surjadi, Takeuchi and Umoren41) than Whites. Similarly, more Black and Hispanic/Latino adolescents meet the criteria for excess weight (≥85th percentile) compared with Whites(Reference Moss, Liu and Zhu42). The differences in social jetlag, eating behaviours and BMI among Whites, Blacks and Hispanics/Latinos indicate that ethnicity may confound the relationships of social jetlag with eating behaviours and BMI. To our knowledge, two studies have examined the relationship between social jetlag and BMI in adolescents while adjusting for ethnicity, finding a positive relationship remained in all adolescents(Reference Malone, Zemel and Compher12) or in female adolescents only(Reference Cespedes Feliciano, Rifas-Shiman and Quante24); however, these studies did not examine ethnoracial differences in eating behaviours.
The present study investigated the relationships of social jetlag with eating behaviours and BMI among adolescents. We hypothesised that greater social jetlag would be associated with unhealthier eating behaviours and higher BMI percentile, even after adjustment for potential confounders.
Experimental methods
Participants and procedures
Data for the present analyses come from the Fragile Families and Child Wellbeing Study (www.fragilefamilies.princeton.edu). The original birth cohort consists of 4898 children born 1998–2000 in twenty US cities(Reference Wagmiller43). To date, data have been collected in six waves; the present study examines cross-sectional survey responses of 3444 youth at age 15 years and their primary caregivers. Youth missing demographic, sleep, eating behaviour or weight/height information were excluded from the present study, yielding an analytical sample of 3060 youth (88·9 % of in-wave total and 62·5 % of initial birth cohort). Families were compensated $100 USD for completion of the primary caregiver questionnaire and $50 USD for completion of the youth questionnaire, administered either through phone or in person. This study was conducted according to the guidelines laid down in the Declaration of Helsinki, and all procedures involving human participants were approved by the Stony Brook University Institutional Review Board (CORIHS B) (FWA no. 00000125). Written (for in-home interviews) or verbal (for phone interviews) informed consent was obtained from all participants. Verbal consent was witnessed and formally recorded.
Materials
Data were drawn from two sources at the age 15 wave: a questionnaire administered to youth, and a separate questionnaire administered to their primary caregiver (each administered once).
Youth age 15 questionnaire
Teens were asked to report sleep variables, race/ethnicity, height and weight.
Sleep and social jetlag measures
Youths were asked to report bedtimes and wake times during the school week (Sunday–Thursday nights and Monday–Friday mornings, respectively) and bedtimes and wake times during the weekend (Friday–Saturday nights and Saturday–Sunday mornings, respectively).
The following variables were calculated using bedtime and wake time measures collected from the Youth Age 15 Questionnaire. Sleep duration on school nights was calculated as the interval between reported bedtime and wake time on school nights in hours. Sleep duration on weekend nights was calculated as the interval between reported bedtime and wake time on weekend nights in hours. Social jetlag (in hours) was calculated through the following formula: |sleep midpoint on weekend nights – sleep midpoint on school nights|(Reference Wittmann, Dinich and Merrow13).
Eating behaviours
Breakfast consumption was assessed with the question, ‘How many days in a typical school week do you eat breakfast? Do not count the weekend’ and ranged from 0 to 5. Literature indicates that eating breakfast 71 % of the time during the week is associated with reduced risk of overweight in adolescents(Reference So, Nelson and Li44). The present study surveyed breakfast consumption during the 5-d school week rather than all 7 d; we therefore dichotomised breakfast consumption to model the odds of consuming breakfast ≥4 d (71 % of 5 is 3·55, which rounds to 4 d or at least 80 % of the school week) during the school week v. <4 d.
Vegetable and fruit consumption was assessed with the question, ‘In a typical week, how many days do you eat at least some green vegetables or fruit?’ and ranged from 0 to 7. Based on the recommendations for fruit and vegetable consumption from the United States Department of Agriculture(Reference McGuire45), fruit and vegetable consumption was dichotomised to model the odds of consumption all 7 d of the week (v. <7 d).
Fast food consumption was assessed with the question, ‘How many days in a typical week do you eat food from a fast food restaurant, such as McDonald’s, Burger King, Wendy’s, Arby’s, Pizza Hut, Taco Bell, or Kentucky Fried Chicken or a local fast food restaurant?’ and ranged from 0 to 7. As most participants had consumed fast food at least 1 d of the week (85 %), fast food consumption was dichotomised to model the odds of consumption ≥2 d during the week (v. <2 d).
Sweetened drink consumption was assessed with the question, ‘In a typical day, how many regular, non-diet sweetened drinks do you have? Include regular soda, juice drinks, sweetened tea or coffee, energy drinks, flavored water, or other sweetened drinks.’ Based on literature indicating that ≥2 sweetened drinks/d was associated with weight gain(Reference Viner and Cole46), sweetened drink consumption was dichotomised to model the odds of consuming ≥2 sweetened drinks daily (v. <2).
BMI percentile
BMI at age 15 years was assessed using self-reported height and weight and calculated through the following formula: weight in kg/(height in m)2(Reference Keys, Fidanza and Karvonen47). BMI percentile (range 0–100) was calculated based on the 2000 Centers for Disease Control and Prevention growth charts(Reference Kuczmarski, Ogden and Guo48), which matches BMI for the adolescent’s sex and age.
Covariate measures from youth questionnaire
Race and ethnicity consisted of four exclusive categories: ‘White/Caucasian’ (non-Hispanic or Latino; reference group), ‘Black/African American’ (non-Hispanic or Latino), ‘Hispanic and/or Latino’ (any race) or ‘Other, Mixed, or none’ (non-Hispanic or Latino).
Sex and age (calculated in exact years) were assessed from administrative records collected at the youth’s time of birth.
Primary caregiver questionnaire
Covariate measures from primary caregiver questionnaire
Covariates for statistical analyses (youth living arrangements and household income) were additionally drawn from a questionnaire administered once to primary caregivers.
Statistical analyses
Analyses were conducted in SAS 9.4 (SAS Institute Inc.). Cases were excluded from all analyses if missing any of the following: bedtime or wake time on either school or weekend nights (n 63), any eating behaviour (n 57), BMI percentile (n 224) and/or covariate questions (n 38) out of 3444. Two adolescents were excluded due to implausible midpoints of sleep (≥12.00 hours) on the weekend (no school nights met this same criterion), yielding 384 excluded adolescents from the age 15 wave and a total analytic sample of 3060. The outcome of BMI percentile met pre-defined criteria for normality (skewness < |3| and kurtosis < |10|).
Pairwise associations between dichotomised eating behaviours were assessed with χ 2 analyses (PROC FREQ). We conducted a bivariate Pearson’s correlation analysis (PROC CORR) to test the association between school night school duration and social jetlag. Univariate one-way ANOVA (PROC ANOVA) or binomial logistic regression analyses (PROC LOGISTIC) were conducted to determine differences in school night and weekend sleep duration, social jetlag, BMI percentile (ANOVA) and eating behaviours (logistic regression) among White, Black and Hispanic/Latino adolescents (Other, Mixed or none were excluded from these analyses due to heterogeneous nature of sample). Significant ANOVA results were followed by post hoc pairwise comparisons corrected using Tukey’s Honestly Significant Difference. Separately, social jetlag predicted each outcome of interest (one of four eating behaviours or BMI percentile) in regression analyses. Binomial logistic regression analyses were conducted to model the odds of each eating behaviour outcome, and linear regression analysis was conducted with the BMI percentile outcome (PROC REG). For each outcome, model 1 included only social jetlag as the predictor. Model 2 added demographic and household covariates selected a priori (age in years, sex, youth living arrangements and household income) except for ethnicity. Model 3 added school night sleep duration. For BMI percentile only, model 3e added the four dichotomised eating behaviours. Model 4 added ethnicity (White as reference group; other categories dummy-coded) to the analysis. We examined whether social jetlag interacted with ethnicity on eating behaviours and BMI in model 4; if the interaction between social jetlag and ethnicity was not significant, the interaction term was dropped from model 4. The variance inflation factor did not exceed 2·5 for any predictor in the regression model, indicating no multicollinearity (i.e. no predictor was strongly correlated with another predictor)(Reference Menard49). An α level <0·05 (two-tailed) was accepted as significant.
Results
See Table 1 for demographic information and descriptive statistics for the analytical sample (n 3060). The sample was 46·2 % Black/African American, 24·1 % Hispanic/Latino, 17·5 % White/Caucasian and 12·3 % Other, Mixed or no ethnicity. Mean social jetlag was 2·75 (1·29) h. Mean BMI was 24·02 (5·73) kg/m2, and BMI percentile was 68·0 % (27·9 %). Consumption of breakfast ≥4 d per school week was 52·2 %; consumption of green fruits/vegetables 7 d of the week was 30·4 %; consumption of fast food ≥2 d per week was 48·6 %, and consumption of ≥2 sweetened drinks daily was 61·9 %. Pairwise associations between eating behaviours (according to χ 2 analyses) are presented in online Supplementary Table S1 showing each eating behaviour was significantly associated with the other, but with small or small-to-medium effect sizes(Reference Kim50) (φ ranging from 0·05 to 0·22). Social jetlag and school night sleep duration were negatively correlated with a small effect size (r −0·10, P < 0·001).
Table 1. Descriptive statistics from analytical sample (n 3060) of age 15 wave of the Fragile Families and Child Wellbeing Study
(Numbers and percentages; mean values and standard deviations)

* Data collected at birth.
† Other category includes Asian, Central American/Caribbean, Native American/Alaska Native and/or Native Hawaiian/Pacific Islander.
‡ Calculated based on 2000 Centers for Disease Control and Prevention growth charts, matched for age and sex(Reference Kuczmarski, Ogden and Guo48).
§ | Midpoint of sleep on weekend nights − midpoint of sleep on school nights |(Reference Wittmann, Dinich and Merrow13).
Between-ethnicity comparisons of social jetlag, sleep duration, eating behaviours and BMI percentile
See Table 2 for analyses of differences in social jetlag, sleep duration, eating behaviours and BMI percentile among race/ethnicity groups. Omnibus ANOVA indicated significant differences among White, Black and Hispanic/Latino adolescents in social jetlag (P < 0·001), school night sleep duration (P < 0·001) and BMI percentile (P < 0·001). Pairwise comparisons indicated Whites and Hispanic/Latinos reported significantly less social jetlag (P < 0·001) and longer school night sleep duration (P < 0·001) compared with Blacks. Both Hispanic/Latino (P < 0·001) and Black (P < 0·001) adolescents had higher BMI percentile compared with Whites. There were no differences in weekend night sleep duration by race/ethnicity (P = 0·057).
Table 2. Differences among race/ethnicity groups in sleep duration, social jetlag, eating behaviours and BMI percentile (n 2686)
(Mean values, standard deviations, significance tests and effect sizes)
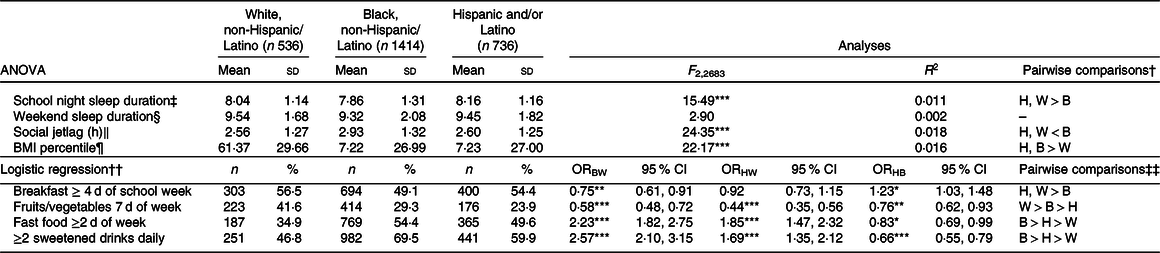
H, Hispanic; W, White; B, Black; BW, Black v. White; HW, Hispanic v. White; HB, Hispanic v. Black.
*P < 0·05, **P < 0·01, ***P < 0·001.
† Corrected for multiple comparisons with Tukey’s honestly significant difference.
‡ Sunday to Thursday night.
§ Friday and Saturday night.
‖ Calculated as | midpoint of sleep on weekend nights − midpoint of sleep on school nights |(Reference Wittmann, Dinich and Merrow13).
¶ Calculated based on 2000 Centers for Disease Control and Prevention growth charts, matched for age and sex(Reference Kuczmarski, Ogden and Guo48).
†† White = reference group.
‡‡ Hispanic/Latino v. Black comparison obtained by changing reference group to Black.
Analyses of eating behaviours indicated 25 % lower odds of consuming breakfast ≥4 d per school week in Blacks compared with Whites and 23 % lower odds compared with Hispanics/Latinos with no differences between Whites and Hispanics/Latinos. Blacks reported 42 % lower odds of consuming fruits or vegetables 7 d/week than did Whites and 24 % higher odds than did Hispanics/Latinos, and Hispanics/Latinos had 56 % lower odds compared with Whites. Blacks reported 123 % higher odds of consuming fast food ≥2 d/week compared with Whites and 17 % higher odds compared with Hispanics/Latinos, and Hispanics/Latinos reported 85 % higher odds compared with Whites. Blacks reported 157 % higher odds of consuming ≥2 sweetened drinks daily compared with Whites and 34 % higher odds compared with Hispanics/Latinos, and Hispanics/Latinos reported 69 % higher odds compared with Whites.
Associations of social jetlag with eating behaviours
Models (1–4) were conducted separately for each eating behaviour (see Fig. 1 and Table 3). Social jetlag did not interact with ethnicity on any eating behaviour; therefore, no interaction term was included in these analyses, but ethnicity was included as a covariate.
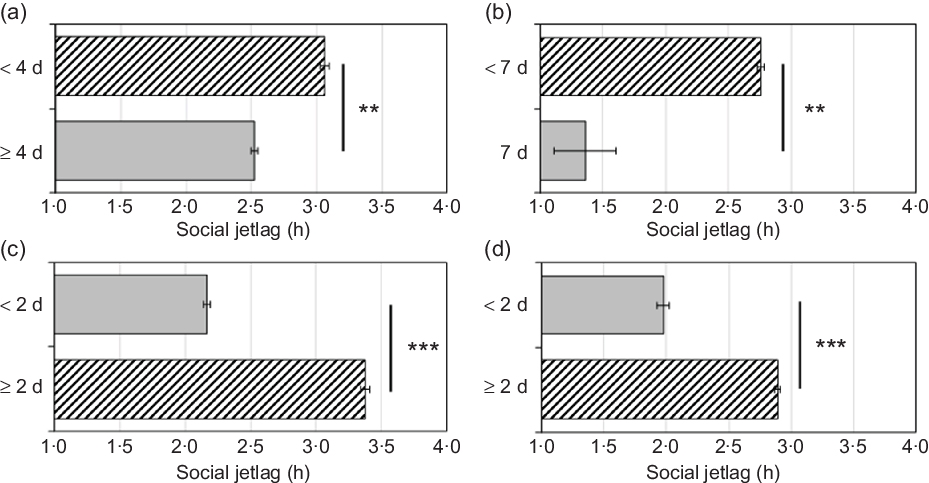
Fig. 1. (a) Breakfast consumption per school week; (b) vegetable/fruit consumption per week; (c) fast food consumption per week; (d) sweetened drinks consumed daily. Adjusted for school night sleep duration and covariates including ethnicity (White non-Hispanic/Latino, Black non-Hispanic/Latino, Hispanic/Latino, or Other, Mixed, or None) in model 4, binomial logistic regression analyses indicated that greater social jetlag was significantly associated with lower odds of consumption of breakfast (panel a; OR = 0·92, P = 0·003) and vegetables/fruits (panel b; OR = 0·92, P = 0·009) and higher odds of consumption of fast food (panel c; OR = 1·18, P < 0·001) and sweetened drinks (panel d; OR = 1·18, P < 0·001). Grey bars are ‘healthy’, and hatched bars are ‘unhealthy.’ Error bars indicate standard errors of the mean. **P < 0·01, ***P < 0·001.
Table 3. Logistic regression models predicting eating behaviours from social jetlag (n 3060)
(Odds ratios and 95 % confidence intervals)
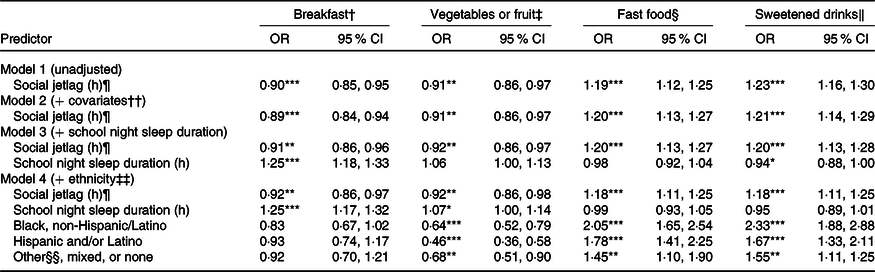
*P < 0·05, **P < 0·01, ***P < 0·001.
† Odds of consuming breakfast ≥4 d (v. <4 d) during the school week.
‡ Odds of consuming fruits or green vegetables 7 d (v. <7 d) weekly.
§ Odds of consuming fast food ≥2 d (v. <2 d) weekly.
‖ Odds of consuming ≥2 sweetened drinks (v. <2) daily.
¶ Calculated as | midpoint of sleep on weekend nights − midpoint of sleep on school nights |(Reference Wittmann, Dinich and Merrow13).
†† Covariates include sex, age, youth living arrangements and household income level.
‡‡ Categories include White, non-Hispanic/Latino (reference group), Black, non-Hispanic/Latino, Hispanic and/or Latino (any race), or Other, Mixed or none.
§§ Other category includes Asian, Central American/Caribbean, Native American/Alaska Native, and/or Native Hawaiian/Pacific Islander.
Breakfast consumption per school week
Model 1 (unadjusted) indicated a significant negative association between social jetlag and odds of breakfast consumption ≥4 d per school week. This association remained significant after further adjustment for demographic and household characteristics (age in years, sex, youth living arrangements and household income) in model 2, school night sleep duration in model 3 and ethnicity in model 4 (OR = 0·92, P = 0·003; 8 % lower odds with each additional hour of social jetlag).
Vegetable/fruit consumption per week
Model 1 (unadjusted) indicated a significant negative association between social jetlag and odds of vegetable/fruit consumption 7 d/week. This association remained significant after further adjustment for demographic and household characteristics (excluding ethnicity) in model 2, school night sleep duration in model 3 and ethnicity in model 4 (OR = 0·92, P = 0·009; 8 % lower odds with each additional hour of social jetlag).
Fast food consumption per week
Model 1 (unadjusted) indicated a significant positive association between social jetlag and odds of fast food consumption ≥2 d/week. This association remained significant after further adjustment for demographic and household characteristics (excluding ethnicity) in model 2, school night sleep duration in model 3 and ethnicity in model 4 (OR = 1·18, P < 0·001; 18 % higher odds with each additional 1 h of social jetlag).
Sweetened drinks consumed daily
Model 1 (unadjusted) indicated a significant positive association between social jetlag and odds of ≥2 sweetened drinks daily. This association remained significant after further adjustment for demographic and household characteristics (excluding ethnicity) in model 2, school night sleep duration in model 3 and ethnicity in model 4 (OR = 1·18, P < 0·001; 18 % higher odds with each additional 1 h of social jetlag).
Association of social jetlag with BMI percentile
Model 1 (unadjusted) indicated a significant positive association between social jetlag and BMI percentile, which remained after further adjustment for demographic and household characteristics (excluding ethnicity) in model 2, school night sleep duration in model 3 and eating behaviours in model 3e (b = 0·84, P = 0·037; 0·84 higher BMI percentile with each additional hour of social jetlag). Social jetlag did not interact with ethnicity in the analysis of BMI percentile; therefore, no interaction term was included in these analyses, but ethnicity was included as a covariate. After adjustment for ethnicity in model 4, there was no significant association between social jetlag and BMI percentile (b = 0·72, P = 0·072). Fig. 2 depicts associations of social jetlag with BMI percentile, unadjusted for ethnicity in model 3e and adjusted for ethnicity in model 4 (see also Table 4).

Fig. 2. Adjusted for school night sleep duration, demographic and household covariates, eating behaviours, but not ethnicity in model 3e, linear regression analyses indicated that greater social jetlag (![]() ) was significantly associated with higher BMI percentile (b = 0·84, P = 0·037). After adjustment for ethnicity in model 4, the association between social jetlag and BMI percentile was attenuated (
) was significantly associated with higher BMI percentile (b = 0·84, P = 0·037). After adjustment for ethnicity in model 4, the association between social jetlag and BMI percentile was attenuated (![]() ) (b = 0·72, P = 0·072). *P < 0·05; NS, not significant.
) (b = 0·72, P = 0·072). *P < 0·05; NS, not significant.
Table 4. Linear regression model predicting BMI percentile† from social jetlag (n 3060)
(Unstandardised b-coefficients and 95 % confidence intervals)
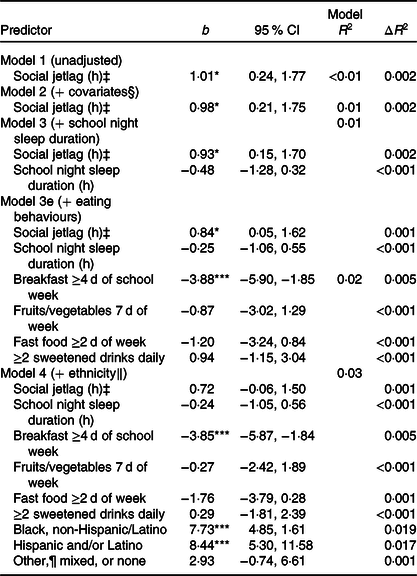
*P < 0·05, ***P < 0·001.
† Calculated based on 2000 Centers for Disease Control and Prevention growth charts, matched for age and sex(Reference Kuczmarski, Ogden and Guo48).
‡ Calculated as | midpoint of sleep on weekend nights − midpoint of sleep on school nights |(Reference Wittmann, Dinich and Merrow13).
§ Covariates include sex, age, youth living arrangements and household income level.
‖ Categories include White, non-Hispanic/Latino (reference group), Black, non-Hispanic/Latino, Hispanic and/or Latino (any race), or Other, Mixed or None.
¶ Other category includes Asian, Central American/Caribbean, Native American/Alaska Native and/or Native Hawaiian/Pacific Islander.
Discussion
We investigated the associations of social jetlag with eating behaviours and BMI percentile in a large, ethnically diverse sample of adolescents. Our findings indicate that adolescents with high social jetlag exhibit patterns of eating that are associated with negative health consequences such as obesity. With each additional hour of social jetlag, adolescents were 8 % less likely to engage in healthy eating behaviours and 18 % more likely to engage in unhealthy eating behaviours. Without accounting for ethnicity, each additional hour of social jetlag was significantly associated with a nearly 1-unit increase in BMI percentile, which became attenuated when accounting for ethnicity. Future studies that examine the cross-sectional relationship between types of circadian misalignment (such as social jetlag) and obesity markers should therefore consider examining ethnoracial differences.
Even after adjustment for ethnicity, social jetlag was associated with unhealthier eating behaviours: 8 % lower odds of consumption of breakfast and vegetables/fruits, and 18 % higher odds of consumption of fast food and sweetened drinks, with each additional hour of social jetlag. Experimental studies have indicated that induced circadian misalignment results in metabolic alterations that are conducive to greater consumption of energy-dense foods, such as sweetened beverages and fast food. For example, forced desynchrony, wherein individuals follow a day/night cycle shorter or longer than the intrinsic circadian period of approximately 24 h, leads to lower levels of the satiety hormone leptin(Reference Scheer, Hilton and Mantzoros51). Circadian misalignment induced by a 12-h phase shift increases post-prandial levels of the hunger hormone ghrelin and increases appetite for energy-dense foods(Reference Qian, Morris and Caputo52). These studies are supported by the present observational study in which adolescents with social jetlag were more likely to consume greater fast food and sweetened drinks, and by previous research indicating an association between social jetlag and higher consumption of sweets and saturated fat(Reference Mota, Silva and Balieiro27).
Unadjusted for ethnicity, we found that social jetlag was associated with higher BMI percentile, similar to previous research(Reference Islam, Akter and Kochi7–Reference Malone, Zemel and Compher12) (about a one-unit increase in BMI percentile with each additional hour of social jetlag). Experimental studies of circadian misalignment have demonstrated metabolic dysregulation that may explain the link between social jetlag and obesity. For example, 28-h forced desynchrony results in insulin resistance(Reference Scheer, Hilton and Mantzoros51), simulated night-shift work reduces energy expenditure(Reference McHill, Melanson and Higgins53) and a 12-h phase shift lowers insulin sensitivity(Reference Qian, Dalla Man and Morris54). Indeed, research has demonstrated that higher social jetlag is associated with obesity and related indices, such as higher TAG and fasting insulin(Reference Wong, Hasler and Kamarck55). These studies, along with the present research, indicate that social jetlag increases the risk for excess body weight and related adverse health outcomes. After adjustment for ethnicity, the relationship between social jetlag and BMI percentile was attenuated and no longer statistically significant. To date, most observational studies of the relationship between social jetlag and obesity markers have either been conducted in relatively ethnically homogenous populations (e.g. mostly White/Caucasian or East Asian) and/or have not mentioned adjustment for ethnicity(Reference Islam, Akter and Kochi7,Reference Parsons, Moffitt and Gregory8,Reference Wong, Hasler and Kamarck10,Reference Johnsen, Wynn and Bratlid20–Reference Rutters, Lemmens and Adam22,Reference de Zwart, Beulens and Elders25,Reference Almoosawi, Palla and Walshe56) . We found significant differences in social jetlag, eating behaviours and BMI among ethnic groups that may account for the attenuation of the relationship between social jetlag and BMI percentile observed in the present study. Future studies that examine the associations of social jetlag with eating behaviours and BMI should study individuals of varying ethnoracial identities in consideration of the findings in the present study. In contrast to social jetlag, we did not observe an association between short school night sleep duration and BMI percentile in the present study (Table 4), though research demonstrates short sleep is associated with higher BMI(Reference Ames, Holfeld and Leadbeater17–Reference Ruan, Xun and Cai19). Short sleep during the school week was associated with higher social jetlag in the present study, but the present analyses support the distinction between short sleep and social jetlag as separate concepts that denote different aspects of sleep deficiency.
Our findings indicate that individuals with social jetlag are at greater risk for unhealthy eating behaviours. Youth with later bedtimes during the school week who must wake early for school or other obligations will likely have higher social jetlag(Reference Wittmann, Dinich and Merrow13), which is associated with lower odds of consumption of breakfast and fruits/vegetables and higher odds of consumption of fast food and sweetened drinks while adjusting for race/ethnicity. We also found a significant relationship between social jetlag and BMI that was attenuated after adjustment for race/ethnicity. One strategy to reduce social jetlag is through lengthening sleep on school nights to reduce sleep debt across the week and prevent compensatory delayed wake time on the weekends.
Limitations of the present study include a cross-sectional study design, restricting our ability to determine temporal order of social jetlag, eating behaviours and BMI. It is plausible, for example, that high BMI induces changes to social jetlag, as a high-fat diet can alter metabolites in the suprachiasmatic nucleus (the ‘master clock’), leading to changes in sleep–wake patterns and social jetlag(Reference Dyar, Lutter and Artati57). Future longitudinal research should investigate whether social jetlag precedes, succeeds or has a reciprocal relationship with eating behaviours and BMI in adolescents. Additionally, as the study was observational, we are unable to determine whether it is ethnicity or an unmeasured related variable that attenuates the association between social jetlag and BMI percentile. The present study used self-reported sleep data rather than objective measures; however, research has shown a strong correlation between subjective and objective measures (i.e. actigraphy) of sleep duration(Reference Lockley, Skene and Arendt58). Furthermore, though BMI correlates highly with body composition(Reference Javed, Jumean and Murad59), research indicates this correlation is stronger for White/Caucasian v. Black individuals(Reference Daniels, Khoury and Morrison60). Additionally, the eating behaviour questions did not capture quantities of food and beverage consumption. Strengths of the present study are its large sample size, racial and ethnic diversity, and the inclusion of demographic and household covariates in regression models (e.g. age, race/ethnicity, sex, household structure) that may have been confounding variables(Reference Xing, Lin and Xing61).
In conclusion, we found that social jetlag was associated with unhealthy eating behaviours in adolescents while adjusting for socio-demographic characteristics. Furthermore, social jetlag was associated with higher BMI in unadjusted analyses but not after adjustment for race/ethnicity. Our findings indicate ethnoracial differences in social jetlag may attenuate the relationship between social jetlag and BMI observed in some previous studies(Reference Islam, Akter and Kochi7–Reference Wong, Hasler and Kamarck10). Future experimental and longitudinal research should further probe the associations between social jetlag, eating behaviours and BMI in adolescents of diverse ethnoracial backgrounds.
Acknowledgements
Research reported in this publication was supported by the Eunice Kennedy Shriver National Institute of Child Health and Human Development (NICHD) of the National Institutes of Health under award numbers R01HD073352 (to L. H.), R01HD36916, R01HD39135 and R01HD40421, as well as a consortium of private foundations. The NICHD had no role in the design, analysis or writing of this article.
L. H. obtained funding and institutional review board approval for the project. G. M. M. formulated the research questions, conducted the literature search and statistical analyses, wrote the manuscript and composed the figures and tables. L. H. and A.-M. C. assisted in writing the manuscript. All authors were involved in writing the paper and had final approval of the submitted and published versions.
The authors have indicated no financial conflicts of interest relevant to the present study. L. H. receives an honorarium from the National Sleep Foundation for serving as Editor-in-Chief of the journal Sleep Health.
Supplementary material
For supplementary material referred to in this article, please visit https://doi.org/10.1017/S0007114520001804


