


CVD and cerebrovascular diseases are two leading causes of death(Reference Hoyert1) and hypertension is a main risk factor for the occurrence of CHD and stroke(Reference Guilbert2). The evidence for a causal relationship between chronic high salt intake and high blood pressure (BP) in adults is strong(Reference Forte, Miguel and Miguel3, Reference He and MacGregor4). Apart from salt intake, the potential of a higher fruit and vegetable intake (FVI) to decrease BP has been documented in well-conducted intervention studies(Reference Appel, Moore and Obarzanek5, Reference John, Ziebland and Yudkin6). In one well-controlled trial, the Dietary Approaches to Stop Hypertension (DASH) Study, it has been shown that a reduction of salt intake together with the consumption of a FV-rich diet leads to the greatest reduction of BP(Reference Vollmer, Sacks and Ard7).
Concern exists about the rising prevalence of hypertension in childhood and adolescence(Reference Feber and Ahmed8) and the existing tracking pattern of BP(Reference Chen and Wang9). Therefore, it is important that modifiable risk factors be identified and preventive nutritional measures be started early in childhood. A meta-analysis of ten controlled trials(Reference He and MacGregor10) with a median duration of 4 weeks has provided evidence that dietary salt intake during growth plays a role in the regulation of BP in children. Longitudinal or intervention studies on the influence of FVI on BP are rare, especially in normotensive children. So far, a small longitudinal study (ninety-five individuals) in normotensive children(Reference Moore, Singer and Bradlee11) and a 3-month clinic-based intervention in prehypertensive or hypertensive adolescents(Reference Couch, Saelens and Levin12) have suggested that a dietary pattern rich in FV may have beneficial effects on BP during growth. Larger longitudinal studies in healthy, free-living children examining the relative effects of FVI and salt intake on BP development have not been carried out yet.
Therefore, in the present longitudinal investigation, we aimed to characterise the long-term concomitant and independent influence of salt intake and FVI on BP development throughout childhood and adolescence.
Methods
Study population
Children and adolescents investigated in the present longitudinal study were 4–18-year-old participants of the ongoing Dortmund Nutritional and Anthropometric Longitudinally Designed (DONALD) Study. Since 1985, the DONALD Study has been collecting information on diet, metabolism and development of healthy, free-living individuals between infancy and young adulthood. The study protocol involved 24 h urine sample collection, 3 d weighed dietary records, anthropometric measurements and medical assessments as well as interviews on lifestyle at regular intervals(Reference Kroke, Manz and Kersting13). The present study was conducted according to the guidelines laid down in the Declaration of Helsinki, and all procedures involving human subjects were approved by the Ethics Committee of the University of Bonn (Germany). All assessments were carried out with parental and later on with children's written consent.
From 1107 subjects of the DONALD Study, 471 subjects were selected, for whom at least three BP measurements had been taken and who had provided three parallel 24 h urine samples as well as 3 d weighed dietary records. This number was reduced to 446, comprising those term (37–42 weeks of gestation) children with available birth weight as well as breast-feeding data. In addition, those (n 3) who had taken BP-influencing drugs, regularly or on the day of BP measurements, were excluded. Finally, eight children were excluded because of implausible systolic BP (SBP) or diastolic BP (DBP) data (>4 or < − 4 standard deviation scores (SDS)) according to the German reference values(Reference Neuhauser, Thamm and Ellert14, Reference Neuhauser, Schienkiewitz and Schaffrath Rosario15). Accordingly, the subcohort studied included 435 subjects (212 boys). The mean number of observations for each subject was 5·5 (range 3–11). These subjects were selected specifically for the present study, and the assessments described below are based on a part of the original study protocol of the DONALD Study.
Blood pressure measurements
BP measurements were scheduled and taken every 2 years in the DONALD Study. SBP and DBP had been measured by trained nurses according to standard procedures with a random zero sphygmomanometer until 1994 and with a standard mercury sphygmomanometer (Mercuro 300, WelchAllyn) thereafter. BP values determined before 1994 were corrected for known systematically lower measurements of random zero sphygmomanometers(Reference Yang, Gu and Chen16) by multiplication with an internally validated correction factor (e.g. for SBP: 1·056). Appropriate cuff sizes were used according to arm circumferences. BP was measured in the right arm of the subjects after 5 min of rest. DBP was recorded as the point of disappearance of Korotkoff sounds (phase V). On each measurement occasion, two consecutive BP measurements were recorded, and the arithmetic mean of both readings was used in the analysis. We also calculated age-, sex- and height-independent SDS for SBP and DBP according to the German reference curves for children and adolescents aged 3–17 years(Reference Neuhauser, Schienkiewitz and Schaffrath Rosario15) and for subjects aged 18 years according to reference values for the German population (age group: 18–19 years)(Reference Thamm17).
Anthropometric measurements
Annually scheduled anthropometric measurements were taken by trained nurses according to standard procedures. Body weight was measured to the nearest 0·1 kg using an electronic scale (Seca 753E, Seca Weighing and Measuring Systems) and height was determined to the nearest 0·1 cm using a stadiometer (Harpenden; Holtain Limited) with the participants in barefoot and dressed in underwear only. BMI was calculated using the formula weight/height2 (kg/m2). Additionally, sex- and age-independent SDS were calculated for children's height and BMI using the German reference data(Reference Neuhauser, Schienkiewitz and Schaffrath Rosario15). Growth velocity was calculated as the difference between height during a certain measurement occasion and height in the year before that measurement occasion divided by the time interval (in years) between the two measurement occasions.
Dietary recording
On three consecutive days, the parents of the children or the older subjects themselves weighed and recorded all foods and beverages before consumption as well as leftovers with the help of electronic food scales ( ± 1g). If weighing was not possible, household measures (e.g. number of spoons) were allowed. The responsibility for the record switch from the parents to the children/adolescents depended on age and willingness. Some children began to assist their parents in recording from the age of 7 onwards; 80 % of the 10–12-year-old children already helped with the recording. In the adolescent groups, totally self-reliant records were kept by 20–30 % of the participants at the age of 13–14 years and by 70–90 % at the age of 15–18 years. In about 80 % of the daily records, more than 90 % of the consumed food items were weighed rather than estimated irrespective of age and sex(Reference Kersting, Sichert-Hellert and Lausen18). Mean 3 d food, energy and nutrient intakes were calculated from the weighed dietary records using our continuously updated in-house food and nutrient database LEBTAB (LEBensmittel TABelle)(Reference Sichert-Hellert, Kersting and Chada19). In the present study, individual FVI was calculated as the sum of FV consumed either separately or as part of composite foods with >50 % FV content and also included 100 % FV juices.
Urinary measurements
The collection of 24 h urine samples, scheduled at yearly intervals in the DONALD Study, was carried out at the subjects' homes under standardised conditions(Reference Remer, Neubert and Maser-Gluth20), and samples were stored at ≤ − 20°C until analysis. Urinary creatinine concentrations were measured using the kinetic Jaffé procedure with a creatinine analyser (Beckmann-2; Beckman Instruments, Inc.). Since salt intake is especially difficult to assess using dietary records, we used 24 h urinary Na excretion as a biomarker. In addition, to support our findings regarding the potential BP-modifying effect of FVI derived from dietary records, we also used 24 h urinary K excretion as an approximate biomarker. Na and K concentrations were measured using flame atomic absorption spectrometry (Perkin Elmer 1100 Spectrometer, Perkin Elmer).
Other measurements
Upon the enrolment of their children into the DONALD Study, parents were interviewed about familial characteristics, and equipment the same as that used for the children was used for anthropometric and BP assessments. Information on birth characteristics was abstracted from the ‘Mutterpass’, a standardised document given to all pregnant women in Germany, and the duration of breast-feeding was assessed during the first few visits until complementary feeding was initiated. Physical activity (active, moderately active and inactive) was assessed using a questionnaire on daily organised and unorganised activities, which is an adaptation of the Adolescent Physical Activity Recall Questionnaire(Reference Booth, Okely and Chey21). Tanner stage was determined by a study paediatrician from the age of 5 years onwards. The age at which stage II pubic hair, a clinical marker of the beginning of a more pronounced adrenal androgen secretion, was used to differentiate between pre-pubertal and pubertal measurements in the present study population.
Statistical analyses
SAS procedures (version 9.1; SAS Institute, Inc.) were used for data analysis. A P value < 0·05 was considered significant for the statistical tests. Descriptive data for the first and last assessments of girls and boys are given as medians and interquartile ranges. Differences between the first and last assessments were tested using paired t tests for normally distributed characteristics and the Wilcoxon signed-rank test for non-normally distributed characteristics. Differences between boys and girls were tested using unpaired t tests for normally distributed characteristics and the Wilcoxon rank-sum test for non-normally distributed characteristics.
Linear mixed-effects regression models (PROC MIXED in SAS), including both fixed and random effects, were used to investigate the independent associations of salt intake and FVI with BP. An advantage of the MIXED procedure is that it does not exclude children from the analysis if they have data missing for a particular time point, but it analyses all the data available on the assumption that any missing data are missing at random. A random statement was included to account for the variation in initial BP levels (intercept) between the subjects. A second random statement allowed for the BP trajectories to vary with respect to the initial level and quadratic trends with age between the children from different families.
To allow for the distinction between within-person and between-person effects of salt intake or FVI on BP, data were first centred on the respective person-specific means over time, and these means were used to predict the between-person effects on BP (i.e. the associations of between-person differences in salt intake or FVI with differences in mean BP between the subjects). After that, time-specific deviations from the person-specific means were calculated and used to test whether within-person changes in salt intake or FVI were associated with within-person changes in BP(Reference Curran and Bauer22, Reference Hoffman and Stawski23). Separate models were constructed for outcome SBP or DBP.
In the basic models, time (chronological age, age2 and age3), sex, person-specific means and time-specific deviations from individual means of the respective predictor (i.e. total energy intake-adjusted Na excretion or FVI or K excretion) were included as the independent fixed effects. Based on these basic models, two pre-specified subgroup interaction analyses, i.e. predictor-by-sex and predictor-by-pubertal stage, were carried out. The results indicated that there were no (P>0·1) predictor-by-sex interactions. Thus, data obtained from girls and boys were analysed together. Since physiological changes during puberty may modify the associations between food intake and BP, we also examined whether the effects of the predictors on BP were different between the pre-pubertal and pubertal stages. For Na excretion–SBP association, the significance level of the between-person effect-by-pubertal stage interaction was P= 0·03 and that of the within-person effect-by-pubertal stage interaction was P= 0·1. For Na excretion–DBP association, only the within-person effect-by-pubertal stage interaction was significant (P= 0·03). For FVI, the significance of the between-person effect-by-pubertal stage interaction was P= 0·09 with SBP and P= 0·07 with DBP as the outcome and no within-person effect-by-pubertal stage interaction was observed. To avoid reduction of sample size and number of measurements for each subject induced by group stratification, we included interaction terms in the PROC MIXED models.
The fixed effects of potential confounding factors such as BMI-SDS, height-SDS, growth velocity, physical activity, total energy intake, Ca and Mg intakes, maternal overweight (BMI >25 kg/m2), and BP and education levels as well as the early-life factors (including birth weight, gestational age and breast-feeding status) were also considered. They were initially examined separately based on the basic models and included in the fully adjusted models if they substantially modified the predictor–BP association (i.e. if changes in the β-coefficients of the examined predictor were >10 %) in the basic model or if they had their own independent significant fixed effects (P< 0·05) or improved the fit statistic (Akaike's information criterion).
For quantifying the relative magnitude of the within-person and between-person variance components of SBP, DBP, FVI and salt intake, we used intra-class correlation coefficient (ρ), which describes the proportion of the total outcome variation that is attributed to differences among the subjects. The value of ρ is between 0 and 1; the higher the value of ρ, the higher the between-person variance. Within-person and between-person variances were estimated using an unconditional means model with no predictors and only one random statement accounting for intercept(Reference Hoffman and Stawski23, Reference Singer, Willett, Singer and Willett24).
Results
Participant characteristics
Birth, breast-feeding and maternal characteristics of the study population are presented in Table 1. BP and the parallel anthropometric, urinary and dietary characteristics during the first and last assessments are given separately for boys and girls in Table 2. During both the assessments and for both boys and girls, negative BP-SDS and BMI-SDS values indicated that mean BP and BMI were slightly below those of the German reference population of the same age and sex(Reference Neuhauser, Schienkiewitz and Schaffrath Rosario15). The median age of the study participants was 6 years at baseline and 16 years during the last assessment. During this time period, the increase in the absolute values of SBP and DBP was similar (on average, about 13 mmHg). There was no significant difference in BP between boys and girls at the baseline age; after 10 years (on average), boys had 4 mmHg higher SBP than girls, but DBP was not different between the sexes.
Table 1 General characteristics of the study sample (Number of subjects and percentages; median values and 25th–75th percentiles)
* For nine subjects, maternal blood pressure data were not available; the missing data were amended using the population median value for the PROC MIXED analysis.
Table 2 Blood pressure (BP) and the parallel anthropometric, urinary and dietary characteristics of the study sample (n 435, 212 boys) during the first and last assessments (Medians and 25th–75th percentiles)
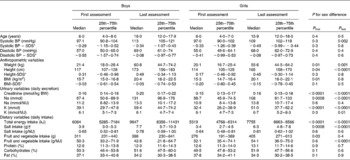
SDS, standard deviation scores; BW, body weight.
* Standardised according to the German reference values (results from the KiGGS Study; German Health Interview and Examination Survey for Children Adolescents)(Reference Neuhauser, Thamm and Ellert14, Reference Neuhauser, Schienkiewitz and Schaffrath Rosario15).
† Estimated from 24 h urinary Na excretion: 1 mmol Na excretion corresponds to 0·06 g salt intake.
The estimated salt intake (derived from urinary Na excretion) was 3·4–7·7 g/d (Table 2). According to the extrapolated values (from the upper limit of the recommended Na consumption for adults), Na consumption in 4–8-year-old children should not exceed a maximum of 83 mmol Na/d (corresponding to a salt intake of 4·8 g). In the study population, Na consumption in 25 % of the children exceeded this upper limit during the first assessment at an average age of 6 years. During the last assessment (average age: 16 years), Na consumption in 65 % of the subjects had already exceeded the upper limit of 100 mmol/d Na excretion (corresponding to a salt intake of 5·8 g) for adults(25). From the first to the last assessment, a significant (P< 0·0001) increase in salt intake per MJ was observed for both boys and girls and a significant (P< 0·0001) decrease in FVI per MJ only for boys (P values for the tests between the first and last assessments are not given in Table 2). There was no significant difference in salt intake per MJ between boys and girls, but boys had a lower FVI per MJ than girls, which was significant during the last assessment.
Longitudinal associations of fruit and vegetable intake and salt intake with blood pressure
The results of the repeated-measures regression analysis (PROC MIXED) with Na excretion per MJ as the explanatory variable and SBP or DBP as the outcome are given in Table 3. Although no stratified analyses were carried out, parameter estimations (β-values), 95 % CI and P values could be derived separately for the pre-pubertal and pubertal stages after including the corresponding interaction terms.
Table 3 Results of the linear mixed model for the association between sodium excretion and blood pressure (BP) in 435 4–18-year-old participants of the Dortmund Nutritional and Anthropometric Longitudinally Designed Study (β-Coefficients and 95 % confidence intervals)
* β-Values of the between-person effect indicate a difference in systolic BP in mmHg for a 1 mmol/MJ per d difference in Na excretion between the individuals across time.
† β-Values of the within-person effect indicate an intra-individual change in BP (in mmHg) with a 1 mmol/MJ per d individual change in Na excretion.
‡ Model adjusted for age, age2, age3, sex, pubertal group, intra-individual change in Na excretion × pubertal group and person-specific mean-Na excretion × pubertal group.
§ Model additionally adjusted for total energy intake (TEI), TEI × pubertal group, BMI-standard deviation scores (SDS), height-SDS, birth weight, full breast-feeding status, maternal systolic BP, fruit and vegetable intake (FVI), and FVI × pubertal group.
∥ Model additionally adjusted for TEI, TEI × pubertal group, BMI-SDS, height-SDS, growth velocity, full breast-feeding status, maternal diastolic BP, FVI, FVI × pubertal group and Ca intake.
In the pre-pubertal stage, Na excretion was associated neither with SBP nor with DBP. In the pubertal stage, no between-person effect was observed; however, an intra-individual increase in Na excretion was almost significantly associated with an intra-individual increase in SBP (P= 0·06) and tended to be associated with DBP (P= 0·09). According to the β-values given in Table 3, a 1 mmol increase in Na excretion (corresponding to a 0·06 g increase in salt intake) per MJ above the person-specific mean was associated with a 0·1 mmHg within-person increase in BP. On assuming a daily total energy intake of 7 MJ (the average of the study population), this 0·1 mmHg within-person increase in BP would be associated with an increase of (0·06 × 7 = ) 0·42 g in salt intake per d. Thus, a 1 g/d higher salt intake in the study population would lead to a 0·2 mmHg increase in SBP and DBP.
PROC MIXED models with FVI (or its urinary biomarker K excretion) per MJ as the explanatory variable showed a significant between-person effect on SBP (P= 0·03) and on DBP (P= 0·03) in the pre-pubertal stage, but no within-person effect (Table 4). A difference of 1 g in FVI per MJ between persons was related to a 0·03 mmHg between-person difference in BP. With an average total energy intake of 7 MJ, a child with a 100 g higher FVI/d had a 0·4 mmHg lower BP value. Neither a between-person nor a within-person effect of FVI on BP was observed in the pubertal stage. Results obtained for K excretion per MJ (as a urinary biomarker of FVI) were similar to those obtained for FVI.
Table 4 Results of the linear mixed model for the association between fruit and vegetable intake (FVI) (or K excretion) and blood pressure (BP) in 435 4–18-year-old participants of the Dortmund Nutritional and Anthropometric Longitudinally Designed Study (β-Coefficients and 95 % confidence intervals)
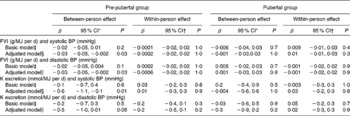
* β-Values of the between-person effect indicate a difference in systolic BP in mmHg for a 1 g/MJ per d difference in FVI (or for 1 mmol/MJ per d K excretion) between the individuals across time.
† β-Values of the within-person effect indicate an intra-individual change in BP (in mmHg) with a 1 g/MJ per d individual change in FVI (or with a 1 mmol/MJ per d individual change in K excretion).
‡ Model adjusted for age, age2, age3, sex, pubertal group, intra-individual change in (Δ) FVI (or Δ K excretion) × pubertal group, and person mean (PM)-FVI (or PM-K excretion) × pubertal group.
§ Model additionally adjusted for total energy intake (TEI), TEI × pubertal group, BMI-standard deviation scores (SDS), height-SDS, birth weight, full breast-feeding status, maternal systolic BP, Na excretion and Na excretion × pubertal group.
∥ Model additionally adjusted for TEI, TEI × pubertal group, BMI-SDS, height-SDS, growth velocity, full breast-feeding status, maternal diastolic BP, Na excretion and Na excretion × pubertal group.
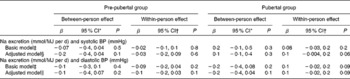
Within-person variance, between-person variance and intra-class correlation coefficients (ρ) for SBP, DBP, Na excretion per MJ and FVI per MJ are given in Table 5 according to the pubertal stage. The values of ρ were similar between the pre-pubertal and pubertal stages for all the examined variables except for SBP, which showed a relatively higher between-person variation in the pubertal stage than in the pre-pubertal stage. For BP and Na excretion, the between-person variation was much lower than the within-person variation (ρ = 0·1–0·3), indicating that only 10–30 % of the total variation in these variables was explained by differences between the children. For FVI, the between-person and within-person variations were similar (ρ = 0·5), indicating a higher tracking.
Table 5 Between-person and within-person variations in blood pressure (BP), sodium excretion and fruit and vegetable intake (FVI) in the pre-pubertal and pubertal groups
* ρ = σ 2-between/(σ2-between+σ2-within) describes the proportion of the variable variation that is attributed to differences among the subjects, i.e. the higher the value of ρ, the higher the between-person variation relative to the within-person variation.
Discussion
In the present longitudinal investigation in normotensive children, we examined the independent associations of salt intake and FVI with BP throughout childhood and adolescence and differentiated between the between-person and within-person effects of these dietary factors on BP. Salt intake was not related to BP in the pre-pubertal stage; however, in the pubertal stage, a weak association between change in salt intake and change in SBP was observed. Independent of salt intake and body size, differences in FVI between healthy individuals may explain the variation in BP in the pre-pubertal stage. However, this association was not observed in the pubertal stage. The intra-individual change in FVI in the present study did not correlate with a corresponding significant change in BP. The comparable results obtained for the urinary K excretion–BP association and the FVI–BP association further confirmed our findings. On assuming a total energy intake of 7 MJ/d (average value of the study population), each 1 g increase in salt intake was associated with a 0·2 mmHg increase in BP in adolescents and each 100 g higher FVI was associated with a 0·4 mmHg lower BP value in pre-pubertal children. In practice, each additional serving of FV, e.g. a medium apple or a medium whole red tomato or a cup of cucumber slices, corresponding to approximately 120 g, was associated with a 0·5 mmHg lower BP value.
Although a large number of observational (mostly cross-sectional) studies have been carried out on the relationship between salt intake and BP in children, only a few of them were conducted using multiple measurements of 24 h urinary Na excretion, which is considered to be the most accurate method for assessing dietary salt intake. In addition, a few of them were well controlled for potential confounding factors at the same time. In one of the most carefully conducted studies (cross-sectionally analysed), in which seven consecutive 24 h urine samples were collected in seventy-three 11–14-year-old children, Cooper et al. (Reference Cooper, Soltero and Liu26) found that a 1 mmol increase in Na excretion was associated with a 0·06 mmHg increase in SBP. This effect was much higher than that observed in the present longitudinal investigation. We found that a 1 mmol increase in Na excretion was associated with only a 0·01 mmHg increase in SBP. Apart from the differences in study design and in adjustment for confounders, ethnic composition should also be considered. In Cooper's study, 54 % of the subjects were Black, but all the participants of the DONALD Study were Caucasian. Although Cooper et al. (Reference Cooper, Soltero and Liu26) included race in the regression models, no Na excretion-by-race interaction had been examined or reported in this study. Another study(Reference Harshfield, Alpert and Pulliam27) carried out in 10–18-year-old subjects has found that Na excretion is only associated with BP in Black subjects, but not in White subjects. Therefore, higher salt sensitivity in the Black population(Reference Falkner and Kushner28) could be one important factor contributing to the difference in the magnitude of the association between salt intake and BP.
A recent meta-analysis of controlled trials including participants in the age range of 8–16 years has shown that a 42 % (approximately 3 g/d) reduction of salt intake leads to a decrease in SBP of 1·2 mmHg. In the present analysis, the identified effect size in a similar age range was much lower, which may be partly because of the participants of the DONALD Study – compared with the German reference population(Reference Neuhauser, Schienkiewitz and Schaffrath Rosario15) – having lower BP levels with a median SDS of − 0·45. In adults for a given reduction of salt intake, the decrease in BP is larger in individuals with higher BP than in those with lower BP(Reference Grobbee and Hofman29, Reference He, Burnier and Macgregor30).
In the pre-pubertal children, we did not find any association between salt intake and BP. This is in line with the finding of a recent large (n 1658) cross-sectional study carried out in 4–18-year-old subjects by He et al. (Reference He, Marrero and Macgregor31). The authors found a significant association between salt intake and SBP; however, the subgroup analyses showed that this association was not significant in the younger age groups. The only available longitudinal study carried out by Geleijnse et al. (Reference Geleijnse, Grobbee and Hofman32) did not report a significant effect of salt intake on the change in BP in 5–17-year-old children after 7 years of follow-up. These two studies together with the present longitudinal investigation indicate that the effect of salt intake on BP may not be prominent in early childhood, while it could be already relevant in later adolescence. An increased salt sensitivity with increasing age could be one explanation(Reference Overlack, Ruppert and Kolloch33). In adults, it has been shown that for a given change in salt intake, the change in BP is greater in older individuals than in young people(Reference Overlack, Ruppert and Kolloch33). Such an influence of age on the salt intake–BP relationship may also exist in children and adolescents. Additionally, both within-person and between-person variations in total energy intake-adjusted Na excretion and SBP (Table 5) were higher in the pubertal group than in the pre-pubertal group. We may thus have been underpowered to detect an existing mild effect of salt intake on the change in BP in the younger age group.
A randomised trial of Na intake and BP in newborn infants has shown that systolic pressure is 2·1 mmHg lower in the low-Na group than in the ‘higher’ normal-Na group after 6 months of intervention(Reference Hofman, Hazebroek and Valkenburg34). We suppose that the immature kidney function of neonates may partly contribute to this observed significant effect of salt intake on BP. Furthermore, the follow-up study carried out by Geleijnse et al. (Reference Geleijnse, Hofman and Witteman35) for this randomised trial has suggested a predictive role of the effect of salt intake in early life on BP 15 years later. In this study, BP differences between the low-Na and high-Na groups were higher than those observed directly after the intervention phase in the first 6 months of life.
The findings of a significant within-person effect instead of a between-person effect of salt intake may be due to its more than twofold within-person variation compared with the between-person variation. In contrast, the relative between-person variation was much higher for FVI in the population of the present study (Table 5), which may partly explain why we only identified a between-person effect of FVI on BP. It is possible that the small intra-individual change in FVI in the relative homogenous population of the DONALD Study is not great enough to induce a significant change in BP over time. No relationship between FVI and BP was observed in the pubertal stage. Apart from the possible confounding by relevant changes in hormonal status during puberty, a significant reduction of total energy intake-adjusted FVI from pre-puberty (53 g/MJ) to puberty (48 g/MJ) may also play a role.
The strongest evidence available, regarding the protective effect of FV on the increase in BP, is from the clinical trials(Reference Appel, Moore and Obarzanek5, Reference Couch, Saelens and Levin12) emphasising on an intervention using a DASH-type diet, i.e. a diet high in FV and low-fat dairy products. This dietary pattern has been proven to be effective in both hypertensive and normotensive adults(Reference Appel, Moore and Obarzanek5) as well as in adolescents with elevated BP(Reference Couch, Saelens and Levin12). The evidence to make a clear statement regarding the influence of FVI on BP development in normotensive children is rare. The only available longitudinal study carried out in ninety-five normotensive children(Reference Moore, Singer and Bradlee11) has found that subjects with a higher FVI and a concurrent higher intake of dairy products have a lower BP level than those with a higher FVI alone. Ca intake could not explain the observed additional beneficial effect of dairy products in this study. The difference between groups with low and high FVI during preschool years was 2·5 servings, corresponding approximately to 300 g, which led to 3 and 1 mmHg difference in SBP and DPB, respectively, after 8 years of follow-up(Reference Moore, Singer and Bradlee11). In the present longitudinal investigation with a much larger sample size (n 435) in low-normotensive children, we found that children with a 100 g higher FVI had 0·4 mmHg lower SBP and DBP values. Although the DASH diet has also emphasised on the protective effect of low-fat dairy products, we did not identify any independent effect of dairy products, fat intake or Ca intake (data not shown).
The mechanisms by which FV lower BP are unclear. Increased plasma concentrations of antioxidants after a FV intervention could play a role in BP reduction; however, the clinical significance of small rises in antioxidant concentrations is not obvious(Reference John, Ziebland and Yudkin6). FV are rich in K and Mg, both of which have been suggested to have a BP-reducing potential in adults(Reference Jee, Miller and Guallar36, Reference Whelton, He and Cutler37). Mg supplementation has been shown to result in only a small overall reduction of BP(Reference Jee, Miller and Guallar36), whereas K has been shown to lead to a more prominent reduction(Reference Whelton, He and Cutler37). K excretion is commonly used to monitor K intake derived from FV(Reference Bingham, Gill and Welch38). Siani et al. (Reference Siani, Strazzullo and Giacco39) showed that a 1-year intervention to increase FVI produced a 60 % increase in reported K intake, which translated into a 45 % increase in K excretion. Similar effects have been observed in other investigations(Reference Smith-Warner, Elmer and Tharp40). A meta-analysis of randomised controlled clinical trials has revealed changes of − 0·04 in SBP and − 0·03 mmHg DPB per 1 mmol of change in urinary K excretion. In low-normotensive children (with an average daily energy intake of 7 MJ), we found that 1 mmol higher K excretion led to 0·09 and 0·07 mmHg lower SBP and DBP, respectively. Nevertheless, we did not find any Mg–BP association. Several observational studies(Reference Staessen, Bulpitt and Fagard41–Reference Knuiman, Hautvast and Zwiauer43) in children have examined the relationship of the excretion of urinary cations, i.e. K, Ca and Mg, at the same time with BP adjusting for numerous other factors including BMI, but surprisingly they did not find any of these three cations alone to contribute to the prediction of BP. So, Moore et al. (Reference Moore, Singer and Bradlee11) suggested that diets high in FV and dairy products (DASH diet) may just reflect a generally healthier dietary pattern and that these changes in BP cannot be attributed to the effect of a single mineral. Only recently, Nowson et al. (Reference Nowson, Wattanapenpaiboon and Pachett44) have suggested that part of the BP-lowering effect of a DASH dietary pattern may be due to the lower dietary acid load. The DASH diet is rich in Ca, Mg and K, which are all alkali components of the potential renal acid load(Reference Remer, Dimitriou and Manz45). Accordingly, two observational studies(Reference Murakami, Sasaki and Takahashi46, Reference Zhang, Curhan and Forman47) in adults and our recent cross-sectional study(Reference Krupp, Shi and Maser-Gluth48) in healthy children have detected a direct association between dietary acid load and BP-related outcomes. Perhaps, because K is always the most relevant alkali component in a normal mixed diet, it is quite often identified and considered as one of the most BP-relevant minerals. As has also been shown in the present study, only K has been shown to be associated with BP, but not Mg and Ca. Further studies with higher evidence grade are needed to examine the dietary acid load–BP relationship, which would be helpful for understanding the BP-reducing mechanisms of FV-rich or DASH-type diets.
As has been mentioned earlier, the present study is strengthened by the longitudinal design with three to eleven repeated BP measurements throughout childhood and adolescence for each individual. The repeated-measures regression analysis allowed us to differentiate between between-person and within-person variations in outcomes as well as predictors. Moreover, the relationship between FVI and BP was investigated based on not only repeated high standard dietary records, but also a biomarker derived from the parallel 24 h urine samples collected. In addition, we were able to adjust for major potential confounders including both body size variations during the observational period and the early-life and maternal factors, which can account for part of the genetic and epigenetic BP-relevant influence.
The present study also has limitations. The semi-quantitative assessment of physical activity is relatively crude, so it did not show any independent association with BP or modify the dietary factor–BP association. In addition, in the present study, the casual BP measurements, even if taken repeatedly and carried out according to the guidelines, have a relatively high intra-subject variability compared with ambulatory BP measurements(Reference Gimpel, Wuhl and Arbeiter49). The elaborate design of the DONALD Study produces a study sample characterised by participants of high socio-economic status with relative homogenous dietary intakes as well as low BP levels compared with the German reference population; this may lead to an underestimation of the magnitude of associations between dietary factors and BP. Therefore, the effect size of salt intake or FVI on BP during growth can be expected to be larger in the general population.
Our findings suggest that even in healthy children and adolescents with BP in the low-normal range, both salt intake and FVI already start to influence BP, although at a small magnitude. As the establishment of healthy eating habits in childhood determines nutritional behaviour in the long run, a diet with a higher FVI and a lower salt intake from childhood onwards should be an effective approach for the prevention of hypertension in later life.
Acknowledgements
This work was supported by the German Federal Ministry of Food, Agriculture and Consumer Protection (BMELV) through the Federal Office for Agriculture and Food (BLE), grant no. 2811HS007. The DONALD Study is funded by the Ministry of Science and Research of North Rhine Westphalia, Germany. The funders had no role in the design and analysis of the study or in the writing of this article.
The authors' contributions are as follows: L. S. contributed to the study design, carried out the statistical analyses and data interpretation, and drafted the manuscript. D. K. contributed to the study design and data preparation and interpretation. T. R. conceived the project and contributed to the study design and data interpretation.
None of the authors has any conflicts of interest.


