


Iodine is a trace element required for the production of thyroid hormones, which are important for growth and metabolism. Since iodine is obtained from exogenous/dietary sources, it is considered an essential micronutrient, with a daily recommended intake of 120 μg d−1 for school-aged children (6–12 years) and 150 μg d−1 for adolescents and adults(1). Both iodine deficiency and excess can have negative consequences resulting in a range of pathologies which impact thyroid function(Reference Leung and Braverman2,Reference Zimmermann and Boelaert3) . Iodine intake and status, unlike most other important dietary elements, are intimately linked to local geography as low concentrations in water and soil result in iodine deficiency in humans and livestock(Reference Rohner, Zimmermann and Jooste4).
The iodine content of most food sources is typically low, varies widely depending on the origins of the food and will result in low iodine intakes without parallel consumption of iodine-rich foods(Reference Haldimann, Alt and Blanc5,Reference Pennington, Schoen and Salmon6) . Most seafood is rich in iodine but generally provides a limited contribution to dietary consumption unless ingested regularly(Reference Dahl, Johansson and Julshamn7,Reference Julshamn, Dahl and Eckhoff8) . Indeed, seaweed iodine concentrations are typically high(Reference Zimmermann9), and people consuming it may consequently have excessive intake(Reference Nagataki10,Reference Zimmermann and Andersson11) . Moreover, drinking water that has been treated with iodine or water from aquifers in regions with high geological levels of this element can provide additional iodine(Reference Andersen, Guan and Teng12,Reference Henjum, Barikmo and Gjerlaug13) .
In many countries, iodine-fortified salt used for cooking remains a major source of iodine(Reference Zimmermann and Andersson11,Reference Charlton and Skeaff14,Reference Johner, Günther and Remer15) . In addition to iodised salt, milk and dairy products are also important sources of iodine for many(Reference Haldimann, Alt and Blanc5,Reference Caldwell, Makhmudov and Ely16,Reference Murray, Egan and Kim17) , and this is particularly so in the UK, where there is no mandatory iodisation of salt(Reference Bath, Button and Rayman18).
A key challenge to ensuring appropriate population iodine nutrition is the requirement for convenient, accurate and reliable indicators of iodine status. The median urinary iodide concentration (UIC) has long been used as a biomarker for iodine intake in the general population(Reference Zimmermann and Andersson11), the gold standard for which is the assessment of the 24-h UIC or urinary iodide excretion (UIE). This method, however, is logistically challenging, inconvenient and time-consuming. Furthermore, due to significant intra-individual heterogeneity, it cannot be utilised reliably in individuals(Reference Busnardo, Nacamulli and Zambonin19). Other potential markers include serum iodide, thyroglobulin (Tg), thyroid-stimulating hormone (TSH), free triiodothyronine (FT3) and free thyroxine (FT4). These blood markers have a complementary role in iodine nutrition monitoring(Reference Cui, Wang and Chen20,Reference Ma and Skeaff21) ; however, the collection of venous blood is costly and time-consuming for large-scale investigations. A potential alternative marker may be saliva, as it contains easily measurable iodide concentrations(Reference Gates and Work22,Reference Mandel and Mandel23) due to the transport activity of the sodium iodide symporter in salivary glands (NIS or SLC5A5)(Reference Mandel and Mandel23). A key challenge to ensuring appropriate population iodine nutrition is the requirement for convenient, accurate and reliable indicators of iodine status. The median UIC has long been used as a biomarker for iodine intake in the general population(Reference Zimmermann and Andersson11), the gold standard for which is the assessment of the 24-h UIC or UIE. This method, however, is logistically challenging, inconvenient and time-consuming. Furthermore, due to significant intra-individual heterogeneity, it cannot be utilised reliably in individuals(Reference Busnardo, Nacamulli and Zambonin19). Other potential markers include serum iodide, Tg, TSH, FT3 and FT4. These blood markers have a complementary role in iodine nutrition monitoring(Reference Cui, Wang and Chen20,Reference Ma and Skeaff21) ; however, the collection of venous blood is costly and time-consuming for large-scale investigations. A potential alternative marker may be saliva, as it contains easily measurable iodide concentrations(Reference Gates and Work22,Reference Mandel and Mandel23) due to the transport activity of the NIS or SLC5A5(Reference Mandel and Mandel23–Reference De la Vieja and Santisteban26). Saliva sample collection is a convenient, more sanitary and rapid procedure than 24-h urine collection or blood-based biochemical analysis, and previous work has indicated that the salivary iodide concentration (SIC) and UIC are potentially directly related(Reference Zhang, Song and Gao27).
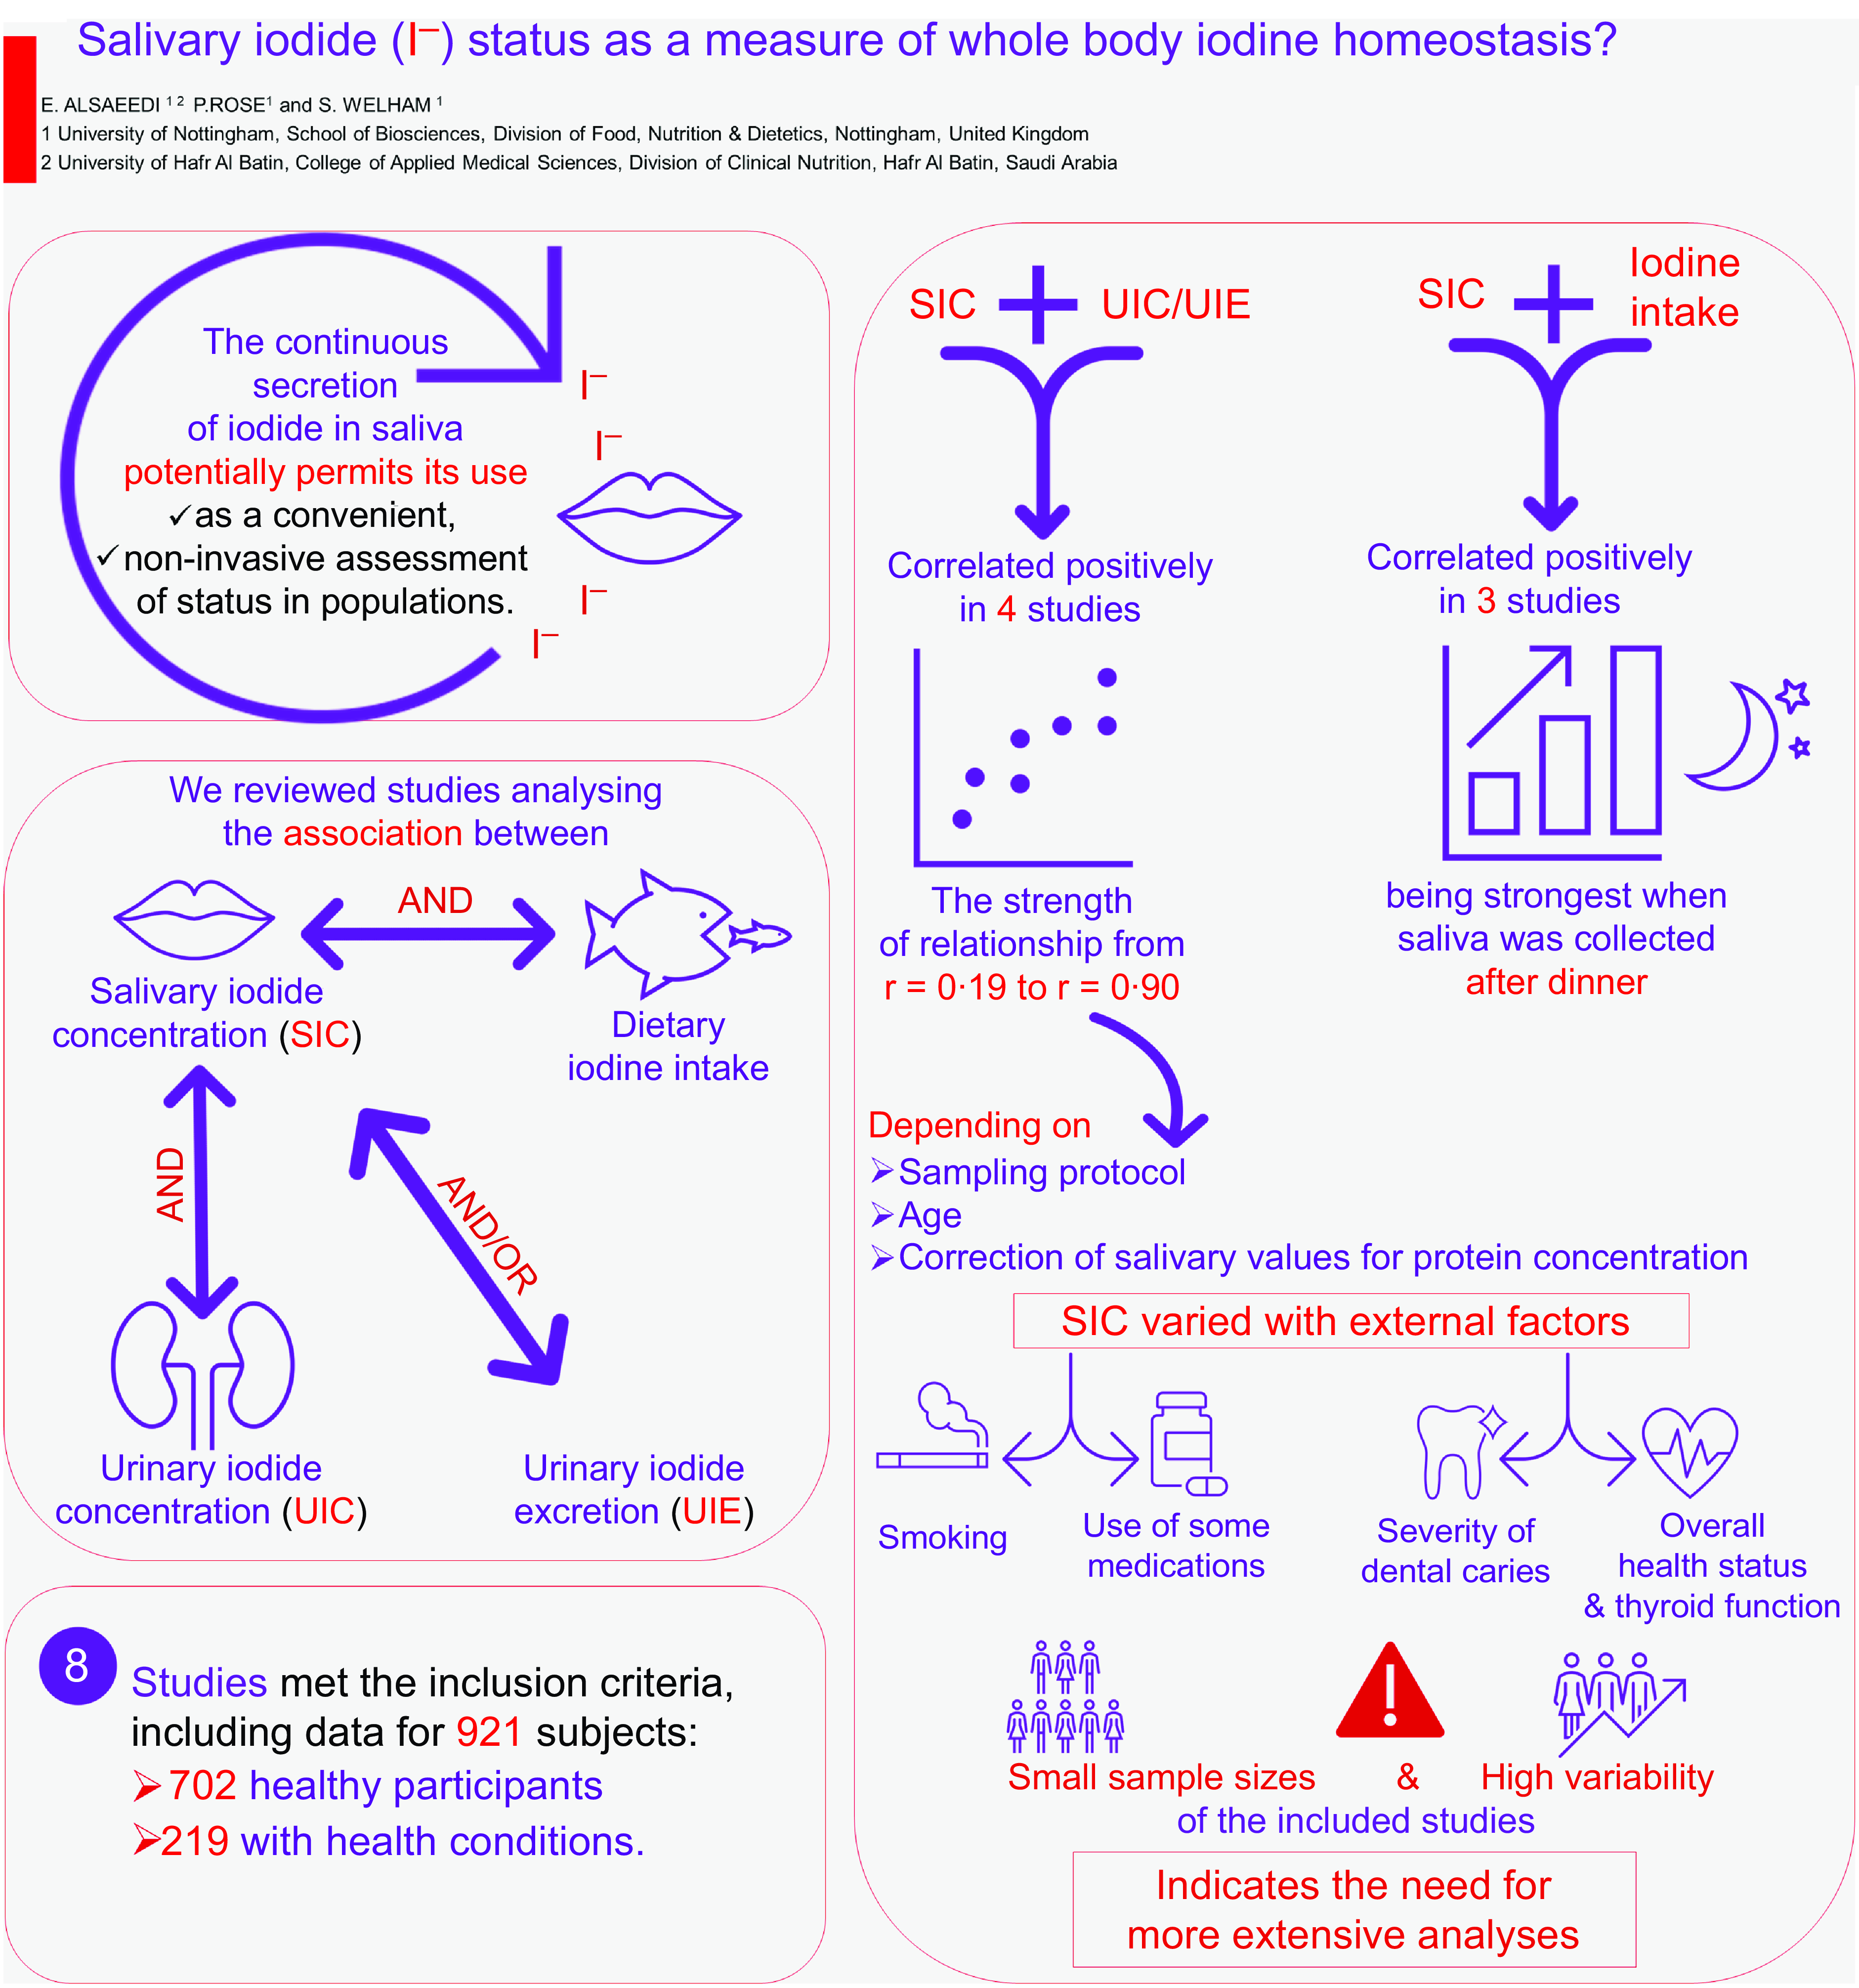
We hypothesised that the concentration of iodide in saliva is positively correlated with UIC and dietary iodine intake. As such, saliva has the potential to be a viable alternative biomarker for determining iodine nutritional status across populations. We therefore conducted a scoping review to systematically map the research conducted in this field and highlight any knowledge gaps that may already exist. The following research questions were addressed:
-
What are the associations between SIC and dietary iodine intake, SIC and UIC, or SIC and 24-h UIE in different population groups?
-
Do the associations between SIC and dietary iodine intake significantly differ from the associations between UIC and/or 24-h UIE and dietary iodine intake?
-
What is the best time to sample saliva?
Methodology
Search strategy
This review was performed according to the most recent checklist of the Preferred Reporting Items for Systematic Reviews and Meta-Analyses Extension for Scoping Reviews (PRISMA-ScR)(Reference Tricco, Lillie and Zarin28). A search strategy was developed to identify studies that analysed the relationship between SIC, dietary iodine intake, and UIC and/or 24-h UIE in different populations to evaluate whether an iodide saliva measurement could represent an appropriate biomarker of iodine status. We additionally included studies which measured diurnal SIC fluctuations and those comparing SIC by health state.
Relevant literature was identified by searching the PubMed, ScienceDirect and Web of Science databases up to 31 August 2023. The terms used during the search process were ‘dietary iodine intake’, ‘salivary iodide concentration’, ‘salivary iodine concentration’, ‘salivary iodide secretion’, ‘salivary iodine secretion’, ‘salivary iodine’, ‘circulating iodide’, ‘circulating iodine’, ‘iodine in saliva’, ‘iodide in saliva’, ‘urinary iodide’, ‘urinary iodine’, ‘urinary iodine concentration’, ‘urinary iodine excretion’, ‘iodine reabsorption’, ‘iodide reabsorption’, ‘iodide accumulation’, ‘iodine accumulation’, ‘iodine in blood’, ‘iodine in the circulation’, ‘iodine in the urine’, ‘iodine level in blood’ and ‘iodine conservation’ linked with Boolean search operators (AND, OR and NOT). The reference lists of original and review articles were also searched to identify relevant articles. The Mendeley reference manager application was used to manage all references and remove duplicates.
Inclusion and exclusion criteria
Studies were included if they met the following criteria: (1) published in the English language; (2) peer-reviewed articles with access to the full text; (3) conducted in human participants regardless of age; (4) conducted in a small or large group across a specific population; (5) reported or not reported dietary iodine intake; and (6) reported SIC, UIC and/or UIE measurements via 24-h urine collection or alternative ways (timed sampling or spot). Studies were excluded if they (1) were published in a language other than English; (2) only the abstract was available; (3) were carried out on animals and (4) did not report SIC.
Article selection and data extraction
Initial screening involved assessment of titles and abstracts where available by the primary author (E.A.) and subsequently rechecked by the other authors (S.W. and P.R.) to ensure accuracy. Studies meeting the eligibility criteria were selected for further evaluation via full-text analysis. Potentially relevant publications lacking an abstract were additionally assessed via full-text analysis. Additional papers were identified by reviewing the full texts. Figure 1 shows the selection process for articles.
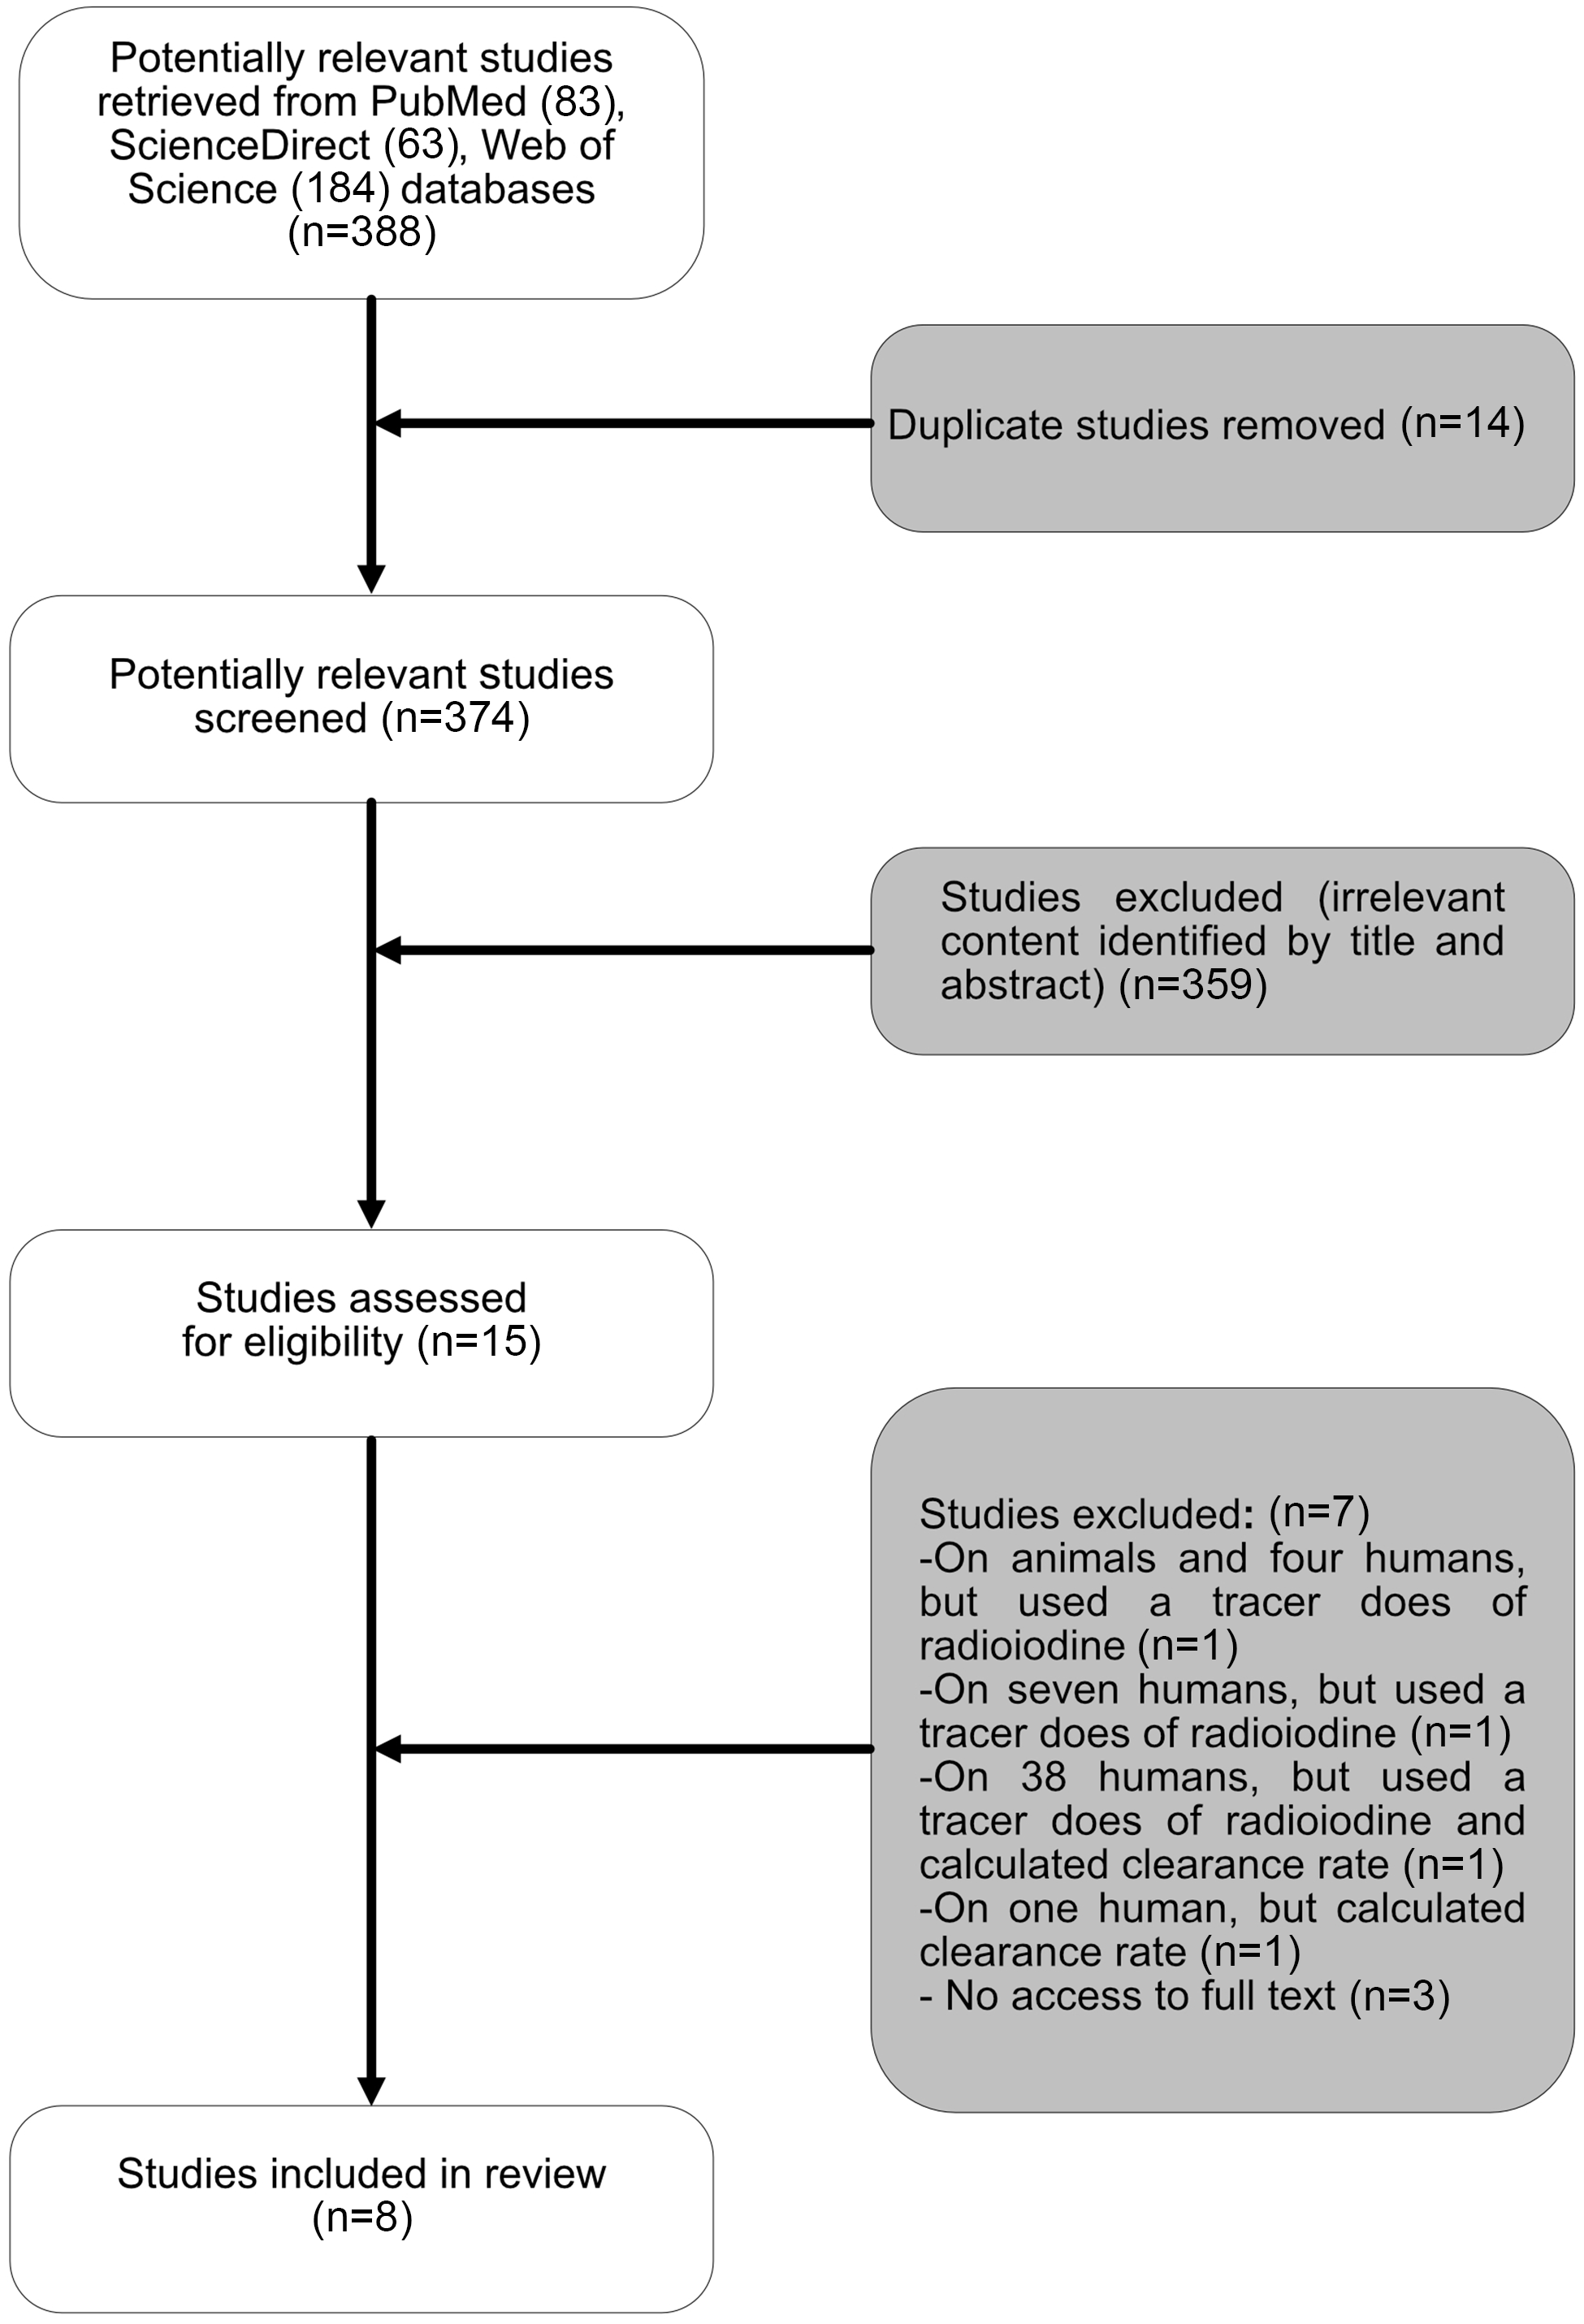
Fig. 1. The flow chart for the process for selecting sources of evidence included in the scoping review.
Study data were extracted and included surname of the first author, publication year, country in which the study was conducted, study design, study period, sample size and type, participants’ age, description of the saliva and urine sampling method, the correlation coefficients between the mean or median SIC (μg l−1) and UIC (μg l−1) or UIE (μg d−1), correlation coefficients between SIC (μg l−1) and dietary iodine intake (μg d−1), correlation coefficients between UIC (μg l−1) or UIE (μg d−1), and dietary iodine intake (μg d−1). Finally, the concentration of iodide in saliva was assessed in individuals with conditions that have, or are believed to have, relevance to iodine status. These included people treated for cardiac arrhythmias with the iodinated drug amiodarone, those treated for thyroid disorders with radio iodide, those with hyperthyroidism and among smokers and people with different levels of dental caries.
Data synthesis and statistics
The extracted data from the included studies underwent synthesis, bringing together findings within the text and tables. To ensure uniformity, units were consistently standardised, with concentrations reported in μg l−1 and daily intakes in μg d−1. Detailed information regarding correlation measurements in each included study, such as the use of Spearman’s and Pearson’s correlations, along with the consideration of a significant P-value, is provided in the footnotes accompanying the tables.
ResultsStudy selection and characteristics
Fifteen studies met the inclusion criteria, of which full text was unavailable for three studies, which were consequently excluded. Four studies were additionally excluded because they used a tracer dose of radioiodine or only calculated salivary iodide clearance rate. Ultimately, eight studies were included in the final review. Five of these studies were conducted in adults(Reference Dekker, Touw and van der Horst-Schrivers29–Reference Vought and London33), two in school-aged children(Reference Guo, Dong and Jin34,Reference Guo, Pan and Zhang35) and one study of mixed age groups (15–60 years)(Reference Tenovuo and Makinen36). Collectively, the eight studies (three from Europe, one from New Zealand, one from the USA, two from China and one from Turkey) included data totalling 921 subjects: 702 healthy participants, ten patients with differentiated thyroid carcinoma (DTC) on a low dietary iodine intake in order to prepare them for radioactive iodine (131I) therapy, thirty-eight patients with hyperthyroidism, ten patients with excessive concentrations of iodide as a result of using amiodarone for more than three months, eighty-seven smokers and seventy-four patients with different levels of dental caries (Table 1).
Table 1. Study characteristics
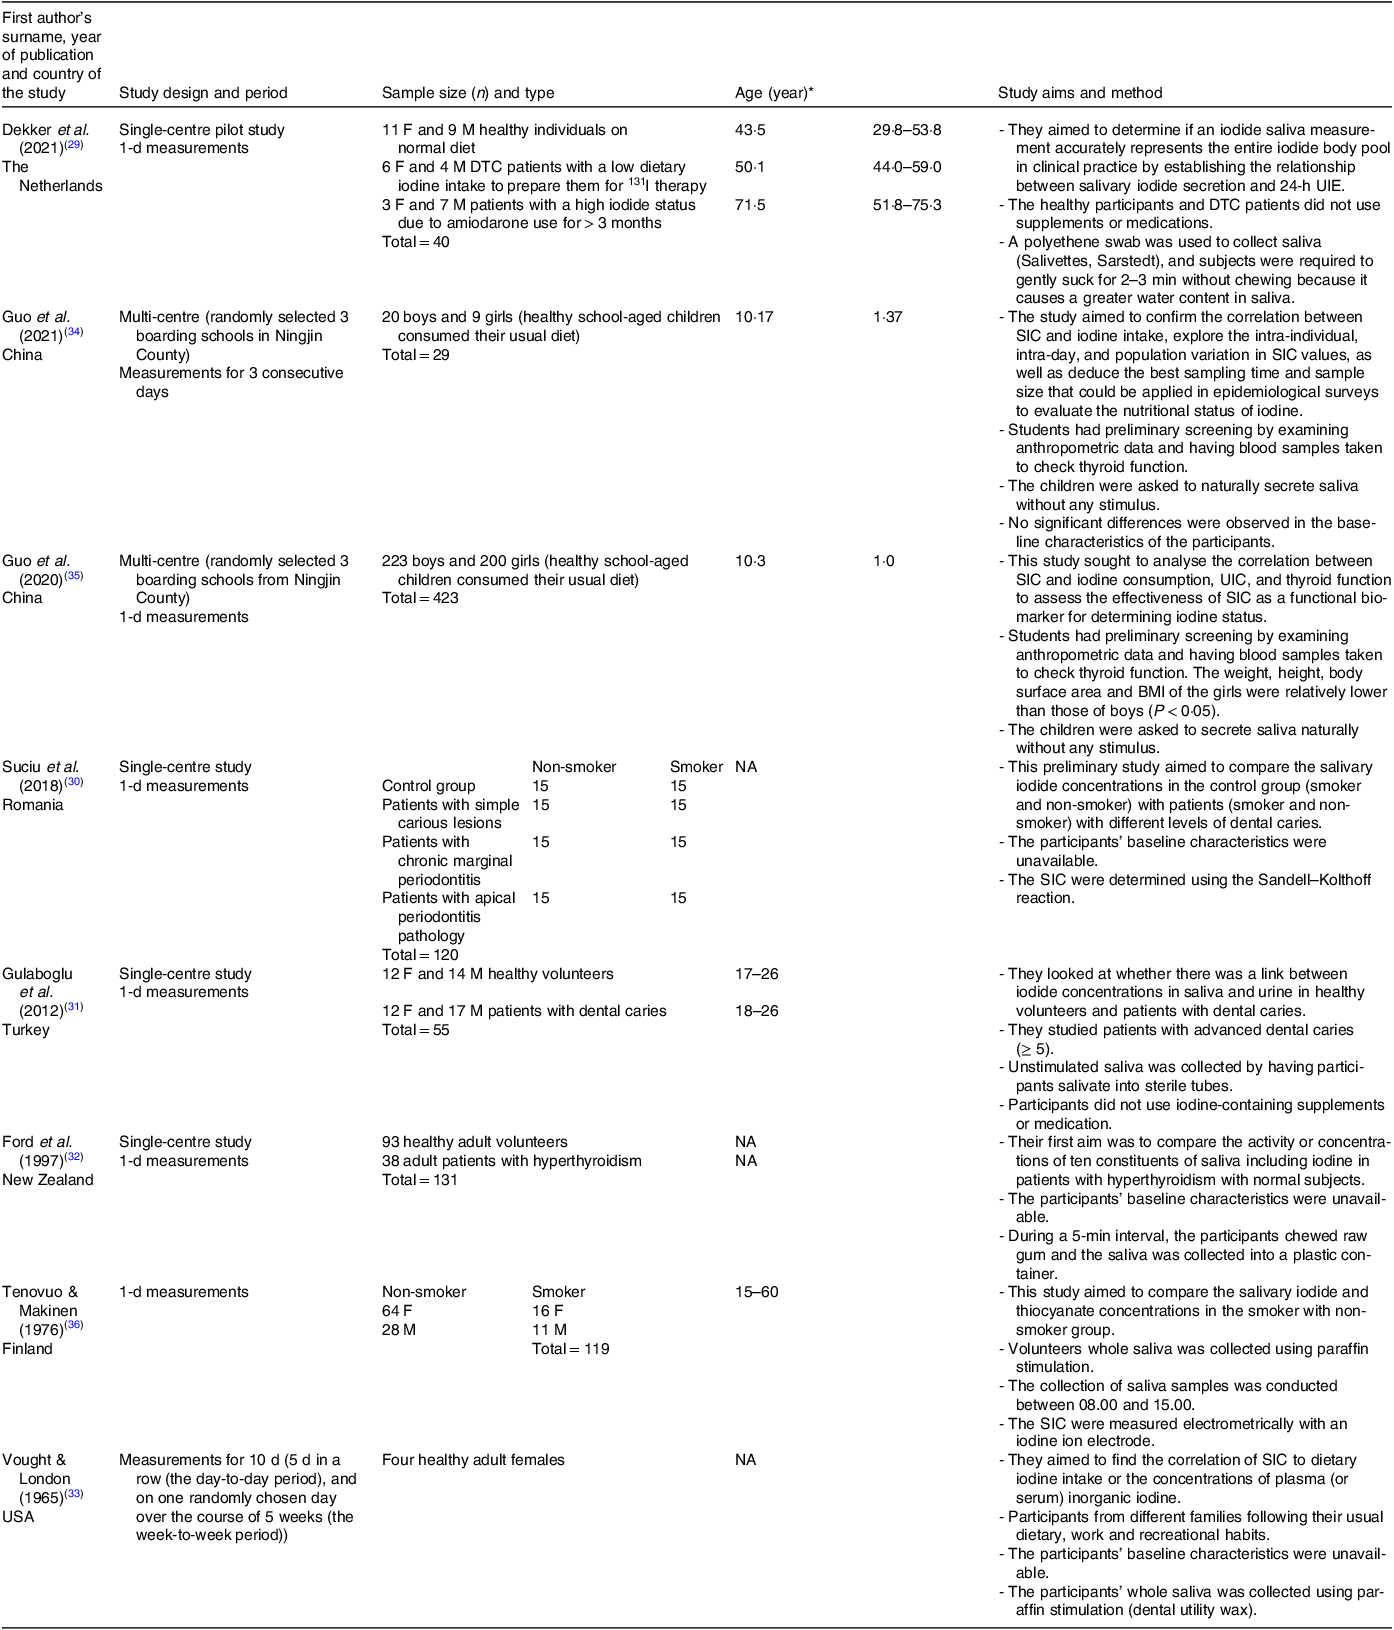
F, females; M, males; DTC, differentiated thyroid carcinoma; 131I, radioactive iodine; NA, not available.
* Data are expressed as range or means and standard deviations or median with interquartile range (IQR) value depending on the study.
SIC and UIC were analysed using inductively coupled plasma mass spectrometry (ICP-MS)(Reference Dekker, Touw and van der Horst-Schrivers29,Reference Guo, Dong and Jin34,Reference Guo, Pan and Zhang35) , the Sandell–Kolthoff reaction method(Reference Suciu, Tarmure and Ionescu30,Reference Gulaboglu, Akgul and Akgul31) , and electrometrically with an iodine sensitive ion electrode(Reference Tenovuo and Makinen36). Data are not available about the method of measurement in two studies(Reference Ford, Johnson and Purdie32,Reference Vought and London33) . Six studies collected samples for 1 d(Reference Dekker, Touw and van der Horst-Schrivers29–Reference Ford, Johnson and Purdie32,Reference Guo, Pan and Zhang35,Reference Tenovuo and Makinen36) , one study collected samples for three consecutive days(Reference Guo, Dong and Jin34) and one study collected for 10 d (5 d in a row (the day-to-day period), and on one randomly chosen day over the course of 5 weeks (the week-to-week period))(Reference Vought and London33).
The collection methods for saliva samples varied among the studies, with all but one providing details on their sampling techniques. In one study, participants were instructed to gently suck on a swab for approximately 3 min(Reference Dekker, Touw and van der Horst-Schrivers29). Three studies required subjects to naturally secrete saliva without any external stimuli(Reference Gulaboglu, Akgul and Akgul31,Reference Guo, Dong and Jin34,Reference Guo, Pan and Zhang35) . Another two studies collected stimulated saliva samples using paraffin stimulation (dental utility wax)(Reference Vought and London33,Reference Tenovuo and Makinen36) , for exactly 4 min(Reference Vought and London33). The last study instructed participants to chew raw gum and collect samples into a plastic container over a 5-min period(Reference Ford, Johnson and Purdie32). Details about the eight studies are provided in Table 1.
In addition to the variation in collection methods, the number of collected samples differed. Saliva samples were collected six times a day (prior to and after the three main meals) over three consecutive days in a recent study by Guo et al. (2021)(Reference Guo, Dong and Jin34), 2 h following breakfast in Gulaboglu et al.’s (2021) study(Reference Gulaboglu, Akgul and Akgul31), at the same time as the collection of 24-h urine samples without determining the number of collected samples in Guo et al.’s (2020) study(Reference Guo, Pan and Zhang35), 2 h after the evening meal over 10 d in Vought & London’s study(Reference Vought and London33), and one time in the period between 08.00 and 15.00 in a study by Tenovuo J & Makinen (1976)(Reference Tenovuo and Makinen36). In another study conducted by Dekker et al. (2021), nine saliva samples were collected at 2-h intervals from healthy volunteers, starting either at 07.00 or 08.00 and concluding at 23.00 or 24.00, with one morning sample from the patient groups(Reference Dekker, Touw and van der Horst-Schrivers29). Therefore, participants’ morning saliva samples were used in the statistical analysis (Tables 2 and 3).
Table 2. The relationship between SIC and UIC and/or UIE
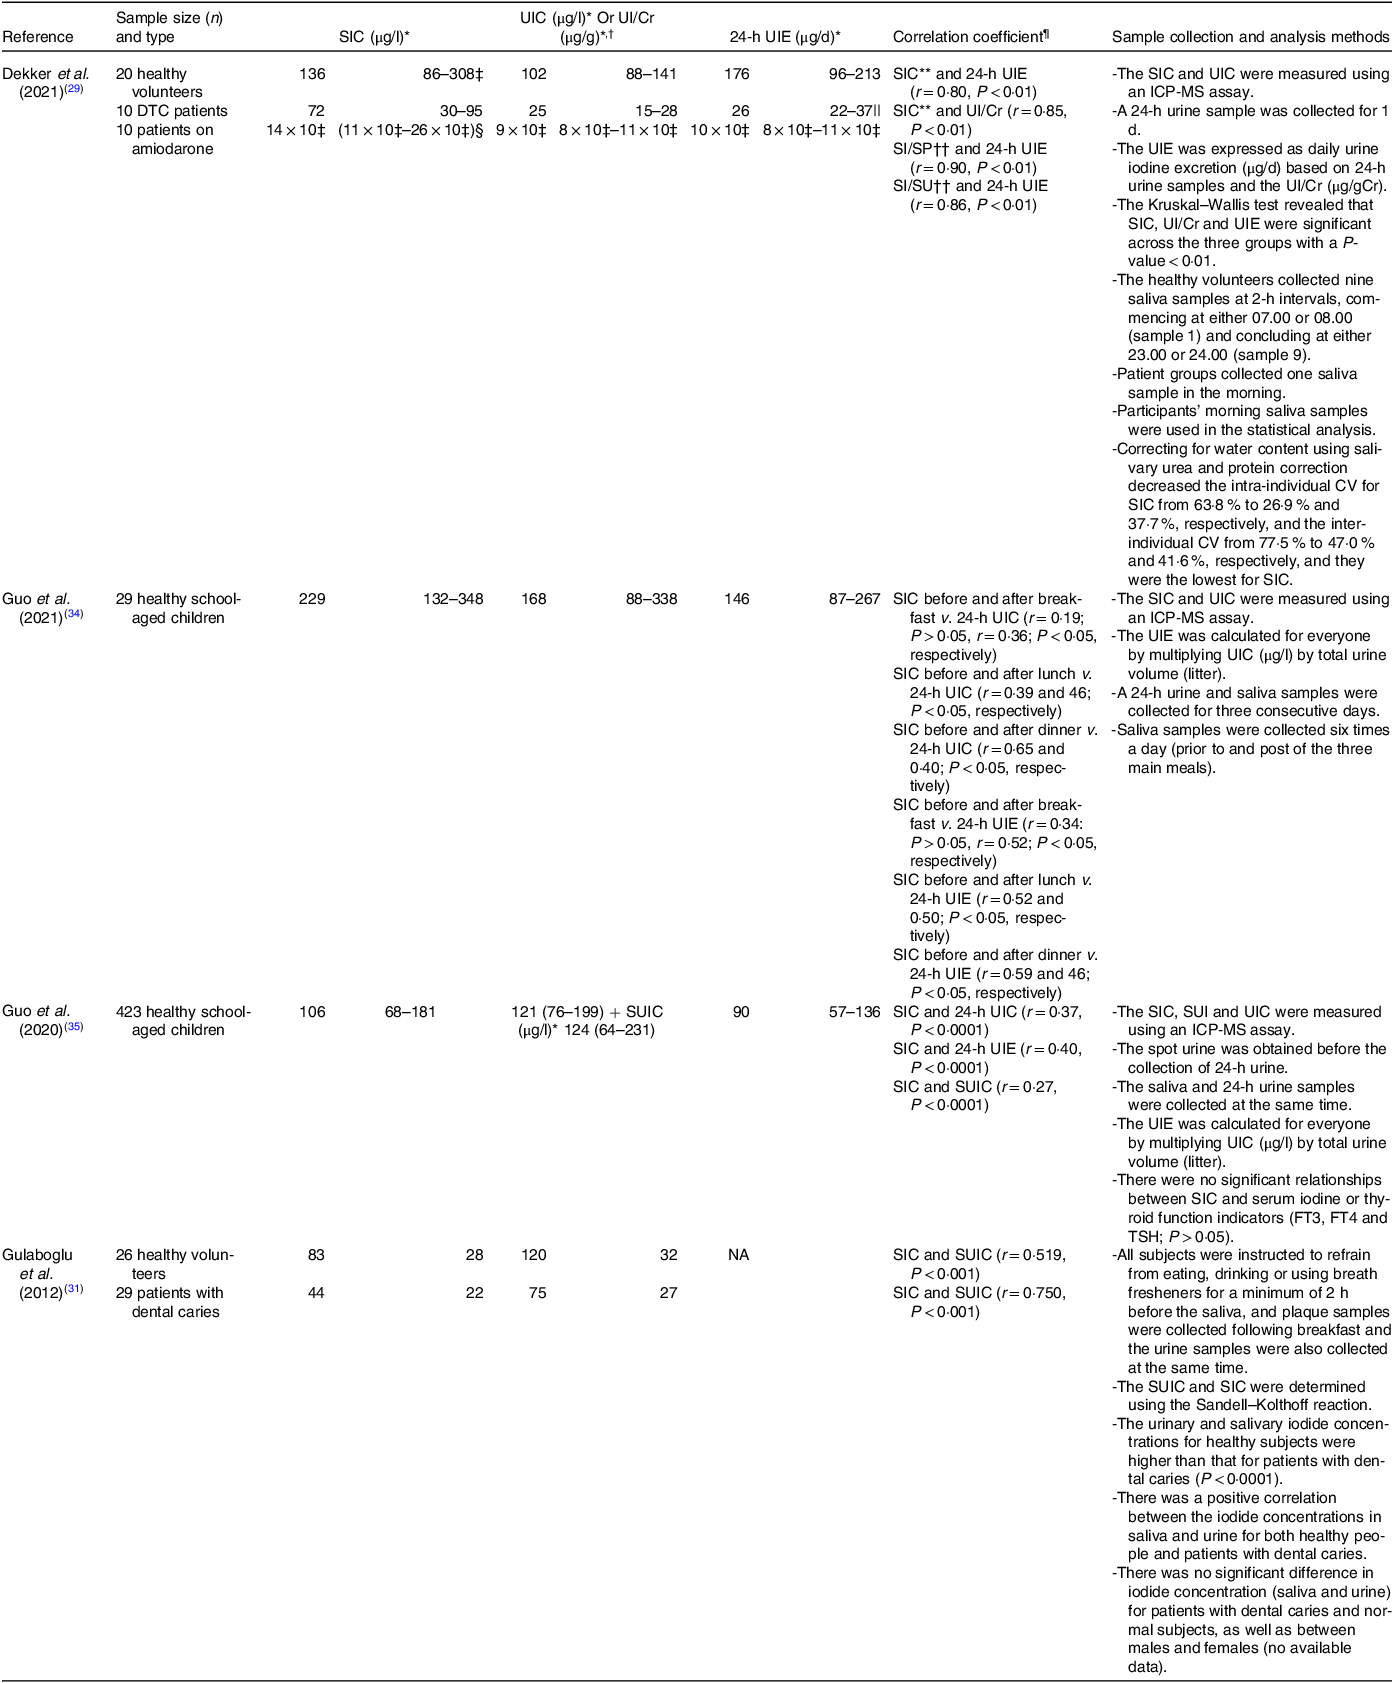
SIC, salivary iodide concentration; UIC, urinary iodide concentration; UIE, urine iodide excretion; DTC, differentiated thyroid carcinoma; UI/Cr, urinary iodide:creatinine ratio; SI/SP, salivary iodide:protein ratio; SI/SU, salivary iodide:urea ratio; ICP-MS, inductively coupled plasma mass spectrometer; SUIC, spot urinary iodide concentration; FT3, free triiodothyronine; FT4, free thyroxine; TSH, thyroid-stimulating hormone; NA, not available.
* Data are expressed as means and standard deviation or median with interquartile range (IQR) value depending on the study.
† UI/Cr.
‡ Two samples were missing: hence, n 18.
§ One sample was missing: hence, n 9.
|| One DTC patient had a total 24-h urine volume < 600 ml: hence, n 9.
¶ Spearman’s correlation was used to establish the correlations between the variables. P < 0·05 was considered significant; except in Gulaboglu et al.’s study (2012), Pearson’s correlation coefficient was used.
** There were four missing samples: hence, n 36.
†† There were twelve missing samples: hence, n 28.
Table 3. The relationship between SIC v. dietary intake of iodine compared with UIC or UIE v. dietary intake of iodine
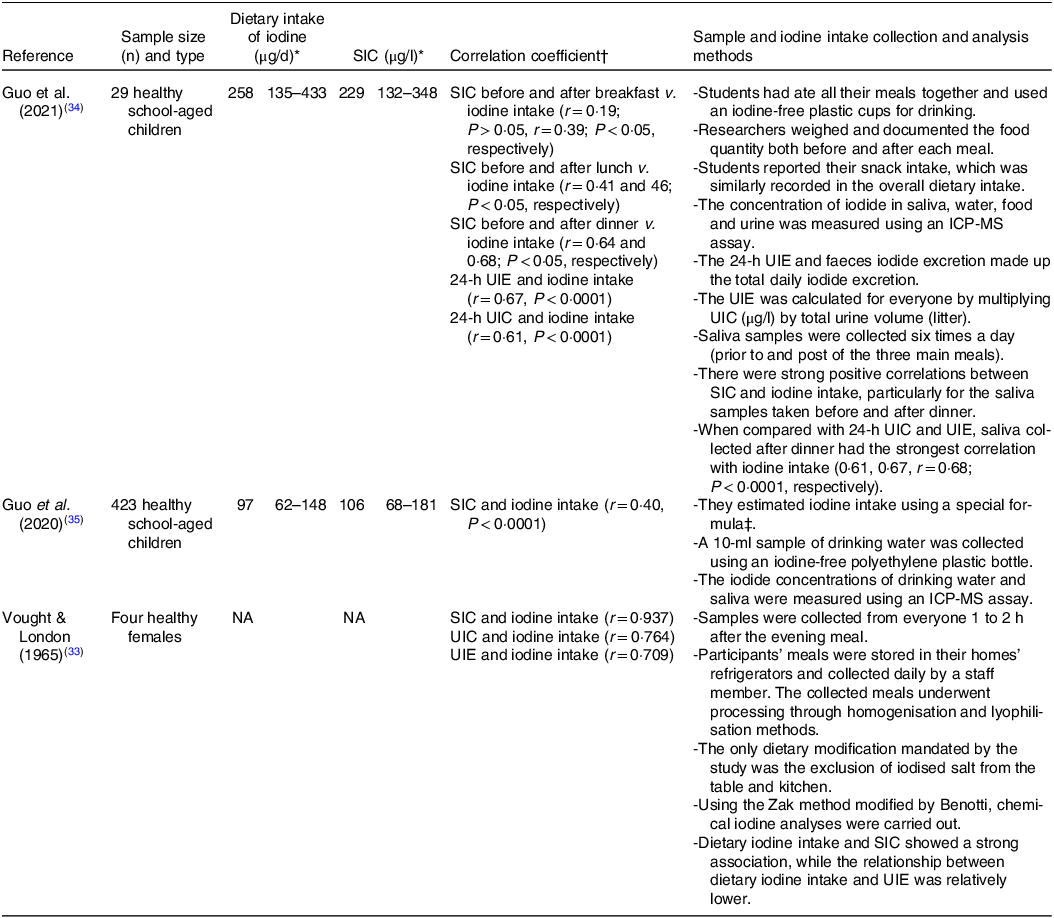
SIC, salivary iodide concentration; UIC, urinary iodide concentration; UIE, urine iodide excretion; ICP-MS, inductively coupled plasma mass spectrometer assay; NA, not available.
* Data are expressed as means and standard deviations or median with interquartile range (IQR) value depending on the study.
† Spearman’s correlation was used to establish the correlations between the variables. P < 0·05 was considered significant.
‡ Daily iodine intake = UIC (μg/l) ÷ 0·92 × (0·0009 l/h/kg × 24-h/d) × weight (kg).
Dietary iodine intakes were assessed in three studies using various methods. In one study, participants’ meals were stored in their home refrigerators and collected daily by a staff member. The collected meals underwent processing through homogenisation and lyophilisation(Reference Vought and London33). The only dietary modification required in this study was the exclusion of iodised salt from the table and kitchen. In another study, involving children, a special formula based on the UIC and body weight was used to estimate iodine intake. A 10-ml sample of drinking water was collected using an iodine-free polyethylene plastic bottle, and the concentration of iodide was measured using ICP-MS(Reference Guo, Pan and Zhang35). A second study with children required collective dining for all meals(Reference Guo, Dong and Jin34). Researchers weighed and documented the food quantity both before and after each meal. Also, students reported their snack intake, which was similarly recorded in the overall dietary intake (Table 3).
Values for dietary iodine intake ranged from 97 μg d−1 to 258 μg d−1. UIC and UIE ranged from 25 μg l−1 to 9 × 10³ μg l−1 and 26 μg d−1 to 10 × 103 μg d−1, respectively. While variation in SIC ranged from 20 μg l−1 to 14 × 103 μg l−1.
Study findings
The relationship between salivary iodide concentration and urinary iodide concentration and/or urinary iodide excretion
SIC were found to correlate positively with UIC and/or UIE in the four studies which measured both parameters (Table 2), with the strength of relationship ranging from r = 0·19 to r = 0·90 depending on sampling protocol, age and if salivary values were corrected for protein concentration. The tightest relationship was seen when 24-h UIE was calculated and associated with saliva collected for 3 min using chewable swabs and corrected for salivary protein(Reference Dekker, Touw and van der Horst-Schrivers29).
The strength of relationship between UIC and SIC was greater for adult groups(Reference Dekker, Touw and van der Horst-Schrivers29,Reference Gulaboglu, Akgul and Akgul31) than for children(Reference Guo, Dong and Jin34,Reference Guo, Pan and Zhang35) . However, in all cases where diet was the only iodine source (i.e. excluding the amiodarone treated group in one study(Reference Dekker, Touw and van der Horst-Schrivers29)), the association between SIC and UIC was generally much stronger for those with urinary concentrations indicative of deficiency (r = 0·75 – r = 0·90; < 100 μg l−1) than for those who appeared replete (r = 0·19 – r = 0·65).
SIC was typically expressed as standalone concentrations, often with correction for urea and protein concentrations (SI/SU (μg mM−1) and SI/SP (μg g−1), respectively). These steps were used to control for differences in water content from inadvertent stimulation of the salivary glands. After correcting for salivary urea and/or protein, the associations observed were even stronger (SI/SU and 24-h UIE, r = 0·86, P < 0·01, SI/SP and 24-h UIE, r = 0·90, P < 0·01(Reference Dekker, Touw and van der Horst-Schrivers29)), and intra-individual (CV for SIC decreased from 63·8 % to 26·9 % and 37·7 %, while inter-individual CV decreased from 77·5 % to 47·0 % and 41·6 %, respectively. Values for CV after correction were also lowest for SIC measurements(Reference Dekker, Touw and van der Horst-Schrivers29).
In addition to variations in the strength of the relationship based on age groups, UIC and correction of saliva samples for protein and urea, the timing of saliva collecting prior to or post the three main meals also played a significant role in shaping the associations between SIC and UIC and/or UIE. A recent study found intriguing patterns in these associations(Reference Guo, Dong and Jin34), specifically that SIC sampled before and after breakfast showed weak and modest correlations with 24-h UIC (r = 0·19, P > 0·05, and r = 0·36, P < 0·05, respectively). In contrast, SIC collected before and after lunch demonstrated stronger correlations with 24-h UIC (r = 0·39, P < 0·05, and r = 0·46, P < 0·05, respectively). The most notable findings were observed in the evening, with SIC before dinner displaying the highest correlations with 24-h UIC (r = 0·65, P < 0·05). These studies reported similar trends in the associations between SIC before and after meals and 24-h UIE, with evening measurements showing the most robust correlations (r = 0·59, P < 0·05). These findings suggest that the relationship between SIC and UIC and/or UIE is likely influenced by meal timing, with evening measurements exhibiting the strongest correlation. These findings emphasise the significance of considering meal-related fluctuations when assessing the reliability of SIC as an indicator of iodine status.
The effectiveness of salivary iodide concentration compared with urinary iodide concentration or urinary iodide excretion as a predictor of dietary iodine intake
The concentrations of iodide in saliva were found to correlate positively with dietary iodine intake in three studies (Table 3). These results were compared with aid correlations between UIC or UIE and dietary iodine intake in the same population group. This comparison was used to assess the accuracy of SIC compared with that of UIC or UIE in reflecting iodine status. Among the studies that assessed the relationships, almost all participants (452 out of 456) were children(Reference Guo, Dong and Jin34,Reference Guo, Pan and Zhang35) , with values for only four adults(Reference Vought and London33).
In the research of Guo et al., conducted on 29 healthy school-aged children(Reference Guo, Dong and Jin34), salivary samples were collected before and after the three main meals over three consecutive days. The strength of correlation between SIC and iodine intake increased over the course of the day with the greatest degree of association being before (r = 0·64, P < 0·05) and after dinner (r = 0·68, P < 0·05). When considering the associations between UIC or UIE v. dietary iodine intake, they also reported similar correlations between 24-h UIE and iodine intake (r = 0·67, P < 0·0001), as well as between 24-h UIC and iodine intake (r = 0·61, P < 0·0001).
In one study on adult participants(Reference Vought and London33), four healthy females collected saliva samples 1–2 h after dinner for 10 d. Similar to the findings of Guo et al.(Reference Guo, Dong and Jin34), the study highlighted a strong and positive correlation between SIC and dietary iodine intake (r = 0·937, P-value = not available) when saliva was sampled during the evening. Furthermore, consistent with these results, strong associations were identified between UIC and iodine intake (r = 0·764, P-value not available) and between UIE and iodine intake (r = 0·709, P-value not available)(Reference Vought and London33). Single samples taken in a larger cohort of children (423) revealed a much weaker, albeit still significant, association between SIC and iodine intake (r = 0·40, P < 0·0001). However, it is unclear when saliva samples were taken, and if the correlation between UIC or UIE v. iodine intake was significantly different(Reference Guo, Pan and Zhang35).
The daily variation in salivary iodide concentration is lower than that of urinary iodide concentration and urinary iodide excretion
Recent nutritional iodine intakes may contribute to the variation in salivary iodide and increase variation in concentrations both across the day and subsequent days. Recent study measured the variation in iodide concentrations in saliva at different times of the day (before and after the three main meals) over 3 d and showed that the mean CV was lowest (67·39 %) before breakfast, increasing later in the day, with the greatest variation in SIC occurred post-dinner, with a mean CV of 104·40 %. Additionally, the researchers observed that the SIC variation was lowest at the person level(Reference Guo, Dong and Jin34). The mean CV within individuals for SIC was 42·73 %, which was less than that of iodine intake (53·12 %), 24-h UIE (49·69 %) and 24-h UIC (47·71 %), respectively. Moreover, the variation in SIC was lower at the population level (71·29 %) than 24-h UIE (72·49 %) and 24-h UIC (100·43 %). By comparison, the mean CV of iodine intake (66·70 %) was somewhat less than that of SIC, UIC or UIE(Reference Guo, Dong and Jin34).
Salivary iodide concentration can vary depending on several factors and is associated with specific health challenges
Iodide concentration in saliva depending on factors like an individual’s iodine intake, thyroid function, use of some medications like potassium iodide, smoking and overall health status. One study reported the effect of a type of medication (amiodarone) and a low-iodine diet (LID) (< 50 μg d1) on SIC, two studies reported the effect of smoking on SIC, while three studies considered the difference between individuals with different health issues and those who are in good health and are summarised in Table 4.
Table 4. Comparison of the SIC in healthy people with those with different statuses
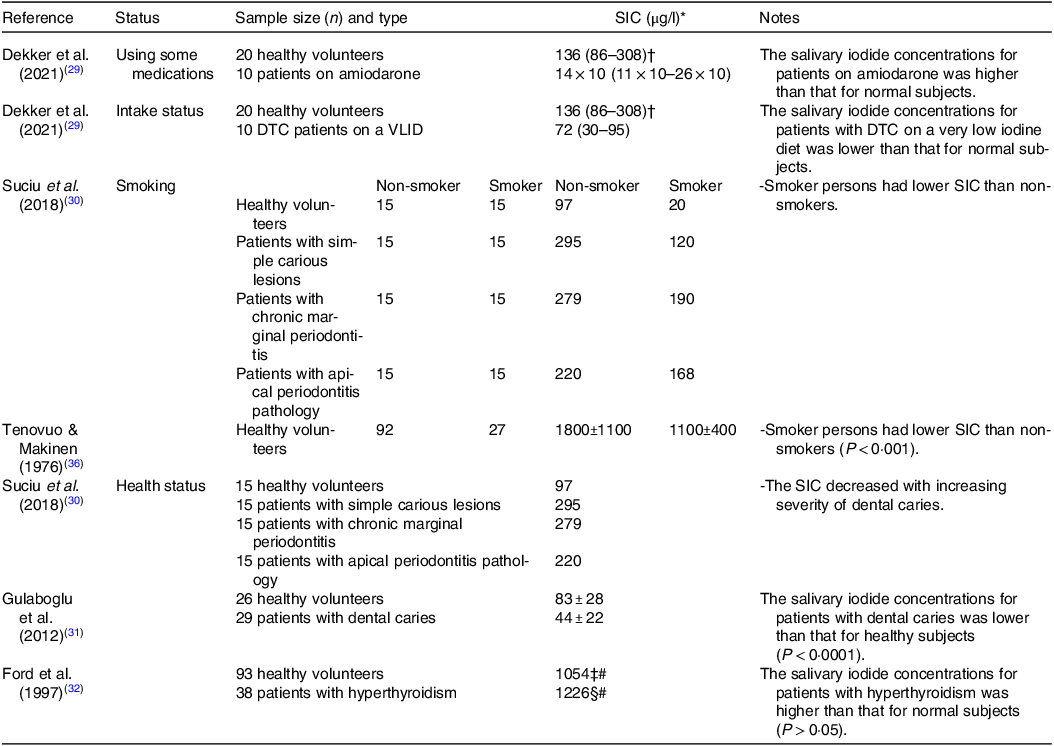
SIC, salivary iodide concentration; DTC, differentiated thyroid carcinoma; VLID, very low iodine diet.
* Data are expressed as means or means and standard deviations or median or median with interquartile range (IQR) value depending on the study.
† Two samples were missing; hence, n 18.
‡ Five samples were missing; hence, n 88.
§ Four samples were missing; hence, n 34.
# These values have converted from µmol/l to µg/l for consistency.
Heart rhythm disorders, such as atrial fibrillation, are treated or prevented using the drug amiodarone(Reference Kennedy, Griffiths and Gray37). A 100 mg of amiodarone tablet contains 250 times the recommended daily iodine requirement for an adult(Reference Basaria and Cooper38). In individuals using amiodarone for more than 3 months (n 10), the median concentration of iodide in patients’ saliva was about 100 times higher than that of healthy (n 20) individuals (14 × 103 μg l−1 and 136 μg l−1, respectively((Reference Dekker, Touw and van der Horst-Schrivers29).
For patients scheduled for DTC radioactive iodine (131I) therapy, a very low iodine diet (< 50 μg d−1) has to be adhered to. Those patients following this diet are reported to have a much lower concentration of salivary iodide (approximately half) than that of healthy volunteers not following any specific iodine reduction diet (72 μg l−1 v. 136 μg l−1, respectively)(Reference Dekker, Touw and van der Horst-Schrivers29).
In addition to iodine restrictive diets, smoking is also reported to influence SIC by increasing the concentration of thiocyanate, a known competitive inhibitor of the NIS, the consequence of which is to decrease salivary iodide (non-smokers healthy volunteers had a substantially higher mean SIC (1800 ± 1100 μg l−1) compared with that of smokers (1100 ± 400 μg l−1))(Reference Tenovuo and Makinen36). These findings further confirmed by a recent work, and researchers have shown that among healthy volunteers, patients with simple carious lesions, patients with chronic marginal periodontitis, and patients with apical periodontitis pathology, that SIC for those who smoked were lower compared with the non-smokers by 80 %, 59 %, 32 % and 24 %, respectively(Reference Suciu, Tarmure and Ionescu30).
Other SIC-modifying conditions include dental caries. In individuals with dental caries, a significant reduction in iodine status as measured by both salivary and urinary concentrations has been reported(Reference Gulaboglu, Akgul and Akgul31). The authors showed that patients with dental caries had a 38 % lower SIC than healthy controls (75 ± 27 μg l−1 v. 120 ± 32 μg l−1, respectively), and this finding is suggestive of reduced iodine status, which was supported by diminished urinary concentrations viz. 47 % lower (44 ± 22 μg l−1 v. 83 ± 28 μg l−1 respectively; P < 0·001). In addition, another study found that the SIC decreased with increasing severity of dental caries(Reference Suciu, Tarmure and Ionescu30). Patients with simple carious lesions had the highest mean SIC values (295 μg l−1) followed by those with chronic marginal periodontitis (279 μg l−1) and patients with apical periodontitis pathology (220 μg l−1). However, the SIC in the control group was the lowest (97 μg l−1) when compared with the patient groups(Reference Suciu, Tarmure and Ionescu30).
Lastly, elevated iodine status as indicated by salivary concentrations was suggested to be associated with hyperthyroidism(Reference Ford, Johnson and Purdie32). Participants with hyperthyroidism (n 38) had numerically higher median concentrations of iodide in their saliva (1226 μg l−1) as compared with normal subjects (n 93; 1054 μg l−1), although the measured differences were not statistically significant, likely due to the low number of participants. However, stimulated salivary flow rate was significantly increased, and this raises the possibility that total salivary iodide secretion may also be influenced.
Discussion
Several studies aimed at the detection of SIC have been conducted(Reference Mello, Barin and Duarte39,Reference Mesko, Costa and Picoloto40) . Interestingly, the salivary glands, like the thyroid, have the capacity to concentrate iodide by virtue of expressing the NIS(Reference Mandel and Mandel23). The epithelium of the parotid gland’s intralobular ducts is the principal place where iodide is transported into saliva(Reference Gates and Work22,Reference Mishkin41) . The iodide is taken from the periductal capillaries, concentrated by the striated duct cells, released into the duct lumen and finally transferred into the oral cavity(Reference Mandel and Mandel23,Reference La Perle, Kim and Hall24) . Its concentration in parotid saliva is higher than in gastric juice under situations of minimal stimulation(Reference HARDEN, Alexander and SHIMMINS42). In this scoping review, we provide the first assessment of articles seeking to establish the usefulness of salivary iodide measurement as an indicator of status. We considered papers which compared the association between SIC and more traditional measures of iodine status, in addition to those assessing the influence of specific treatments and health conditions on SIC.
From the studies considered herein, evidence would suggest that saliva could represent a viable bio-matrix to allow determination of iodine status. This offers an alternative means for the assessment of iodine nutrition status that is non-invasive and rapid and can be collected by people with little clinical experience(Reference Logan, Wallace and Woodside43). Additionally, the consistency in salivary iodide secretion within individuals across multiple days lends further credence to its validity.
An important finding of this review is the positive relationship observed between SIC and UIC/UIE. This correlation was particularly strong in studies involving adults and individuals with UIC indicative of deficiency. This suggests that SIC may serve as a reliable indicator of iodine status, especially in populations at risk of iodine deficiency. Notably, the strength of the relationship was influenced by factors such as age, meal timing and the correction of SIC for salivary protein or urea concentration. In particular, evening measurements of SIC showed the strongest correlation with UIC/UIE, emphasising the importance of considering meal-related fluctuations when using SIC as an iodine biomarker. This insight highlights the need for the development of a standardised set of protocols for saliva collection, to ensure consistency in measurements and to strengthen the validity of SIC as an indicator of iodine status. Furthermore, when comparing the correlations between SIC and dietary iodine intake with UIC/UIE, iodine intakes within the same population groups revealed some interesting patterns. SIC correlated positively with dietary iodine intake, mirroring the relationships observed with UIC/UIE. These findings suggest that SIC may be as informative as UIC/UIE in reflecting iodine nutritional status, in both children and adults. However, it is essential to acknowledge that the strength of the correlations between SIC and iodine intake may vary based on factors like sampling time and age groups, and additional research is warranted.
It is also noteworthy that the specific health conditions can also impact SIC. Amiodarone use, for instance, resulted in substantially elevated SIC, highlighting the impact of medication on SIC. Moreover, individuals with DTC following a LID had significantly lower SIC, indicating the influence of health conditions and dietary restrictions on SIC. Furthermore, dental caries and hyperthyroidism were associated with altered SIC, emphasising the potential of SIC to reflect underlying health challenges.
The ability to reliably assess iodine status using salivary iodide measurement raises the possibility that it could be employed for monitoring patients under specific clinical circumstances. For instance, after complete thyroidectomy, many patients with DTC are provided with 131I therapy to remove any remaining thyroid cancer tissue(Reference Haugen, Alexander and Bible44). A LID(< 50·0 μg/d) is required for a 1–2 weeks prior to therapy to lower the body’s iodide stores and to increase the uptake of administered 131I(Reference Li, He and Bansal45). The status of iodine in these patients is required to determine compliance with the LID and likely dictates efficacy of the intervention. In certain situations, patients may not be eligible for immediate 131I treatment due to their recent exposure to diagnostic imaging involving iodinated contrast agents or the use of medications like amiodarone(Reference Haugen, Alexander and Bible44), which can lead to an excess of iodide in the body. Consequently, rapid and practical measurement of the iodine body pool, such as using saliva samples, can assist clinicians to plan this therapy more effectively. The consistent observation of a strong positive relationship between SIC and UIC/UIE does support the potential utility of SIC as an indicator of iodine status in individuals. However, data are relatively limited, and the effect on SIC of variability in dietary patterns, age, illness, sex, life stage and salivary secretion control have yet to be determined, so its use for individual monitoring may still be some way off.
A lack of iodine might be one of the contributing factors in the formation of dental caries, and this could be a possible explanation for the lower concentrations of iodide in the saliva and urine of patients compared with healthy persons(Reference Gulaboglu, Akgul and Akgul31). Indeed, it is compelling that decreasing SIC correlates with increasing severity of dental caries(Reference Suciu, Tarmure and Ionescu30). This link suggests that iodine, in addition to its importance for thyroid hormone synthesis, may also play a role in maintaining oral health. A research study proposed a hypothesis that highlights the potential significance of iodide in oral and salivary gland health, suggesting its trophic, antioxidant, apoptosis-inducing and assumed antitumour effects as crucial for preventing disorders in these tissues(Reference Venturi and Venturi25).
Iodine-containing antimicrobials, such as the widely adopted povidone-iodine, which may be used as a mouthwash, is very effective in killing bacteria, viruses, and fungi and was recently adopted as a means of controlling severe acute respiratory syndrome coronavirus 2 (SARS-CoV-2) orally(Reference Garcia-Sanchez, Peña-Cardelles and Ordonez-Fernandez46). While it is clear that iodine is the active component responsible for the antimicrobial function, this is mediated by molecular iodine (I2) which can penetrate the microbial cell and oxidise a number of proteins, alongside fatty acids and nucleotides, resulting in cell death(Reference Lepelletier, Maillard and Pozzetto47). Salivary secretions instead release I−, which must be modified to another form (e.g. I2 or HOI) in order to confer antimicrobial function and so indicates that additional biochemical processes must occur in the mouth for the secreted iodide to have an impact. There is, nonetheless, growing evidence to support the idea that a consistent secretion of salivary iodide may act to control oral microbial populations.
The studies described here adopt a range of methods for determining iodine nutritional status. Since > 90 % of ingested iodine is eliminated in the urine, UIC is a popular measure of recent iodine consumption(Reference Zimmermann, Jooste and Pandav48). In large-scale population studies, however, collecting 24-h urine samples is challenging and impractical. Furthermore, it is difficult to be certain about the completeness of urine collection, and there is currently no agreement on the optimal strategy for quality assurance. There are methods to evaluate the completeness of urinary collection, including analysing the recovery of ingested para-aminobenzoic acid, an exogenous marker, in the urine, but this might not be suitable for large population investigations(Reference Ji, Sykes and Paul49). Total urinary volume measurement (volumes less than 300 ml per 24 h are typically regarded as low and a sign of under-collection), self-reporting of incomplete collection and evaluation of urinary creatinine excretion(Reference Barr, Wilder and Caudill50,Reference Haddow, McClain and Palomaki51) are also useful methods but may be prohibitive for larger studies. When utilised alone, none of these techniques provide completely reliable results(Reference Knuiman, Hautvast and Van Der Heyden52); therefore, strict procedures to reduce excessive and inadequate urine collection should be used. In this review, three studies(Reference Dekker, Touw and van der Horst-Schrivers29,Reference Guo, Dong and Jin34,Reference Guo, Pan and Zhang35) collected 24-h urine samples, and only one study measured urinary creatinine(Reference Dekker, Touw and van der Horst-Schrivers29). This lack of quality assurance raises the possibility that the 24-h UIE values obtained from the collection of 24-h urine may be inaccurate.
Spot urine samples are preferable since they are simpler to collect, although iodide concentrations in spot urine samples are greatly variable during the day and throughout the seasons(Reference Moreno-Reyes, Carpentier and Macours53). One study proposed that ten repeat spot urine collections should be utilised to evaluate a person’s iodine status with 20 % precision(Reference König, Andersson and Hotz54). However, obtaining ten samples from an individual can be challenging. In this review, two studies used spot UIC, one collected spot samples before the collection of the 24-h urine(Reference Guo, Pan and Zhang35) and the other collected spot samples 2 h after breakfast(Reference Gulaboglu, Akgul and Akgul31), and they did not comprehensively address the issue of variability in spot UIC over time. A study observed that the strongest correlation between UIC and 24-h UIE was derived from an afternoon spot urine sample(Reference Vanacor, Soares and Manica55). This highlights the significance of selecting an appropriate time frame for spot urine collection in assessing iodine status. The studies described in this review highlight the potential of SIC monitoring for the assessment of iodine status at the population level, using median values as is currently adopted for spot urine samples. Multiple samples would be simpler for participants to collect, thereby diminishing the burden compared with spot urine sample, and would allow more precise estimation of salivary excretion than with single samples alone. It will be interesting to establish whether SIC proves to be an effective tool for monitoring risk of iodine deficiency in populations.
Goitre can be measured via thyroid ultrasonography or neck examination and palpation, and the rate of goitre can indicate long-term iodine status(Reference Zimmermann, Jooste and Pandav48). However, palpation of goitre has poor specificity and sensitivity in regions with a mild iodine deficiency(Reference Zimmermann, Saad and Hess56), and this may require the use of ultrasound to increase the accuracy of the diagnosis. Indeed, the use of ultrasound has been made possible even in distant and resource-constrained places, but the main drawbacks of this method are its cost, the demand for skilled technicians, and a significant degree of inter-user variability in its use and interpretation(Reference Zimmermann and Andersson11). Other indicators that can be used to reflect iodine nutritional status are TSH and Tg(Reference Zimmermann, Jooste and Pandav48). TSH is a relatively insensitive indicator in adults(1), while Tg has been shown to be more reliable when used to assess iodine consumption in children(Reference Zimmermann, Jooste and Pandav48). However, TSH and Tg measurements require blood sampling and processing with the additional challenge of needing to transport as frozen.
Finally, a major limitation of this scoping review is the low number of studies that met the inclusion criteria, and all the included studies differed in terms of their measurement methods and have some weaknesses; therefore, it will be necessary to conduct additional studies before a firm conclusion can be reached.
Conclusion
The current scoping review has identified positive correlations between SIC and UIC and/or UIE, as well as between SIC and dietary iodine intake. The evidence reported suggests that the best time for obtaining saliva samples is either before or after dinner. In addition, the measurement of salivary iodide holds potential benefits for clinical practice, particularly in identifying iodine status among DTC patients undergoing a LID to assess the suitability for receiving 131I therapy. While SIC shows promise as a potential alternative biomarker for iodine status, the inadequate current data on saliva samples as a means of estimating iodide concentration for determining population iodine intake, along with significant variations among published study methods and populations, highlight the need for further investigations. More research is essential to establish a reference range for SIC as an iodine nutrition biomarker, determine the optimal timing and method for saliva sampling, assess the impact of various health conditions on SIC, and elucidate the role of iodide secretion in saliva.
Acknowledgements
We would like to acknowledge the helpful comments provided by Tim Parr on the structure of the manuscript. We would also like to thank the Government of Saudi Arabia and the University of Hafr Al Batin for financial support.
E. A. contributed to study design, conducted the study, analysed data, participated in data interpretation and contributed to writing the article. P. R. contributed to study design, participated in data interpretation and contributed to writing the article. S. W. contributed to study design, participated in data interpretation and contributed to writing the article.
The authors declare none.


 Open access