


Maternal undernutrition during the perinatal period can imprint cardiovascular, renal and metabolic dysfunctions in later life of the offspring( Reference Fowden, Giussani and Forhead 1 ). The intra-uterine programming hypothesis( Reference Barker, Gluckman and Godfrey 2 ) states that early changes induced by a poor intra-uterine environment (e.g. nutritional) permanently affect tissue structure and function( Reference Zandi-Nejad, Luyckx and Brenner 3 ). These might be beneficial changes for the fetus in the short term, leading to increased viability in adverse intra-uterine conditions, but later increase the risk of morbidity. Changes in renal function induced by intra-uterine undernutrition have been reported to be correlated with the development of hypertension during adulthood( Reference Langley-Evans, Welham and Jackson 4 ). These changes include reduction in the number of nephrons( Reference Langley-Evans, Welham and Jackson 4 , Reference Paixão, Maciel and Teles 5 ), increased Na+ reabsorption( Reference Bertram, Trowern and Copin 6 , Reference Manning, Beutler and Knepper 7 ), activation of the systemic and local renin–angiotensin system (RAS)( Reference Langley-Evans and Jackson 8 , Reference Sahajpal and Ashton 9 ) and elevated tissue oxidative stress( Reference Evans, Majid and Eppel 10 , Reference Vieira-Filho, Lara and Silva 11 ). We have demonstrated that intra-uterine programming induced by undernutrition retards nephrogenesis along with decreased levels of angiotensin II (Ang II) in renal cortical cells( Reference Vieira-Filho, Cabral and Santos 12 ) and that α-tocopherol reprogrammes the Ang II-linked regulatory network linked to the renal ouabain-resistant Na+-ATPase affected by placental undernutrition( Reference Vieira-Filho, Lara and Silva 11 ).
Renal proximal tubule Na+ reabsorption plays a central role in the long-term regulation of blood pressure in rats and humans( Reference Roos, Kirchner and Abernethy 13 , Reference Burnier, Biollaz and Magnin 14 ). The recently cloned and purified ouabain-resistant Na+-ATPase( Reference Rocafull, Thomas and del Castillo 15 ) is considered to be responsible for the fine-tuning of proximal tubule Na+ reabsorption in this segment and therefore is critical for the regulation of arterial pressure(16,17). This pump is regulated by many hormones and auto/paracrine hormones, including Ang II( Reference Rangel, Lopes and Lara 18 ). As this peptide seems to be responsible for the regulation of more than 50 % of proximal Na+ transport( Reference Wang, Armando and Upadhyay 19 ), Ang II-modulated ouabain-resistant Na+-ATPase is clearly relevant to alterations in arterial pressure induced during intra-uterine programming. We found that intra-uterine undernutrition programmes a loss of response of this ATPase to physiological concentrations of Ang II in proximal tubule membranes isolated from 90-d-old offspring of dams that were undernourished during gestation( Reference Vieira-Filho, Lara and Silva 11 ). Treatment with α-tocopherol during lactation has also been found to lead to the recovery of a normal response to Ang II( Reference Vieira-Filho, Lara and Silva 11 ). In relation to its response to α-tocopherol, this pump is also affected by reactive oxygen species (ROS)( Reference Bełtowski, Borkowska and Wójcicka 16 ), with Ang II and cyclo-oxygenase 2 (COX-2) in most tissues and organs (including the kidney) playing a central role in their generation and handling( Reference Wolf 20 – Reference Brand, Amann and Schupp 25 ). The rationale for measuring COX-2 expression is thus based on the key role that COX-2-mediated PG-derived products play in the regulation of glomerular filtration rate and renal fluid handling( Reference Ichihara, Imig and Inscho 26 , Reference Flores, Liu and Liu 27 ). COX-2 also participates in the pathogenesis of renal oxidative stress in conjunction with Ang II with parallel up-regulation of NADPH oxidase expression( Reference Green, Gonzalez and Mitchell 23 , Reference Kömhoff, Grone and Klein 28 – Reference Tian, Wong and Leung 31 ).
The introduction of molecular alterations from an early age in prenatally undernourished pups and the mechanisms that culminate in renal injury when hypertension is established during adulthood have not been studied. The correlation of possible modifications in molecular signalling with tension levels during the expected phases of prehypertension, hypertension development and permanently established hypertension remain unclear.
In the present study, we investigated the time course of the development of hypertension in rats programmed by placental undernutrition and explored the development of key markers of renal function during prehypertension and during hypertension development and establishment. We also addressed specific aspects related to the modifications of proximal tubule Na+-ATPase activity and its renal RAS regulatory components during the silent phase that could potentially precede hypertension development. To elucidate the alterations in key renal processes that potentially link RAS to ROS when maternal undernutrition-induced hypertension is established in the adult offspring, we assessed the tissue levels of Ang II and expression of COX-2 and NADPH oxidase and the possible reprogramming of the modifications following the administration of maternal α-tocopherol during lactation.
Experimental methods and materials
Ethical considerations
Experimental procedures were approved by the Committee for Experimental and Animal Ethics at the Federal University of Pernambuco (no. 23076.012671/2008-09) and carried out in accordance with its guidelines related to the Uniform Requirements for Manuscripts Submitted to Biomedical Journals.
Materials
Ang II, α-tocopherol, bovine serum albumin, furosemide, HEPES, EDTA, histone 4B, phenylmethanesulfonyl fluoride, trypsin inhibitor (type IIS), methyl green and 5,5′-dithio-bis-2-nitrobenzoic acid were purchased from Sigma-Aldrich. The creatinine colorimetric assay kit was obtained from Labtest. Calphostin C and the protein kinase A (PKA) inhibitor (PKAi(5–24) peptide) were obtained from Calbiochem/Merck KGaA. Rabbit polyclonal antibodies against Ang II receptors (angiotensin II receptor 1 (AT1R) and angiotensin II receptor 2 (AT2R)), COX-2 and p47phox (regulatory subunit of NADPH oxidase) were purchased from Santa Cruz Biotechnology. Mouse monoclonal antibodies against gp91phox (catalytic subunit of NADPH oxidase) and ED1 (surface macrophage antigen) were also purchased from Santa Cruz Biotechnology. Rabbit polyclonal antibody against Ang II was obtained from Peninsula Laboratories. Horseradish peroxidase-conjugated anti-rabbit and anti-mouse antibodies and the ECL™ Western blot detection reagents were purchased from GE Healthcare Life Biosciences. Anti-rabbit and anti-mouse biotinylated antibodies and the avidin–biotin–peroxidase complex were obtained from Vector Laboratories. Radioactive orthophosphate (32Pi) was obtained from the Brazilian Institute of Energy and Nuclear Research. [γ-32P]ATP was prepared according to the method reported by Maia et al. ( Reference Maia, Gomes, Juliani and Morel 32 ). All other reagents of highest purity were obtained from different suppliers.
Animal groups
Female Wistar rats (aged 90–120 d and weighing 200–250 g) were housed in individual cages at 21°C under a 12 h light–12 h dark cycle, with free access to water and standard chow, and randomly assigned to the experimental groups. Standard chow was given to the control (well-nourished) group of dams (n 14) throughout mating and pregnancy, whereas the undernourished group (n 14) was fed a low-protein multideficient diet (see the Diets subsection). The total food intake of undernourished dams fed this diet was consistently approximately 20 % lesser than the intake of well-nourished females fed the control diet( Reference Vieira-Filho, Lara and Silva 11 , Reference Vieira-Filho, Lara and Silva 33 ). Thus, despite the energy content of both diets being approximately the same, the total energy intake of the undernourished dams was low. Dams (n 7 from the C and U groups) were given daily 1 ml/kg body weight of maize oil by oral administration, the α-tocopherol vehicle, from parturition to weaning, whereas the other dams (n 7 and n 6 from the CT and UT groups, respectively) were given α-tocopherol (350 mg/kg body weight). The dose chosen had previously been shown to restore nephrogenesis( Reference Vieira-Filho, Cabral and Santos 12 ) and Ang II signalling in the proximal tubules of prenatally undernourished rats aged 90 d( Reference Vieira-Filho, Lara and Silva 11 ). The dose was supraphysiological; the control diet provided approximately 10 mg/100 g body mass daily, calculated from the maternal daily food intake per 100 body mass during lactation and the α-tocopherol content of the chow. Besides its protective effect in nephrogenesis( Reference Vieira-Filho, Cabral and Santos 12 ), this dose was chosen aiming to provide a dietary amount of vitamin sufficient to produce antioxidant effects in rats, i.e. to mimic a situation in which ROS are quenched( Reference Franco, Akamine and de Oliveira 34 ). The vitamin was diluted in maize oil, which provided approximately 0·01 mg of total tocopherols/100 g body mass (in 0·1 ml/100 g body mass) per d, a negligible amount when compared with the daily dose of 10 and 350 mg α-tocopherol/100 g body mass given to the C/U and CT/UT groups, respectively.
Litters from both groups of dams were culled to eight pups at birth. Only male offspring were subsequently studied, but some females were kept until weaning (25 d after birth) to ensure that there were eight animals per litter. At 25 d (weaning), the male pups were divided into the following four groups: offspring of control dams maintained on maize oil (C, n 34); offspring of undernourished dams maintained on maize oil (U, n 30); offspring of control dams treated with α-tocopherol (CT, n 43); offspring of undernourished dams treated with α-tocopherol (UT, n 28). After weaning, males in these four groups were randomly designated to different experimental protocols and were killed at 30, 60 and 150 d of age. Some of the offspring were killed by decapitation at 30 d (C, n 11; U, n 9; CT, n 13; and UT, n 8) and 60 d (C, n 12; U, n 13; CT, n 16; and UT, n 13). Proximal tubule membrane preparations obtained from their kidneys were used to measure the activities of Na+-ATPase, protein kinase C (PKC) and PKA and the expression of AT1R and AT2R.
Other animals aged 30, 60 and 150 d (C, n 11; U, n 8; CT, n 14; and UT, n 7) were placed in metabolic cages to measure water balance, food intake, urinary creatinine clearance and proteinuria. After collecting urine for 24 h, a blood sample was immediately collected from the tail vein for creatinine clearance measurement. Before being put into metabolic cages, the animals were allowed to acclimatise for 6 h on three consecutive days. Urinary and serum creatinine levels were quantified using a colorimetric assay kit (Labtest), and urinary protein levels were determined by the Folin phenol method( Reference Lowry, Rosebrough and Farr 35 ), using bovine serum albumin as a standard.
Systolic arterial pressures (SAP) were recorded at different intervals (see the Measurement of blood pressure subsection and Fig. 1) from 60 to 150 d of age. Finally, at 150 d, animals in the four experimental groups were anaesthetised with Na+ pentobarbital (60 mg/kg body weight, intraperitoneally) to determine plasma volume and killed by exsanguination. Their kidneys were sectioned for immunolocalisation of Ang II and ED1 (surface macrophage antigen), and two different classes of whole-kidney homogenates were prepared: one for the measurement of lipid peroxidation and reduced glutathione levels and the other for the immunodetection of COX-2 and the gp91phox catalytic subunit and p47phox regulatory subunit of NADPH oxidase.
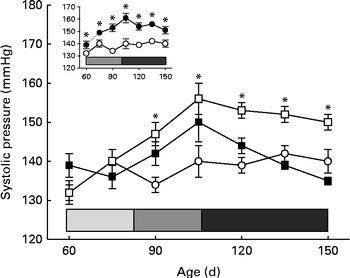
Fig. 1 Development of prenatal undernutrition-induced hypertension in the offspring and influence of α-tocopherol administration to the dams during lactation. Systolic arterial pressure (SAP) measurements in conscious rats were made with tail-cuff plethysmography. The groups of rats were as follows: offspring of control dams (C, n 11); offspring of dams that were undernourished during gestation (U, n 8); offspring of control dams treated with α-tocopherol during lactation (CT, n 14); offspring of dams that were undernourished during gestation and treated with α-tocopherol during lactation (UT, n 7). Main panel: Evolution of arterial pressure in the C (○), U (□) and UT (■) groups. Values are means, with their standard errors represented by vertical bars. * Mean values were significantly different from those of the C group (P< 0·05; two-way ANOVA followed by the Student–Newman–Keuls test). The horizontal bar delimits the phases of prehypertension (![]() ), hypertension development (
), hypertension development (![]() ) and established hypertension (
) and established hypertension (![]() ) in the U group. Inset: Evolution of arterial pressure in the C (○) and CT (●) groups. Values are means, with their standard errors represented by vertical bars. * Mean values were significantly different from those of the C group (P< 0·05; two-way ANOVA followed by Bonferroni test). The horizontal bar delimits the hypertension-development (
) in the U group. Inset: Evolution of arterial pressure in the C (○) and CT (●) groups. Values are means, with their standard errors represented by vertical bars. * Mean values were significantly different from those of the C group (P< 0·05; two-way ANOVA followed by Bonferroni test). The horizontal bar delimits the hypertension-development (![]() ) and established-hypertension (
) and established-hypertension (![]() ) phases in the CT group. The phase of established hypertension in the U and CT groups was defined from the beginning of a plateau (at 105 d) of SAP values that were statistically higher than those recorded in the C group.
) phases in the CT group. The phase of established hypertension in the U and CT groups was defined from the beginning of a plateau (at 105 d) of SAP values that were statistically higher than those recorded in the C group.
Diets
Malnutrition was induced with a low-protein multideficient diet( Reference Teodósio, Lago and Romani 36 ) mimicking those used in impoverished regions with high rates of undernutrition worldwide. We aimed to induce deficiency to investigate its impact on Na+-ATPase activity, on its related Ang II-linked regulatory pathways and on associated processes that, together with Ang II, affect redox balance and intrarenal blood circulation with possible establishment of hypertension. This diet was initially prepared according to data obtained from the food consumption surveys of 918 families (5939 persons) in three physiographic zones of Pernambuco State (Brazil), which mimics basic food patterns in many underdeveloped and developing countries worldwide( Reference Teodósio, Lago and Romani 36 ). Similar basic food patterns have been found in more than thirty countries in Near and Middle East, Central and South America( Reference Teodósio, Lago and Romani 36 ). The ingredients of the diet (% w/w) were beans (Phaseolus vulgaris, brown beans, 18·3), manioc flour (64·8), jerked meat (3·7) and sweet potato (12·8). The average amounts of major nutrients (% w/w) measured in three different chow samples chosen at random during the present study were as follows: protein, 9; carbohydrate, 80; lipid, 2. Na+ content ranged between 5·6 and 6·5 mmol/100 g. The total energy of the diet was 1548 kJ/100 g dry weight. The nutrient content of the control diet was as follows (% w/w): protein, 23; carbohydrate, 44; lipid, 5. Na+ content averaged 5·2 mmol/100 g. The total energy of the control diet was 1,477 kJ/100 g dry weight.
Adequacy in terms of energy was comparable to the control diet (approximately 1500 kJ/100 g), but only a small fraction was from fats (30 kJ/100 g against 340 kJ/100 g in the control diet). Besides the accentuated global protein restriction (8 g% against 23 g%), the diet consumed by the populations initially investigated was also deficient in protein (>90 % was provided by beans and roots and < 10 % by meat) and contained high amounts of carbohydrates from the manioc flour and sweet potato commonly used by these populations. For these reasons, this diet is referred to as a low-protein multideficient diet.
Measurement of blood pressure
The development of SAP in conscious rats was assessed at different ages using tail-cuff plethysmography (IITC Life Science B60-7/16”; Life Science Instruments). Before acquiring SAP data, the animals were trained in a heated container at 32°C for three consecutive days to adapt them to the experimental procedures. SAP was measured between 09.00 and 15.00 hours. To avoid circadian variations, one rat was selected at random from each group for the first set of pressure measurements. As there were four groups, this takes about 70–75 min. Another rat from each group was selected at random over 70–75 min, etc. until the pressure in all rats was measured. The four rounds usually finished at about 15.00 hours. This ensured that each group had one rat tested in the same interval of 70–75 min as all the others. Based on the manufacturer's guideline, the same tail-cuff size was used throughout the investigation, and data obtained for each day were an average of three to five consecutive measurements.
Measurement of plasma volume
Plasma volume was measured in offspring rats at 150 d using the Evans Blue dye, as described previously( Reference Cardoso, Cabral and Vieira-Filho 37 ).
Estimation of lipid peroxidation and reduced glutathione levels in kidneys
Lipid peroxidation in the membranes of kidneys was estimated by measuring the levels of thiobarbituric acid-reactive substances (TBARS)( Reference Buege and Aust 38 ) in the second class of whole homogenates. Following sampling for plasma volume measurement at 150 d, the rats were killed and the renal hilar region was sliced for the immunolocalisation of Ang II- and ED1-positive cells, and the upper parts of the left kidneys were homogenised in 150 mm-KCl (1 g tissue: 5 ml solution). About half of each homogenate was immediately used for the measurement of TBARS levels( Reference Vieira-Filho, Cabral and Santos 12 ), with butanol being used as the extraction solvent. A standard curve was obtained using 1,1,3,3-tetraethoxypropane.
The levels of the reduced form of glutathione were quantified by measuring the levels of non-protein sulfhydryl groups in the homogenates as per the method of Sedlak & Lindsay( Reference Sedlak and Lindsay 39 ), with slight modifications. The other half of each homogenate was mixed with an equal volume of 10 % (w/v) TCA to precipitate proteins, which were centrifuged at 1000 g for 10 min. Sequentially, 1 ml of the supernatant was mixed with 1·5 ml of a reaction medium containing 100 mm-Tris (pH 8·9) and 0·4 mm-5,5′-dithio-bis-2-nitrobenzoic acid. The samples were incubated at room temperature for 5 min, and the absorbance was measured at 412 nm. The results were compared with a standard curve using α-cysteine and corrected for the protein content of the initial homogenates.
Preparation of whole-kidney homogenates for immunodetection of cyclo-oxygenase 2 and NADPH oxidase in rats at 150 d
After collecting the hilar transverse slices for immunolocalisation, the remaining renal tissue was minced on ice in 250 mm-sucrose, 10 mm-HEPES–Tris (pH 7·4), 2 mm-EDTA, 0·15 mg/l trypsin inhibitor (type IIS) and 1 mm-phenylmethanesulfonyl fluoride (1 g tissue: 4 ml solution). The suspension was homogenised at 1200 rpm for 1 min using a Potter Elvehjem homogeniser with a Teflon pestle. Aliquots were stored at − 20°C and thawed only once before assay. The total protein content of each homogenate was measured by the Folin phenol reagent method( Reference Lowry, Rosebrough and Farr 35 ).
Isolation of proximal tubule cell membranes
Purified plasma membrane preparations and controls for residual contamination of intracellular membranes were obtained as described previously( Reference Vieira-Filho, Lara and Silva 11 , Reference Vieira-Filho, Lara and Silva 33 , Reference Vieyra, Nachbin and de Dios-Abad 40 ), using male offspring at 30 and 60 d. Only the outer cortex (cortex corticis) was used, as >90 % of the cell population in this region corresponds to proximal tubules( Reference Proverbio and Del Castillo 41 ). The protein content of the preparations was measured as described above( Reference Lowry, Rosebrough and Farr 35 ).
Measurement of ouabain-resistant Na+-ATPase activity
Ouabain-resistant furosemide-sensitive Na+-ATPase activity in the renal membranes was quantified by the difference between the inorganic phosphates released from ATP in the absence and presence of 2 mm-furosemide, as described elsewhere( Reference Vieira-Filho, Lara and Silva 11 ), except that unlabelled ATP was used. Enzyme activity was measured in the absence (basal activity) and presence of 10− 12 m-Ang II. The stimulatory effect of Ang II on the ouabain-resistant Na+-ATPase is mediated by an AT1R → phospholipase Cβ (PLCβ) → PKC signalling pathway, all components of which are present in purified plasma membranes from proximal tubule cells( Reference Rangel, Lopes and Lara 18 , Reference Lara, Correa and Lavelle 42 ). The preservation of these components in the isolated membranes allows investigation of the response of the pump to Ang II in vitro after different treatments or conditions in vivo ( Reference Vieira-Filho, Lara and Silva 11 , Reference Luzardo, Silva and Einicker-Lamas 43 ).
Determination of protein kinase C and protein kinase A activities
Protein kinase activities were measured by the incorporation of the γ-phosphoryl group of [γ-32P]ATP (approximately 1 MBq/nmol) into histone 4B in the presence and absence of the specific PKC and PKA inhibitors( Reference Vieira-Filho, Lara and Silva 11 , Reference Cabral, Wengert and da Ressurreição 44 ). Radioactivity incorporated into the histone was quantified by liquid scintillation.
SDS-PAGE and Western blotting
Ang II receptors and COX-2 and NADPH oxidase subunits were immunodetected in the isolated renal membranes (AT1R and AT2R) or whole-kidney homogenates (COX-2 and NADPH oxidase subunits) using their specific antibodies after separation of the proteins by SDS-PAGE (10 %). Proteins were transferred onto nitrocellulose membranes at 350 mA. Non-specific binding prevention and washing procedures followed were as those reported by Vieira-Filho et al. ( Reference Vieira-Filho, Lara and Silva 11 ).
For immunoblotting of AT1R and AT2R, protein samples were separated by SDS-PAGE, successively probed with the corresponding primary antibodies (1:500 dilution) and secondary antibodies (1:2500 dilution), and visualised using a chemiluminescence kit (ECL™ Western blotting system)( Reference Axelband, Dias and Miranda 45 ). The antibody dilutions used for immunoblotting of COX-2 were 1:500 (primary) and 1:2500 (secondary), whereas those used for immunoblotting of the NADPH oxidase subunits were 1:200 and 1:1000, respectively; more details are given in the legends of Figs. 3, 6 and 7. Densitometric analyses were carried out using Scion Image for Windows Alpha 4.0.3.2 (Scion Corporation), available at www.scionCorporation.com at the time the study was carried out. Protein expression was normalised to protein load using Ponceau Red staining, giving the same accuracy as β-actin( Reference Luzardo, Silva and Einicker-Lamas 43 ).
Immunohistochemistry
Hilar transverse slices of kidneys collected at 150 d were used for the immunolocalisation of Ang II- and ED1-positive cells, as described by Cabral et al. ( Reference Cabral, Vieira-Filho and Silva 46 ); more details are given in the legends of Figs. 5 and 9.
Statistical analysis
Data are presented as means with their standard errors. Differences between the experimental groups were assessed as described in the figure legends after confirming normal distribution using the Kolmogorov–Smirnov test. Depending on the experimental design, the hypothesis to be tested, the parameter to be investigated and the distribution of the data, we used two-way ANOVA followed by Bonferroni, one-way ANOVA followed by Student–Newman–Keuls, unpaired Student's t or one-sample t test, as indicated in the corresponding table and figure legends. Differences were considered significant at P< 0·05.
The determination of Na+-ATPase, PKC and PKA activities was carried out in triplicate; for blood pressure, recordings were obtained at three to five consecutive time points. Standard deviations of each set of experiments were divided by the mean of the set and multiplied by 100 to calculate the intra-assay CV. Finally, we calculated the mean CV percentage to check intra-assay reproducibility, which gave a value < 10 % for all parameters in the four experimental groups.
Results
Development of hypertension in the offspring of prenatally undernourished dams: beneficial and harmful effects of α-tocopherol administered during lactation
The offspring of undernourished dams had lower birth weights than the control group (5·0 (sem 0·1) (n 58) v. 6·4 (sem 0·1) g (n 77); P< 0·001), but all groups had similar arterial pressure until 60 d of age (Fig. 1). Nevertheless, after a period of prehypertension during young age, when their tension levels were similar to those of the control group (Fig. 1, main panel, light grey portion of the horizontal bar), the offspring of undernourished dams entered a phase characterised by hypertension development until a stage of well-established and persistently elevated SAP levels (at 90 d). The offspring of undernourished dams that received α-tocopherol throughout lactation had normal pressure, which remained so throughout adulthood (as far as investigated). Although α-tocopherol normalised blood pressure in the prenatally malnourished group, this was not the case when the vitamin was administered to well-nourished dams (Fig. 1, inset). Their offspring entered an earlier phase in which systolic pressure increased (compare the length of the light grey horizontal bar), reaching a stable state of hypertension throughout adulthood.
Main general and renal parameters during the prehypertensive, hypertension-development and established-hypertension phases
At 30 d, the four offspring groups (C, U, CT and UT) had normal body weights. Their food and water intake, haematocrit and major renal parameters (urinary flow, proteinuria and creatinine clearance) were similar and within the normal range (Supplementary Table S1, available online). The profiles of rats at 60 d remained similar in all four groups, with the usual growth-dependent variations in body weight, food and water intake, and urinary output (Supplementary Table S2, available online). This normal picture persisted till 90 d of age (Supplementary Table S3, available online); i.e. it was preserved during the hypertension-development period in the U and CT groups (Fig. 1).
Table 1 demonstrates that neither the renal mass nor the renal mass:body mass ratio was modified in the adult offspring of undernourished dams. The preserved renal mass, however, corresponds to kidneys with an abnormal structure already detected at 25–30 d of age( Reference Paixão, Maciel and Teles 5 , Reference Vieira-Filho, Cabral and Santos 12 , Reference Lucas, Costa Silva and Miraglia 47 ), which certainly constitutes the basis for the abnormal functions found at 150 d (Table 1). The normal renal picture in the prehypertensive and hypertension-development phases changed critically during the established-hypertension phase in the U group (Table 1). At 150 d, this group had significantly decreased creatinine clearance, accompanied by an expanded plasma volume. These alterations were, respectively, totally and partially suppressed in the offspring of undernourished dams that received α-tocopherol (UT). The CT group that exhibited identical changes in creatinine clearance and plasma volume compared with the U group also had an increased kidney weight at the end of the established-hypertensive phase (Table 1 and Fig. 1).
Table 1 General parameters of adult offspring in the established-hypertension phase (150 d of age) (Mean values with their standard errors)
C, offspring of control dams; U, offspring of dams that were undernourished during gestation; CT, offspring of control dams treated with α-tocopherol during lactation; UT, offspring of dams that were undernourished during gestation and treated with α-tocopherol during lactation; BW, body weight.
a,b,cMean values within a row with unlike superscript letters were significantly different (P< 0·05; two-way ANOVA followed by Bonferroni test).
Alterations in the proximal tubule ouabain-resistant Na+-ATPase activity and in components of the angiotensin II-linked signalling pathways during the prehypertensive phase
The main remarkable features regarding the effect of prenatal undernutrition on the proximal tubule Na+-ATPase activity of offspring during the prehypertensive phase (before 60 d; Fig. 2(A) and (B)) were up-regulation of basal (unstimulated) activity, loss of normal sensitivity towards Ang II and recovery of the control profile after the administration of α-tocopherol to the dams during lactation. No differences were found between the C and CT groups.
Fig. 2 Activity of ouabain-resistant furosemide-sensitive Na+-ATPase in renal proximal tubules of the prenatally undernourished group during the prehypertensive phase: effect of maternal α-tocopherol during lactation. The groups of rats were as follows: offspring of control dams (C, n 11); offspring of dams that were undernourished during gestation (U, n 8); offspring of control dams treated with α-tocopherol during lactation (CT, n 14); offspring of dams that were undernourished during gestation and treated with α-tocopherol during lactation (UT, n 7). □, Unstimulated (basal) Na+-ATPase activity. ■, Na+-ATPase activity in the presence of 10− 12 m-angiotensin II (Ang II). Rats at 30 d (A) and 60 d (B) of age. Values are means of five to eight triplicate assays using different membrane preparations, with their standard errors represented by vertical bars. * Mean value was significantly different from that of the corresponding age-matched C group (P< 0·05; two-way ANOVA followed by Bonferroni test). † Mean value was significantly different from the corresponding non-stimulated (no Ang II) mean value (P< 0·05; unpaired Student's t test).
During this phase, which was silent in terms of SAP, changes in AT2R expression in proximal tubule membranes were detected only in the U and CT groups in 60-d-old rats (Fig. 3). The changes were mirror images: decreased in the U group but increased to an equivalent degree in the CT group (Fig. 3(D)). Maternal α-tocopherol totally restored the AT2R levels in the prenatally undernourished rats (UT).
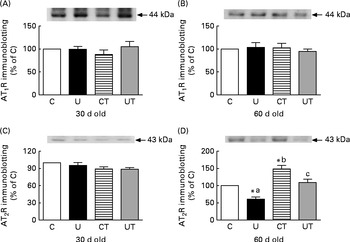
Fig. 3 Expression of ((A) and (B)) type 1 and ((C) and (D)) type 2 angiotensin II receptors (AT1R and AT2R) in renal proximal tubule cell membranes of rats aged 30 or 60 d. The groups of rats were as follows: offspring of control dams (C, n 11); offspring of dams that were undernourished during gestation (U, n 8); offspring of control dams treated with α-tocopherol during lactation (CT, n 14); offspring of dams that were undernourished during gestation and treated with α-tocopherol during lactation (UT, n 7). The upper part of each panel shows a representative immunodetection in a single gel. Each lower graph corresponds to densitometric data presented as means of three to five determinations made using different membrane preparations, with their standard errors represented by vertical bars. * Mean value was significantly different from that of the C group (P< 0·05; one-sample t test). a,b,cMean values with unlike letters were significantly different (P< 0·05; one-way ANOVA followed by the Student–Newman–Keuls test).
With respect to the two protein kinase activities functionally linked to the renal Na+-ATPase activity via Ang II receptors( Reference Rangel, Lopes and Lara 18 , Reference Lara, Vives and Correa 48 ), the effect of undernutrition and the response to α-tocopherol varied with time and differed in some respects depending on which kinase was being considered. The UT and CT groups exhibited similar up-regulation of PKC activity due to the influence of undernutrition (Fig. 4(A)). At the end of the prehypertensive phase, there was a huge increase in PKC activity (Fig. 4(B)). PKA activity was strongly decreased in the U group at 30 d, and the levels returned to control values in the UT group (Fig. 4(C)). At 60 d, the activity of this kinase was up-regulated to the same level in both the placentally undernourished U group (without α-tocopherol treatment) and the well-nourished group of offspring of dams that received the vitamin (CT). Conversely, α-tocopherol almost completely restored the control activity in prenatally undernourished rats (Fig. 4(D)).
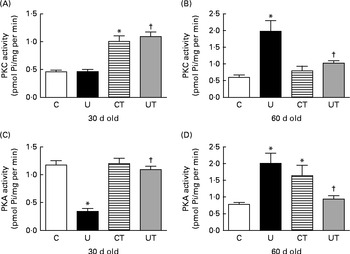
Fig. 4 Activities of ((A) and (B)) protein kinase C (PKC) and ((C) and (D)) protein kinase A (PKA) in the renal proximal tubule cell membranes of rats aged 30 or 60 d. The groups of rats were as follows: offspring of control dams (C, n 11); offspring of dams that were undernourished during gestation (U, n 8); offspring of control dams treated with α-tocopherol during lactation (CT, n 14); offspring of dams that were undernourished during gestation and treated with α-tocopherol during lactation (UT, n 7). Values are means of three to four determinations made using different membrane preparations, with their standard errors represented by vertical bars. * Mean value was significantly different from that of the C group (P< 0·05; two-way ANOVA followed by Bonferroni test). † Mean value was significantly different from that of the U group (P< 0·05; two-way ANOVA followed by Bonferroni test). Pi, inorganic phosphate.
Renal alterations during the established-hypertension phase induced by prenatal undernutrition or by α-tocopherol treatment alone in well-nourished dams during lactation
The Ang II-positive tubulointerstitial cell counts doubled in the U and CT groups (Fig. 5(A) and (C)), with no change in glomeruli (Fig. 5(B) and (D)), during the established-hypertension phase. This is further evidence that the same specific effect on the local RAS had been achieved under two different conditions: undernutrition during fetal life (U) and administration of α-tocopherol alone to well-nourished dams (CT). The number of tubulointerstitial Ang II-positive cells returned to normal values in the UT group (Fig. 5(C)).
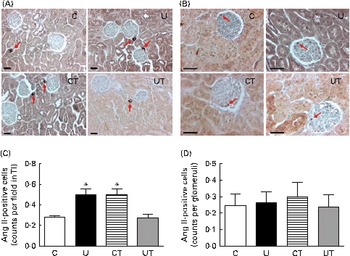
Fig. 5 Immunolocalisation of angiotensin II (Ang II)-positive cells in renal tubulointerstitium (TI) (A) and glomerulus (B) during the established-hypertension phase in prenatally undernourished rats. Rats aged 150 d were used for immunohistochemistry. The groups of rats were as follows: offspring of control dams (C, n 11); offspring of dams that were undernourished during gestation (U, n 8); offspring of control dams treated with α-tocopherol during lactation (CT, n 14); offspring of dams that were undernourished during gestation and treated with α-tocopherol during lactation (UT, n 7). (A) Representative fields (magnification 200 × ) showing Ang II-positive cells in the TI (red arrows) of the C, U, CT and UT groups. (B) Representative fields (magnification 400 × ) showing Ang II-positive cells in glomeruli (red arrows). The images were obtained from a hilar transverse cortical section (6 μm thick). (C) and (D) Graphs corresponding to cell count data in TI and glomeruli, respectively, presented as means, with their standard errors represented by vertical bars and obtained as follows. The numbers of rats in the C, U, CT and UT groups were 5, 5, 4 and 5, respectively. In (C), one hilar transverse section from each rat provided thirty fields of cortical TI, where the number of Ang II-positive cells was counted using light microscopy in a grid of 300 000 μm2. In (D), each rat is represented by fifty individual glomeruli. * Mean value was significantly different from that of the C group (P< 0·05; two-way ANOVA followed by Bonferroni test). (A colour version of this figure can be found online at http://www.journals.cambridge.org/bjn).
The renal expression of COX-2 (Fig. 6) during the same period of SAP evolution also demonstrated that the two different treatments had the same effect – as shown in Fig. 5 – but as the mirror image of that in Ang II-positive cells. COX-2 levels were significantly decreased in the U and CT groups. The expression of the catalytic (gp91phox), but not the regulatory (p47phox), subunits of NADPH oxidase was significantly up-regulated (70 %) in the U group (Fig. 7). Neither lipid peroxidation (Fig. 8(A)) nor changes in renal reduced form of glutathione levels (Fig. 8(B)) accompanied the dysregulation of NADPH oxidase. The number of ED1-positive tubulointerstitial cells was similar to that of p47phox in U rats (Fig. 9(A) and (C)), with no differences in the glomeruli among the four groups (Fig. 9(B) and (D)).
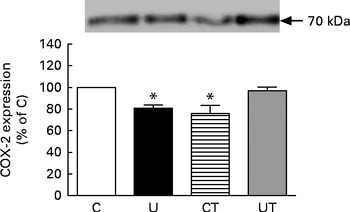
Fig. 6 Immunodetection of cyclo-oxygenase 2 (COX-2) in whole-kidney homogenates obtained from 150-d-old rats. The groups of rats were as follows: offspring of control dams (C, n 11); offspring of dams that were undernourished during gestation (U, n 8); offspring of control dams treated with α-tocopherol during lactation (CT, n 14); offspring of dams that were undernourished during gestation and treated with α-tocopherol during lactation (UT, n 7). The upper part of the figure shows representative Western blots for COX-2. The graph bars show densitometric representations (means with their standard errors represented by vertical bars) of five to ten immunodetections in different homogenates. * Mean value was significantly different from that of the C group (P< 0·05; one-sample t test).
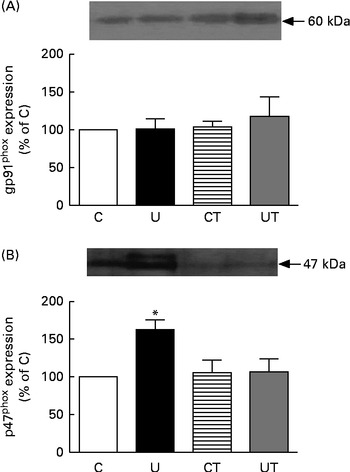
Fig. 7 Expression of the gp91phox catalytic (A) and p47phox regulatory (B) subunits of renal NADPH oxidase during the established-hypertension phase in prenatally undernourished rats. The groups of rats were as follows: offspring of control dams (C, n 11); offspring of dams that were undernourished during gestation (U, n 8); offspring of control dams treated with α-tocopherol during lactation (CT, n 14); offspring of dams that were undernourished during gestation and treated with α-tocopherol during lactation (UT, n 7). The upper part of each panel presents representative Western blots for each NADPH subunit. The graph bars show densitometric representations (means with their standard errors represented by vertical bars) of three to four Western blots obtained from different homogenates. * Mean value was significantly different from that of the C group (P< 0·05; one-sample t test).
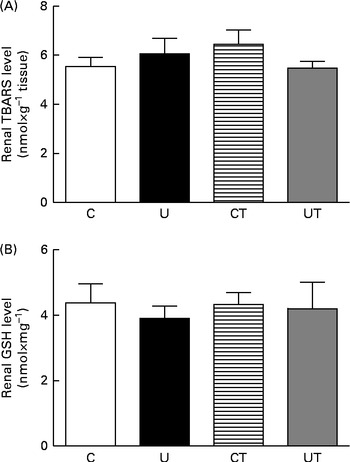
Fig. 8 Levels of thiobarbituric acid-reactive substances (TBARS) (A) and reduced glutathione (GSH) (B) in renal homogenates during the established-hypertension phase (at 150 d) in prenatally undernourished rats. The groups of rats were as follows: offspring of control dams (C, n 11); offspring of dams that were undernourished during gestation (U, n 8); offspring of control dams treated with α-tocopherol during lactation (CT, n 14); offspring of dams that were undernourished during gestation and treated with α-tocopherol during lactation (UT, n 7). Values are means of seven to fourteen (TBARS) and six to twelve (GSH) duplicate determinations made using kidneys from different animals, with their standard errors represented by vertical bars.
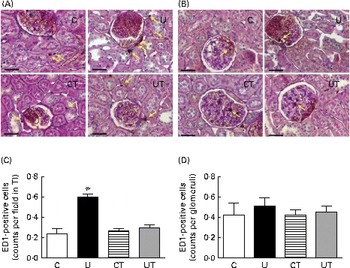
Fig. 9 Infiltration of macrophages in renal tissue during the established-hypertension phase in prenatally undernourished rats. The groups of rats were as follows: offspring of control dams (C, n 11); offspring of dams that were undernourished during gestation (U, n 8); offspring of control dams treated with α-tocopherol during lactation (CT, n 14); offspring of dams that were undernourished during gestation and treated with α-tocopherol during lactation (UT, n 7). (A) Representative fields (magnification 400 × ) showing ED1-positive cells in tubulointerstitium (TI; yellow arrows). (B) Representative fields (magnification 400 × ) showing ED1-positive cells in glomeruli (yellow arrows). The images were obtained from a hilar transverse cortical section (6 μm thick). (C) and (D) Cell counts in TI and glomeruli, respectively, presented as means with their standard errors represented by vertical bars and obtained as follows. The numbers of rats in the C, U, CT and UT groups were 5, 5, 4 and 5, respectively. In (C), one hilar transverse section from each rat provided sixty fields of cortical TI, where the number of ED1-positive cells was counted using light microscopy in a grid of 75 000 μm2. In (D), each rat is represented by sixty individual glomeruli. * Mean value was significantly different from that of the C group (P< 0·05; two-way ANOVA followed by Bonferroni test). (A colour version of this figure can be found online at http://www.journals.cambridge.org/bjn).
Discussion
The silent prehypertensive phase (Fig. 1, main panel) in young rats programmed by intra-uterine undernutrition has been shown to be accompanied by a hidden up-regulation of proximal tubule ouabain-resistant Na+-ATPase activity and alterations in its local RAS regulatory components (Figs. 2–4). It follows that the increased activity of the pump responsible for the fine-tuning of Na+ reabsorption( Reference Bełtowski, Borkowska and Wójcicka 16 , Reference Queiroz-Madeira, Lara and Wengert 17 ) leads to a gradual, initially subtle, increase in body Na+ content( Reference Meneton, Jeunemaitre and de Wardener 49 ), which culminates in an expanded plasma volume (Table 1) and the onset of permanent hypertension in later adulthood. The same earlier programmed molecular alterations could also underpin an abnormal interplay between Ang II, COX-2 and ROS signalling in renal tissue, which in turn might contribute to a sustained elevation of arterial pressure. This view is supported by the observations that, during adulthood, the prenatally undernourished group exhibited more Ang II-positive cells in the cortical tubulointerstitium after hypertension had been established, down-regulation of COX-2 expression, overexpression of the p47phox regulatory subunit of NADPH oxidase, and enhanced infiltration of macrophages (Figs. 5–7 and 9). Overstimulated local Ang II and decreased COX-2 expression in the adult offspring of undernourished dams could affect the renal microvasculature as well as Na+ reabsorption mediated by the ouabain-resistant Na+-ATPase, contributing further to their permanent hypertensive state at 90 d (Fig. 1, main panel). It is generally held that the Ang II- and COX-2-mediated pathways are central players in ROS signalling, as well as in renal homeostasis( Reference Silva, Vieira-Filho and Barreto 22 – Reference Lara, McCormack and Semprum-Prieto 24 , Reference Tian, Moore and Braddy 50 ). Renal tubulointerstitial inflammation (Fig. 9(A)) probably results from high local Ang II and oxidative stress levels, as in models of salt challenge( Reference Lara, McCormack and Semprum-Prieto 24 , Reference Tian, Moore and Braddy 50 , Reference Rodríguez-Iturbe, Franco and Tapia 51 ) and offspring undernutrition induced by low-maternal protein diet during the final period of gestation( Reference Stewart, Jung and Manning 52 ).
ROS signalling is implicated in the earlier processes that culminate in the onset and maintenance of elevated arterial pressure in prenatally undernourished adult rats. This is evident from the total reprogramming of both hypertension (Fig. 1, main panel) and Na+-ATPase activity modifications (Fig. 2(A) and (B)) by maternal α-tocopherol during lactation (Fig. 9(A)). The very high levels of ROS at 30 d( Reference Vieira-Filho, Cabral and Santos 12 ) may be responsible for the lack of response of Na+-ATPase to Ang II in the U group (Fig. 2(A)) when there were no changes in the abundance of AT1R and AT2R (Fig. 3(A) and (C)). However, other possibilities, such as changes (i) in the phosphorylation status of these receptors and in the kinases associated with the Ang II signalling pathways( Reference Yang, Lu and Raizada 53 – Reference Li and Zhuo 55 ) and (ii) in the ratio of glycosylated:non-glycosylated AT1R( Reference Pedrosa, Villar and Pascua 56 ), should be considered. Increased levels of ROS resulting from a possible Ang II-induced( Reference Cabral, Wengert and da Ressurreição 44 ) up-regulation of p47phox expression (Fig. 7) can augment Na+-ATPase activity by scavenging NO( Reference Bełtowski, Borkowska and Wójcicka 16 ), a mechanism that might in turn have implications for a renal microvasculature affected by increased local Ang II (Fig. 5) and decreased COX-2 expression (Fig. 6) levels. It is interesting that maternal α-tocopherol also completely reprogrammed undernutrition-induced late modifications in tubulointerstitial Ang II, COX-2 expression, p47phox up-regulation and macrophage infiltration in the kidney (Figs. 5–7 and 9). The last observations shed more light on the ROS-mediated mechanisms that underlie the genesis and sustainability of hypertension in the programmed adult offspring( Reference Chabrashvili, Kitiyakara and Blau 57 ). A constellation of co-stressors that include humoral factors, the nervous system and the immune system could collaborate in the genesis of hypertension via Ang II and ROS, as has been reviewed recently( Reference Montezano and Touyz 58 ). It is puzzling that despite the up-regulation of p47phox expression, renal TBARS and reduced form of glutathione remained unmodified in the programmed adult offspring (Fig. 8). Maternal undernutrition leads to increased oxidative stress in younger rats, which is gradually attenuated with time( Reference Vieira-Filho, Lara and Silva 11 , Reference Magalhães, da Silveira and Mota 59 ). At 60 d of age, the offspring of undernourished dams had renal TBARS levels 80 % higher than those encountered in control rats( Reference Magalhães, da Silveira and Mota 59 ). This difference became smaller at 90 d (20 %), as the result of the significant decrease found in the U group with the maintenance of TBARS levels in the control group( Reference Vieira-Filho, Lara and Silva 11 ), and finally disappeared at 150 d (Fig. 8(A)). Thus, the imprinted up-regulation of p47phox expression can be considered a relic of a history of elevated ROS levels and altered ROS signalling. Consideration should be given, however, to the possibility that the attenuation of renal TBARS in the U group is helped by an improved balance between oxidant and antioxidant processes as the result of an augmented H2O2-induced abundance of mitochondrial and extra-mitochondrial antioxidant enzymes( Reference Judge, Jang and Smith 60 , Reference Lambertucci, Levada-Pires and Rossoni 61 ), although other studies have reported the opposite( Reference Gomes, Simão and Silva 62 ).
The effect of placental undernutrition on rats at 60 d that leads to a huge decrease in AT2R expression, and the complete abrogation of this effect by α-tocopherol during lactation (Fig. 3(D)), points to this window of growth as a relevant moment – and this type of Ang II receptor as a specific target – for the influence of ROS on the programming of hypertension, the onset of which begins 3 weeks later (Fig. 1, main panel). AT2R decreases Na+ reabsorption( Reference Gildea, Wang and Shah 63 ), and down-regulation of the expression of this receptor in proximal tubule cells could contribute to the subtle and progressive increase in body Na+ content during the prehypertensive phase, as has been proposed above. The fact that AT1R expression remained unmodified throughout the prehypertensive period (Fig. 3(A) and (B)) supports the idea that programming selectively affects renal AT2R, possibly through a specific effect on the intracellular signalling proteins to which it is coupled, which seem to participate in the spatio-temporal modulation of AT2R functions( Reference Rodrigues-Ferreira and Nahmias 64 ); later modifications( Reference Vieira-Filho, Lara and Silva 11 ) might result from compensatory or contra-regulatory effects during the development of hypertension. When intra-uterine undernourished rats were subjected to a salt-loading challenge between weaning and 60 d of age, no further changes occurred in blood arterial pressure and plasma volume, despite an additional increase in TBARS levels( Reference Magalhães, da Silveira and Mota 59 ). This is evidence that normal renal Na+ handling coexists with silent modifications in local RAS and initially elevated ROS levels.
The 30–60 d period seems to be a special window for the effect of prenatal undernutrition on the Ang II-linked and kinase-mediated effects in renal tissue during the prehypertensive phase. These kinases have opposite affects on Na+-ATPase activity: PKC participates in its stimulation by Ang II( Reference Rangel, Lopes and Lara 18 ) and PKA in counterbalancing the effects of Ang II via smaller peptides( Reference Lara, Vives and Correa 48 ). The marked decrease in PKA activity in 30-d-old offspring with normal PKC activity in the undernourished group (and therefore a decrease in the PKA/PKC balance) (Fig. 4(A) and (C)) could underpin one of the mechanisms responsible for the abnormal proximal tubule Na+-ATPase activity, the proposed subtle increase in local and systemic Na+ content, and the later development of hypertension. As the activities of both kinases were similarly up-regulated at 60 d points to an oscillating dynamic of the processes that probably contribute to the small, though significant, recovery of the normal response of Na+-ATPase to Ang II (Fig. 2(B)). In summary, an undernutrition-provoked imbalance between stimulatory and inhibitory Ang II-related signalling components in renal tubules during the prehypertensive phase could foster the up-regulation of ouabain-resistant Na+-ATPase activity and proximal tubule Na+ reabsorption.
In the context of undernutrition-induced alterations in the receptors present in the membranes of proximal tubule cells, the above-postulated oscillating dynamic of different processes could involve the activation/deactivation of D1-like receptors. We know little about the influence of dopamine on the ouabain-resistant renal Na+-ATPase, which is in contrast with all that is known with respect to its influence on the (Na++K+)-ATPase present in proximal tubules( Reference Aperia, Holtbäck and Syrén 65 ). However, a possible effect mediated through altered signals involving D1-like receptors emerges from the observations that PKA activity was initially low (Fig. 4(C)), as also from the loss of response to Ang II. This is what would be expected in the case of activation of these receptors followed by their deactivation promoted by the higher local oxidative stress, as found in renal cells in culture( Reference Asghar, Chugh and Lokhandwala 66 ). Late increase in PKC activity could be a result – at least in part – of this deactivation, as well as the recovery of the response to Ang II. In F344 rats, diminished D1R and exaggerated AT1R functions have been implicated in the development of hypertension( Reference Chugh, Lokhandwala and Asghar 67 ). Crosstalk between AT1R and D1R( Reference Gildea, Wang and Shah 63 ) supports the hypothesis of D1-like receptor participation in the ensemble of altered mechanisms that we have described.
In young adult rats and in intact cells, PKC-dependent activation of the ouabain-resistant Na+-ATPase could be further amplified as the result of an increase in the apical Na+ entry, as found in other nephron segments of rats subjected to placental protein restriction( Reference Manning, Beutler and Knepper 7 , Reference Alwasel and Ashton 68 ). Fetal PKC activity could be inhibited during placental life if hypoxia accompanied undernutrition. However, it was clearly restored in the pups after birth, as indicated by the normal levels at 30 d of age in the U group, and it progressed to a clear up-regulation (Fig. 2(B)) when SAP began increasing (Fig. 1).
Our novel and unexpected observation was that the influence of α-tocopherol – and therefore the global effects of ROS – on the genesis of hypertension and renal dysfunction in undernourished offspring is more complex than previously supposed. The central issue is that α-tocopherol, when administered to well-nourished dams during lactation, mimics the effects of prenatal undernutrition in the development of SAP with age (Fig. 1, inset), also with earlier hypertension development. However, the alterations in RAS signalling (Figs. 3 and 4) differ from those in the undernourished group without α-tocopherol. We can only hypothesise that the different selective effects of the drug on AT2R (Fig. 3(D)), accompanied by alternating and opposing modifications of both protein kinases (Fig. 4), possibly in conjunction with other kinases( Reference Gildea, Wang and Shah 63 , Reference Wruck, Funke-Kaiser and Pufe 69 ), account at least in part for the earlier hypertension development by a mechanism that is independent of Na+-ATPase (Fig. 2). During the established-hypertension phase, the comparable increase in renal Ang II-positive cell number and decrease in COX-2 expression in the U and CT groups could explain similar tension values (Fig. 1, main panel and inset, respectively), together with the similarly expanded intravascular compartment and decreased creatinine clearance. The harmful side effects of α-tocopherol alone warrant further studies (VS Ribeiro, EV Cabral, LD Vieira-Filho, A Vieyra and ADO Paixão, unpublished results). However, they seem to be in line with the proposal that an oxidant/antioxidant balance in renal tissue( Reference Huang, Ma and Chen 70 ), with some ROS being beneficial( Reference Schreck and O'Connor 71 ), is crucial for ion and fluid homeostasis as well as arterial blood pressure regulation( Reference Panico, Luo and Damiano 72 ).
In conclusion, key alterations in renal signalling pathways and ROS handling in the offspring of undernourished dams have been demonstrated, which could help in the elucidation of the mechanism(s) related to the onset of hypertension that remains stable throughout adulthood.
Supplementary material
To view supplementary material for this article, please visit http://dx.doi.org/10.1017/S0007114513004236
Acknowledgements
The authors thank Professor Carlos Peres da Costa for assistance in plethysmography experiments and Glória Costa-Sarmento for technical support. They also thank Dr Karine Verdoorn for critical reading of the revised manuscript and BioMedES (UK) for editing and English correction of the manuscript.
The present study was supported by grants from the National Institutes of Science and Technology, CNPq, Facepe, Faperj and CAPES (Brazil). Financial supporters had no role in the design and analysis of the study or in the writing of this article.
The authors' contributions are as follows: A. D. O. P. and A. V. designed the experiments and the other authors carried out the experiments and analysed the data and contributed to the discussion; A. D. O. P., A. V., L. D. V.-F., E. V. C., P. A. S. and H. M.-F. wrote the manuscript; all authors read and approved the final version of the manuscript.
None of the authors has any conflicts of interest to declare.


