Depression is a common illness worldwide, affecting more than 264 million people(1). It is also a leading cause of disability worldwide and a major contributor to the overall global burden of disease(1). The effects of depression can be long-lasting or recurrent and can dramatically affect a person’s ability to function and live a rewarding life(1). Moreover, depression can lead to suicide. It is therefore important to identify the determinants of depression for prevention.
Diet has received considerable attention as a modifiable factor of depression. Higher intake of sweet foods, sugar-sweetened beverages or sugar from these dietary sources has been suggested to increase the risk of depressive symptoms(Reference Elstgeest, Visser and Penninx2–Reference Sánchez-Villegas, Toledo and de Irala5). A meta-analysis showed that there was an association between higher consumption of sugar-sweetened beverages and increased risk of depression(Reference Hu, Cheng and Jiang3). Further, we recently reported increased risk of depressive symptoms among workers who frequently consumed soft drink(Reference Kashino, Kochi and Imamura6). Regarding sweet foods, eight studies have examined the association with depressive symptoms or perceived stress, and all have observed an increased prevalence or incidence of depressive symptoms(Reference Elstgeest, Visser and Penninx2,Reference Sánchez-Villegas, Toledo and de Irala5,Reference El Ansari, Adetunji and Oskrochi7–Reference Sousa, Marques and Levy11) or perceived stress(Reference Mikolajczyk, El Ansari and Maxwell12). Of these studies, only two were prospective(Reference Elstgeest, Visser and Penninx2,Reference Sánchez-Villegas, Toledo and de Irala5) and no study was conducted among Asian populations.
In Japan, per capita confectionery intake has remained relatively stable since 1975, with 29·0 g/d (4·4 % of total energy intake) consumed in 1975 and 25·7 g/d (4·7 % of total energy intake) in 2019(13,14) . ‘Japanese-type confectionery’ and ‘cakes, pastries, and biscuits’ were the main categories of confectionery consumed(13). The most common type of confectionery consumed differed by age: intake of Japanese-type confectionery increases with age, while intake of Western-type confectionery decreases with age(13). Confectionery contribute to 17·5 % of total sugar intake in Japanese adults(Reference Fujiwara, Murakami and Asakura15). Here, we investigated the prospective association of confectionery intake with depressive symptoms in a Japanese working population.
Methods
Study procedure and participants
As part of the Japan Epidemiology Collaboration of Occupation Health Study, the Furukawa Nutrition and Health Study, a nutritional epidemiology survey, was conducted among workers of a manufacturing company and its affiliates in Chiba and Kanagawa Prefectures, Japan. This survey was conducted at baseline (in April 2012 and May 2013) and at a 3-year follow-up session (April 2015 and May 2016). The study procedure has been described in detail elsewhere(Reference Nanri, Nagai and Kochi16). The study protocol was approved by the Ethics Committee of the National Center for Global Health and Medicine, Japan, and written informed consent was obtained from all participants prior to the survey.
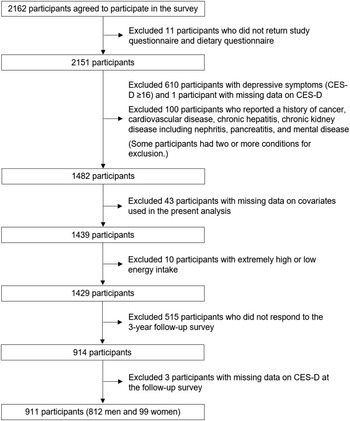
Of 2162 workers participating in the baseline survey, we excluded 11 participants who did not complete the questionnaires (Fig. 1). We then excluded 610 with depressive symptoms (Center for Epidemiologic Studies Depression (CES-D) score ≥ 16), 100 who reported a history of serious diseases and mental disease, 43 with missing data on covariates, and 10 with extremely energy intake (exceeding mean ± 3 sd: < 849 kJ/d or > 14 228 kJ/d). Finally, we excluded 515 who did not attend follow-up survey and 3 with missing data on outcome, leaving 911 (812 men and 99 women) for analysis.

Fig. 1. Flow chart of study participants.
In the present study, 37 % of the participants of the baseline survey did not attend follow-up survey. Participants who completed follow-up survey were younger and more likely to be shift workers, in low job position and physically active during leisure time, but they were less likely to work overtime and have a history of diabetes, compared with those who did not complete follow-up survey (online Supplementary table 1).
Depressive symptoms
Depressive symptoms were assessed using a Japanese version(Reference Shima, Shikano and Kitamura17) of the CES-D scale(Reference Radloff18), which was incorporated into the lifestyle questionnaire. The criterion validity of the CES-D scale has been well established in both Western(Reference Radloff18) and Japanese(Reference Shima, Shikano and Kitamura17) participants. Depressive symptoms were defined as present when participants had a CES-D score ≥ 16.
Dietary assessment
Dietary habits during the preceding month were assessed using a validated brief self-administered diet history questionnaire (BDHQ)(Reference Kobayashi, Murakami and Sasaki19) comprising five sections: (1) frequency of intake of forty-six foods and non-alcoholic beverages, including four categories of confectionery (cakes, cookies and biscuits; Japanese sweets; rice crackers, rice cakes and Japanese-style pancakes; ice cream); (2) daily frequency of rice and miso soup intake; (3) frequency of alcohol consumption and amount consumed for five alcoholic beverages per typical drinking occasion; (4) usual cooking methods; and (5) dietary behaviour. In the questionnaire, participants were asked about only the frequency of foods and beverages they consumed. Dietary intake was calculated on the basis of the reported intake or drinking frequency and the fixed portion size(Reference Kobayashi, Murakami and Sasaki19). Intake of energy and selected nutrients were estimated based on the intake of food items obtained with BDHQ and the corresponding food composition list in the Standard Tables of Food Composition in Japan(Reference Kobayashi, Murakami and Sasaki19,20) . According to a validation study of the BDHQ using 16-d weighed dietary records as the gold standard, Spearman’s correlation coefficients for energy-adjusted intake of confectionery (using the density method) in 92 men and 92 women aged 31–76 years were 0·33 and 0·52, respectively(Reference Kobayashi, Murakami and Sasaki19).
Other variables
Information on marital status, night and rotating shift work, job grade, overtime work, smoking, sleep duration, physical activity during work and housework or while commuting to work, and leisure-time physical activity was obtained in the questionnaire. For work-related physical activity, participants were asked to denote the average time spent per d in each of five activities (sitting, standing, walking, cycling and heavy physical work) from eight options that ranged from almost none to ≥ 9 h. For leisure-time physical activity, participants were asked to report frequency (none to almost every day) and duration (< 30 min to ≥ 4 h) of the activity by the intensity (light, moderate and vigorous intensity). Physical activity during work and housework or while commuting and during leisure time were expressed as the sum of metabolic equivalents (MET) multiplied by duration (in hours) across all levels of physical activity. Psychological work environment was assessed via the Job Content Questionnaire(Reference Karasek, Brisson and Kawakami21), and job strain score was calculated according to standard procedures. BMI was calculated from measured body height and body weight.
Statistical analysis
Confectionery intake was adjusted for total energy intake using the density method. Participants were divided into tertiles of confectionery intake. Baseline characteristics were expressed as mean and standard deviation for continuous variables and percentage for categorical variables. The trend association between confounding factors and confectionery intake was tested using linear regression analysis for continuous variables by treating the median in each tertile of confectionery intake as a continuous variable, and the Mantel–Haenszel χ 2 test for categorical variables.
Multiple logistic regression analysis was performed to estimate OR of depressive symptoms for the tertiles of confectionery intake, with the lowest category as the reference. The first model was adjusted for age (year, continuous), sex and site (baseline survey in April 2012 or May 2013), and the second model was further adjusted for BMI (kg/m2, continuous), marital status (married or other), job grade (high, middle or low), overtime work (< 10, 10–29 or ≥ 30 h/month), night or rotating shift work (yes or no), job strain (quartile), smoking (never-smoker, ex-smoker, current smoker consuming < 20 cigarettes/d or current smoker consuming ≥ 20 cigarettes/d), alcohol consumption (non-drinker or drinker consuming < 23 g, 23 to < 46 g, or ≥ 46 g of ethanol/d), sleep duration (< 6, 6–6·9 or ≥ 7 h/d), leisure-time physical activity (MET-h/week, quartile), physical activity at work and housework or while commuting to work (MET-h/d, quartile), under treatment for or history of diabetes (yes or no), total energy intake (kJ/d, continuous), and CES-D score (continuous). The third model was further adjusted for energy-adjusted intake (using the density method) of folate (μg/4184 kJ, continuous), vitamin B6 (mg/4184 kJ, continuous), vitamin B12 (μg/4184 kJ, continuous), n-3 PUFA (%energy, continuous), Mg (mg/4184 kJ, continuous), Zn (mg/4184 kJ, continuous) and soft drink (g/4184 kJ, continuous). These nutritional factors have been reported to be associated with depressive symptoms(Reference Miki, Kochi and Eguchi22–Reference Nanri, Hayabuchi and Ohta24). Trend association was assessed by treating the median in each tertile of confectionery intake as a continuous variable. As a sensitivity analysis, we repeated the above analysis in model without baseline CES-D score adjustment because adjustment for baseline CES-D score may result in over-adjusted. Two-sided P-values < 0·05 were regarded as statistically significant. All analyses were performed using Statistical Analysis System (SAS) software version 9.3 (SAS Institute).
Results
The baseline characteristics of study participants according to tertile of confectionery intake are shown in Table 1. Compared with participants with lower confectionery intake, those with higher intake were less likely to be men, married, shift workers, current smokers, alcohol drinkers, and physically active during work and housework or while commuting, but tended to have shorter sleep duration. They also had lower BMI and vitamin B6 intake and higher total energy intake.
Table 1. Baseline characteristics of participants according to tertile (T) of energy-adjusted intake of confectionery

CES-D, Center for Epidemiologic Studies Depression.
* Based on the Mantel–Haenszel χ 2 test for categorical variables and linear regression analysis for continuous variables (median in each tertile of confectionery intake).
† Job strain ≥ 0·517 (highest quartile).
‡ Physical activity during work and housework or while commuting ≥ 17·75 MET-h/d (highest quartile).
§ Leisure-time physical activity ≥ 11·5 MET-h/week (highest quartile).
The OR of depressive symptoms according to tertile of confectionery intake are shown in Table 2. Of 911 participants without depressive symptoms at baseline, 153 (16·8 %) were newly identified as having depressive symptoms at the 3-year follow-up. Higher confectionery intake was significantly associated with an increased likelihood of developing depressive symptoms after adjustment for covariates including lifestyle factors and total energy intake (P for trend = 0·008). The multivariable-adjusted OR (95 % CI) for depressive symptoms of the lowest through highest tertile of confectionery intake were 1·00 (reference), 0·89 (0·54, 1·48) and 1·78 (1·09, 2·91). After additional adjustment for dietary factors such as folate, vitamin B6, vitamin B12, n-3 PUFA, Mg, Zn and soft drink, the positive association between confectionery intake and depressive symptoms remained virtually unchanged (P for trend = 0·012) at 1·00 (reference), 0·84 (0·50, 1·41) and 1·72 (1·03, 2·86), respectively. In sensitivity analysis of the full-adjusted model without baseline CES-D score, the results did not materially change. The multivariable-adjusted OR (95 % CI) of the lowest through highest tertile of confectionery intake were 1·00 (reference), 0·90 (0·55, 1·48) and 1·84 (1·13, 2·99) (P for trend = 0·005).
Table 2. OR (95 % CI) of depressive symptoms at the follow-up survey according to tertile (T) of energy-adjusted intake of confectionery

CES-D, Center for Epidemiologic Studies Depression; ref, reference.
* Based on multiple logistic regression analysis with assignment of the median in each tertile of confectionery intake as a continuous variable.
† Adjusted for age (years), sex and site.
‡ Additionally adjusted for BMI (kg/m2), marital status (married or other), job grade (high, middle or low), overtime work (< 10, 10–29 or ≥ 30 h/month), night or rotating shift work (yes or no), job strain (quartile), sleep duration (< 6, 6–6·9 or ≥ 7 h), smoking status (never-smoker, quitter, current smoker consuming < 20 cigarettes/d or current smoker consuming ≥ 20 cigarettes/d), alcohol consumption (non-drinker or drinker consuming < 23 g, 23 to < 46 g, or ≥ 46 g of ethanol/d), leisure-time physical activity (MET-h/week, quartile), physical activity during work and housework or while commuting to work (MET-h/d, quartile), under treatment for or history of diabetes (yes or no), total energy intake (kJ/d), and baseline CES-D score.
§ Additionally adjusted for intake of folate (μg/4184 kJ), vitamin B6 (mg/4184 kJ), vitamin B12 (μg/4184 kJ), n-3 PUFA (%energy), Mg (mg/4184 kJ), Zn (mg/4184 kJ) and soft drink (g/4184 kJ).
Discussion
This prospective study of a Japanese working population identified an association between confectionery intake and an increased risk of depressive symptoms. To our knowledge, this is the first study to examine the association between confectionery intake and depressive symptoms among an Asian population.
Previous studies have consistently reported a positive association between intake of sweet foods and depressive symptoms(Reference Elstgeest, Visser and Penninx2,Reference Sánchez-Villegas, Toledo and de Irala5,Reference El Ansari, Adetunji and Oskrochi7–Reference Sousa, Marques and Levy11) or perceived stress(Reference Mikolajczyk, El Ansari and Maxwell12), despite differences in definitions of sweet foods and methods for assessing depressive symptoms. Two of these were prospective studies(Reference Elstgeest, Visser and Penninx2,Reference Sánchez-Villegas, Toledo and de Irala5) . In the Seguimiento Universidad de Navarra (SUN) Project in Spain(Reference Sánchez-Villegas, Toledo and de Irala5), commercial baked goods including muffins, doughnuts, croissants and other similar foods were positively associated with self-reported physician-diagnosed depression. In the InCHIANTI study in Italy(Reference Elstgeest, Visser and Penninx2), total intake of sweet foods, including biscuits, cakes, pies, pastries, puddings, ice cream, confections, chocolate, jam, sugar and honey, were associated with an increased risk of depressive symptoms (CES-D score ≥ 20). Our findings extend this evidence of a positive association between confectionery intake and depressive symptoms to an Asian population.
The mechanism linking confectionery to depressive symptom has not been fully elucidated, but following are suggested. A high-sugar diet has been reported to be associated with decreased levels of brain-derived neurotrophic factor(Reference Molteni, Barnard and Ying25), a growth factor which plays an important role in the survival, growth and differentiation of neurons(Reference Lewin and Barde26). Moreover, higher intake of sugar causes obesity, which may in turn contribute to depression via inflammatory and psychosocial factors(Reference Lewin and Barde26). In the present study, however, we observed a positive association between confectionery intake and depressive symptoms even after adjusting for BMI. Furthermore, high sugar intake has been suggested to tip the balance in the microbiota towards increased pro-inflammatory activity(Reference Satokari27). Alternatively, the increased risk of depressive symptoms associated with confectionery intake may be partly attributed to its high glycemic impact. A meta-analysis reported a link between diets with high glycemic index and depression(Reference Salari-Moghaddam, Saneei and Larijani28). Finally, trans-fatty acids, which are abundant in Western-type confectioneries, have been shown to be associated with inflammation(Reference Baer, Judd and Clevidence29) and dysbiosis of gut microbiota(Reference Ge, Liu and Tao30).
Strengths of the present study include its prospective design, high study participation rate, use of validated questionnaires for depressive symptoms and diet, and adjustment for known and suspected risk factors of depressive symptoms. Our study also had some limitations. First, the large loss to follow-up may have introduced selection bias. We observed some differences of baseline characteristics between participants who completed follow-up survey and those who did not (Supplementary Table 1). Second, because dietary intake was assessed using a self-administered questionnaire and at only a single time point, misclassification arising from measurement error is possible. Third, we used the CES-D scale to assess depressive symptoms and did not include clinical depression. Therefore, our findings might not be applicable to clinical depression. Fourth, although we measured confectionery intake at baseline and assessed the development of depression at 3-year follow-up, we cannot exclude the possibility of reverse causality given a short follow-up period. Fifth, it would be of interest which type of confectionery is specifically associated with depressive symptoms. We did not examine such association, however, due to the lack of reliable data of each confectionery intake. Sixth, we did not calculate sample size prior to the current analysis because we designed the original study to examine various exposure–outcome associations in a fixed working population. Nevertheless, the present study has sufficient power to detect the confectionery–depression association with statistical significance. Seventh, although we developed the study-specific questionnaire on physical activity with reference to several existing questionnaires, we did not validate our questionnaire. Eighth, although we tried to adjust for important risk factors for depression, we cannot rule out the possibility of bias due to unmeasured variable (such as educational attainment) and residual confounding. Finally, because the study participants were all employees of a single company, the findings might not be applicable to the general population.
In conclusion, we found that confectionery intake was associated with an increased likelihood of depressive symptoms. Our findings extend evidence that high confectionery intake increases the risk of depressive symptoms to Japanese populations. The present findings of positive association between confectionery intake and depressive symptoms should be confirmed in various populations with different background.
Acknowledgements
The authors thank Hiroko Tsuruoka, Rie Ito, and Akiko Makabe (Furukawa Electric Corporation), and Yuriko Yagi (National Center for Global Health and Medicine) for their help with data collection.
This study was supported by the Industrial Health Foundation (T.M.); and the Japan Society for the Promotion of Science (T.M., grant number 25293146), (A.N., grant number 25702006).
A. N. and T. M. designed the research; A. N., I. Kashino, T. K., M. E., I. Kabe and T. M. conducted the survey; N. S. and A. N. performed statistical analysis; T. M. provided statistical expertise; A. N. drafted the manuscript; A. N. and T. M. had primary responsibility for the final content; and all authors approved the final version of the manuscript.
There are no conflicts of interest.
Supplementary material
For supplementary material/s referred to in this article, please visit https://doi.org/10.1017/S0007114521003056