


Consumption of red meat has been associated with the development of chronic diseases including the metabolic syndrome (MetS), CVD and type 2 diabetes (T2D)( Reference Azadbakht and Esmaillzadeh 1 , Reference Micha, Michas and Mozaffarian 2 ). With the prevalence of these diseases increasing rapidly, the need for public health strategies to help improve dietary quality and reduce chronic disease risk is becoming more crucial( 3 ).
Public health recommendations advise limiting red meat consumption to ≤500 g/week( 4 ). However, there is conflicting evidence regarding the type of red meat consumed. A number of reviews have highlighted the importance of discriminating processed from unprocessed red meat when examining the effect on health outcomes( Reference Micha, Michas and Mozaffarian 2 , Reference Pan, Sun and Bernstein 5 ). This suggests that preservation and processing, coupled with the confounding effects of diet and lifestyle factors, need to be considered in disease causality( Reference Rohrmann and Linseisen 6 ). A meta-analysis by Micha et al. identified an association between a 50 g/d serving of processed meat and CVD risk (relative risk 1·42; 95 % CI 1·07, 1·89, P=0·04); however, no association was observed with a 100 g serving of unprocessed red meat (relative risk 1·00; 95 % CI 0·81, 1·23, P=0·36)( Reference Micha, Michas and Mozaffarian 2 ). Moreover, processed meat consumption has also been associated with a greater incidence of T2D (hazard ratio 1·32; 95 % CI 1·25, 1·40, P<0·001) than unprocessed red meat consumption (hazard ratio 1·12; 95 % CI 1·08, 1·16, P<0·001)( Reference Pan, Sun and Bernstein 5 ).
However, because of their observational nature it is difficult to determine causality. A recent meta-analysis by O’Connor et al., which included randomised controlled trials only, failed to find a causal relationship between daily total red meat intakes of ≥0·5 servings/d (≥35 g/d) and markers of CVD, cholesterol levels, TAG and blood pressure (P>0·05)( Reference O’Connor, Kim and Campbell 7 ). Similarly, a meta-analysis by Fretts et al. reported that the association of red meat with markers of T2D was attenuated after controlling for BMI( Reference Fretts, Follis and Nettleton 8 ).
The above analyses were based on meat consumption; however, when reviewing the impact of food types on metabolic disease risk, it is important to consider the overall dietary pattern. Low red meat consumption (≤0·5servings/d) is typical of a Mediterranean dietary pattern, which has been associated with lesser risk for CVD and T2D( Reference Heidemann, Schulze and Franco 9 , Reference van Dam, Rimm and Willett 10 ); however, randomised controlled trials have shown that Mediterranean diet patterns with ≥0·5 servings/d of red meat had a similar effect on CVD risk factors( Reference Roussell, Hill and Gaugler 11 ). In contrast, higher red meat consumption is typically associated with a Western dietary pattern, which has been positively associated with increased risk of disease( Reference Heidemann, Schulze and Franco 9 , Reference van Dam, Rimm and Willett 10 , Reference Lutsey, Steffen and Stevens 12 ).
The aims of this analysis were to identify dietary patterns in a nationally representative cross-sectional cohort, to characterise the contribution of processed red meat to overall diet and, moreover, to investigate the association of biomarkers of CVD and T2D with nutrient intakes and plasma fatty acid levels within identified dietary patterns.
Methods
Study population
The National Adult Nutrition Survey (NANS) is a cross-sectional food consumption survey of a demographically representative sample comprising 1500 free-living men (n 740) and women (n 760), aged 18–90 years, across the Republic of Ireland between 2008 and 2010( 13 ). Individuals who failed to provide a blood sample (n 364) were excluded from the current analysis, as were under-reporters (n 351) – those participants who presented an energy intake:BMR ≤1·10( Reference McGowan, Harrington and Kiely 14 ). The final sample size was 786 (men: 399; women: 387). There were no differences in sex, age, current smoking status and supplement use between those included in the analysis and those excluded. However, there was a greater percentage of non-manual/skilled manual workers in the excluded population, who had a higher BMI than individuals in the current cohort (P<0·05). A detailed description of the NANS recruitment and methodology is reported elsewhere( 13 ). However, a concise overview of the data collection and laboratory techniques relevant to this analysis is outlined below. Ethical approval was granted by the University College Cork Clinical Research Ethics Committee of the Cork Teaching Hospitals and the Human Ethics Research Committee of University College Dublin (ECM 3 (p), 4 September 2008). Written consent was obtained from each participant, in accordance with the Declaration of Helsinki.
Dietary assessment and analysis
Food and beverage intakes were assessed over 4 consecutive days, including at least 1 weekend day, using a semi-weighed food diary. Brand names, recipes and cooking methods were also recorded. The food-composition database was updated to include recipes, nutritional supplements, commonly consumed generic Irish foods and new foods on the market. The database comprised 133 068 rows of data and 2552 food codes were assigned to all food, beverages and nutritional supplements consumed. Food and nutrient intakes were analysed using the Weighed Intake Software Program (WISP© version 3.0; Tinuviel Software)( 13 ). A total of 2048 food codes were aggregated into twenty-nine food groups, representative of the overall diet( Reference Hearty and Gibney 15 ). In all, 502 food codes contained meat and were characterised into four groups: unprocessed red, processed red, unprocessed white and processed white meat. Red meat included beef, lamb and pork, whereas poultry was classified as white meat. Processed meat had undergone salting, curing, fermentation, smoking, flavour enhancement or other preservation processes, examples of which included ham and sausages( Reference Bouvard, Loomis and Guyton 16 ). To calculate mean daily processed red meat intakes, each food code was updated for grams of meat per 100 g of product, using the online McCance and Widdowson Composition of Foods integrated data set and manufacturer’s information( 17 ). Information on sociodemographic characteristics, health and lifestyle habits and anthropometric measurements were obtained( 13 ). Alternate Healthy Eating Index (AHEI) scores were assigned based on the criteria given by McCullough et al. ( Reference McCullough, Feskanich and Stampfer 18 ) with a higher overall score representing a healthier diet pattern.
Biochemistry measurements
A clinical bioanalyser (RX Daytona; Randox Laboratories) was used to measure levels of glucose, TAG and total and HDL-cholesterol in serum samples( Reference O’Donovan, Walsh and Nugent 19 ). LDL-cholesterol levels were calculated as (Total cholesterol/HDL-cholesterol)−(TAG/2·2). Insulin, leptin and TNFα levels were measured using a biochip array system (Evidence Investigator; Randox Laboratories). Adiponectin levels were measured using ELISA (ALPCO Diagnostics kit; ALPCO) and homocysteine levels using a flourescence polarisation immunoassay. A detailed description of the lipid extraction methodology and fatty acid analysis has been outlined elsewhere( Reference Li, Brennan and McNulty 20 ). The National Cholesterol Education Programme’s Adult Treatment Panel III criterion was applied to evaluate risk for the MetS( 21 ).
Statistical analysis
Data were analysed using SPSS® for WindowsTM statistical software package version 20.0 (SPSS Inc.). Descriptive statistics for continuous variables are presented as mean values and standard deviations, whereas categorical variables are reported as percentages.
The thirty-three food groups were converted to percentages of total daily energy (%TE) intakes, to derive dietary patterns proportional to energy intakes, and standardised as z scores. Preliminary two-step cluster analysis was applied to determine the optimal number of dietary clusters in the cohort. The first step involves the formation of preclusters, based on the distance criterion, whereas the second step applies the standard hierarchical clustering algorithm to these preclusters. This analysis identified four dominant dietary patterns. k-Means subsequently characterised these patterns by separating participants into non-overlapping groups derived from Euclidean distance. To validate the dietary patterns, the population was randomly divided into two parts and the analysis was repeated. In all, 69 % of individuals were re-classified in the cluster analysis validation.
Sociodemographic characteristics were analysed using the χ 2 statistic for categorical variables and one-way ANOVA with Bonferroni post hoc tests for continuous variables. Differences in nutrient intakes, dietary quality, anthropometric measurements and biochemical data were assessed using an adjusted general linear model. Bonferoni correction was applied by multiplying each P value by the number of traits in each table. P≤0·05 were considered significant and those that exceeded 1·0 were marked down to 1·000.
Results
Total red meat intake was 134 g/d (male) and 89 g/d (female), whereas processed red meat intakes were 52 g/d (male) and 29 g/d (female). Overall, four dietary patterns were identified (Table 1). Pattern 1 presented higher energy contributions from wholemeal breads, vegetables, fruit, fish and yogurts (P<0·001). The greatest contributors to energy in Pattern 2 were chips, processed potatoes, rice, pasta, fruit juices, smoothies and cheeses (P<0·001). Pattern 3 had higher contributions from alcoholic beverages, unprocessed red meat, ready-to-eat breakfast cereals, savouries and confectionery (P<0·05). White bread, processed red meat, butters, whole milk and potatoes were the greatest contributors towards energy intakes in Pattern 4 (P<0·001). Mean daily processed red meat intakes were lowest in Pattern 1 (1·3 %TE) and greatest in Pattern 4 (2·4 %TE) (P<0·001). There was a significantly greater contribution of processed red meat to Pattern 4, in comparison with all other patterns (online Supplementary Table S1).
Table 1 Percentage of energy contribution of food groups across four dietary patterns in Irish adults (Mean values and standard deviations)

a,b,c Mean values with unlike superscript letters are significantly different between groups (P<0·05).
* Differences across dietary patterns were assessed using one-way ANOVA. Bonferroni correction was applied by multiplying the P values by the number of traits in the table. P values that exceeded 1·0 have been marked down to 1·000.
Participants in Pattern 1 were predominantly older professional women, with better dietary quality and greater supplement usage (P<0·001). Pattern 2 was seen in younger female participants, who were of a lower social class and were more likely to smoke (P<0·001). Pattern 3 was observed in younger participants, with a slightly higher proportion of male participants than female, with the greatest energy intakes (P<0·001). Participants in Pattern 4 were typically older men and women, who presented the poorest AHEI scores (P<0·05). Participants in Patterns 3 and 4 were typically non-manual or skilled manual workers (Table 2).
Table 2 Participant characteristics across the four dietary patterns (Mean values and standard deviations)
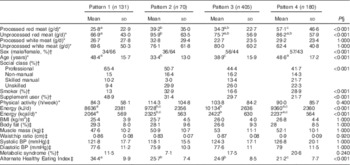
BP, blood pressure.
a,b,c Mean values with unlike superscript letters are significantly different between groups (P<0·05).
* Differences across meat consumption and demographics were assessed by one-way ANOVA.
† Differences across sex, social class, smoking and supplement use were assessed using the Pearson χ 2 Statistic.
‡ Differences across anthropometric measurements and dietary quality were assessed using a general linear model adjusted for age, sex, energy, social class, smoking status and supplement usage.
§ Bonferroni correction was applied by multiplying the P values by the number of traits in the table. P values that exceeded 1·0 have been marked down to 1·000.
Mean daily intakes, including contributions from supplements, are presented in Tables 3 and Table 4. Carbohydrate (%TE), sugar (%TE) and fibre (g/10 MJ) intakes were significantly greater in Pattern 1 (P<0·001). Total fat (%TE) intakes were greatest in Patterns 2 and 4, with Pattern 4 presenting significantly greater SFA (%TE) intakes than the other three patterns. MUFA (%TE), PUFA fat (%TE) and α-linolenic acid (%TE) intakes were greatest in Pattern 2 (P<0·001), with no significant differences in EPA (%TE) and DHA (%TE) levels between patterns. Na (mg/10 MJ) intakes were significantly lower, whereas intakes of other micronutrients were significantly greater in Pattern 1 (Table 3). In comparison with the other dietary patterns, plasma EPA (C20 : 5n-3) and DHA (C22 : 6n-3) levels were higher in Pattern 1 (P<0·001). No significant differences were observed in a suite of markers of CVD and T2D (Table 4).
Table 3 Nutrient composition across four dietary patterns (Mean values and standard deviations)
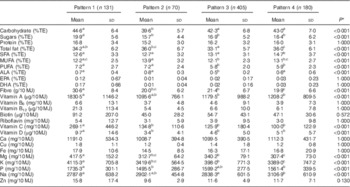
%TE, percentage of total energy; ALA, α-linolenic acid.
a,b,c Mean values with unlike superscript letters are significantly different between groups (P<0·05)
* Differences in nutrient intakes across dietary patterns were assessed using a General Linear Model adjusted for age, sex, social class, smoking status and supplement usage. Bonferroni correction was applied by multiplying the P values by the number of traits in the table. P values that exceeded 1·0 have been marked down to 1·000.
Table 4 Plasma fatty acid levels and markers of metabolic health across the four dietary patterns (Mean values and standard deviations)

a,b,c Mean values with unlike superscript letters are significantly different between groups (P<0·05).
* Differences in fatty acids and markers of metabolic health across dietary patterns were assessed using a one-way ANOVA.
† Differences in fatty acids and markers of metabolic health across dietary patterns were assessed using general linear model adjusted for age, sex, energy (kJ (kcal)), social class, smoking status, supplement usage and fasting status. Bonferroni correction was applied by multiplying the P values by the number of traits in the table. P values that exceeded 1·0 have been marked down to 1·000.
Discussion
Overall, four dietary patterns were derived, which were distinguishable by both processed red meat consumption and other dominant food groups. The pattern with greater processed red meat intakes presented a poorer AHEI score and a lower n-3 PUFA status compared with the pattern with significantly lower contributions from processed red meat; however, there were no significant differences in traditional biomarkers of CVD and T2D between the patterns.
Total red meat intake in the current analysis was 134 g/d in men and 89 g/d in women, with 46 % adhering to the recommendation of ≤500 g/week( 4 ). In all, 85 % of the cohort consumed processed red meat; intakes of which are recommended to be limited( 4 ). Men (52 g/d) presented greater mean daily processed red meat intakes than women (29 g/d). Irish intakes are slightly higher than intakes in the UK, similar to those in Spain, Sweden and Denmark, and lower than those in Germany( Reference Linseisen, Kesse and Slimani 22 – Reference Kaluza, Åkesson and Wolk 24 ). However, it must be noted that much of the dietary intake data in the aforementioned studies were collected over a decade ago and the applied definitions differ slightly. Data exist for processed red meat intakes in the USA (male 29 g/d, female 18 g/d); again this is not directly comparable due to the definitions applied( Reference Daniel, Cross and Koebnick 25 ). This lack of a stringent, global definition for processed meat is one of the major limitations when investigating processed red meat consumption as a risk factor for disease. Further research is required to ascertain whether there is greater risk associated with specific products as opposed to total processed red meat.
The current analysis included red meat that underwent smoking, salting, curing, fermentation or other processing to enhance flavour or improve preservation( Reference Bouvard, Loomis and Guyton 16 ). It is important to consider the effects of these processing techniques, and the added ingredients, including salt, which may be contributing to the observed association between processed red meat and risk for incident CVD and T2D( Reference Micha, Michas and Mozaffarian 2 , Reference Rohrmann and Linseisen 6 ). In a review by Micha et al. which included twenty-seven observational studies (CVD; n 10; T2D; n 17) from ten countries, studies presented varying quantities of mean daily red meat intakes, with differing processed meat definitions and differing levels of confounder adjustment outlining the difficulties in reviewing this area( Reference Micha, Michas and Mozaffarian 2 ). Furthermore, high processed meat consumers were characterised by less-favourable dietary and lifestyle factors( Reference Micha, Michas and Mozaffarian 2 ). However, recent studies are inconsistent with the aforementioned results, with no causal association observed between total red meat intakes and biomarkers of CVD using randomised controlled trials, with similar biomarker levels to the current study( Reference O’Connor, Kim and Campbell 7 ). Further, it has been noted that the observed association between both processed and unprocessed red meat and biomarkers of T2D were attenuated following adjustment for confounding factors, particularly BMI, and multiple comparisons( Reference Fretts, Follis and Nettleton 8 ). There were significant differences between processed red meat consumption and biomarkers of health in the current cohort; however, this was before adjustment for confounding factors and Bonferroni correction (online Supplementary Table S2).
Dietary patterns have been associated with predicting risk of disease; processed red meat is typical of the Western-style diet, which has been associated with an increased risk for CVD and T2D( Reference Heidemann, Schulze and Franco 9 ). However, a recent study found no association between a ‘meat and fish’ pattern and 10-year CVD risk, whereas ‘refined foods’ including soft drinks and alcohol were associated with a predicted 10-year CVD risk in a Mexican cohort using factor analysis (relative risk 2·98; 95 % CI 1·46, 6·10; P trend=0·020)( Reference Denova-Gutiérrez, Tucker and Flores 26 ). As the majority of studies to date have focused on high processed red meat intakes, not the overall diet, and on the incidence of disease, the aim of this analysis was to characterise the contributions of red meat to dietary patterns in a European cohort. With four dominant dietary patterns derived, it was observed that Pattern 1 was similar to the Mediterranean pattern with Patterns 2 and 3 comprising components of the Western pattern( Reference Heidemann, Schulze and Franco 9 ). Pattern 4 had a significantly greater contribution from processed red meat than the other dietary patterns. Other dominant food groups in this pattern included butters and whole milk, and lower contributions from fruit, vegetables and fish, consistent with significantly lower plasma EPA and DHA levels; however, only plasma DHA remained significant after exclusion of fish-oil supplement users (n 94). Mean EPA and DHA intake in the total population (n 786) was 120 mg/d, lower than the European Food Safety Authority (EFSA) recommendation of 250 mg/d( 27 ). Pattern 1 was the sole achiever of the EPA and DHA recommendation (342 g/d), potentially due to greater dietary intakes of fish, which was reflected in their plasma fatty acid levels.
Similar to previous studies, participants in the high processed red meat pattern were typically older and of a lower social class; 29 % were current smokers with a significantly lower AHEI score and dietary fibre intake and greater SFA intakes. This is consistent with the findings of the study by Li et al. in which older participants presented greater SFA intakes( Reference Li, McNulty and Tiernery 28 ). However, unlike other analyses investigating processed red meat and disease risk, the current study had access to a suite of blood biomarkers of CVD and T2D, to complement the dietary intake data. Significant differences were observed between dietary patterns and biomarkers of CVD and T2D; however, this was attenuated when confounding factors were included in the model (Table 4). The possibility that red meat may be associated with increased non-traditional biomarkers should also be investigated. It is evident that further research is required to confirm the degree of association between processed red meat consumption and development of cardio-metabolic diseases, with careful consideration of the definition applied, the processing procedures and the residual confounding factors. A Mendelian randomisation approach as suggested by Rohrmann & Linseisen may be a potential strategy( Reference Rohrmann and Linseisen 6 ).
The large, nationally representative cohort, the 4-d semi-weighed food diaries, and product information at brand level, coupled with metabolic biomarkers, strengthened the current analysis, whereas the inclusion of plasma fatty acid data provided a novel aspect. Dietary intakes were self-reported; thus, the removal of under-reporters eliminated potential reporting bias, and the Bonferoni correction for multiple comparisons strengthened the statistical analysis. However, the cross-sectional nature of the NANS is a limitation, as we cannot comment on the causal relationship between processed red meat and these diseases but merely state that we failed to observe an association between the dietary patterns and traditional blood biomarkers. This analysis was also limited to processed red meat contributions to dietary patterns. The application of cluster analysis to derive dietary patterns may have potentially resulted in a loss of statistical power, as it classified participants into an individual pattern, in comparison with factor analysis in which individuals receive a factor score for all derived dietary patterns. Further, the NANS was typical of a healthy cohort; findings may differ in an at-risk or diseased cohort.
In conclusion, no association was observed between high consumption of processed red meat and biomarkers of CVD and T2D in the current cohort. This finding is similar to those from the meta-analyses by O’Connor et al. and Fretts et al., who failed to find an association between red meat consumption and CVD( Reference O’Connor, Kim and Campbell 7 ) and T2D( Reference Fretts, Follis and Nettleton 8 ). Similar to other cohorts, high consumers of processed red meat presented a more unfavourable diet and lifestyle, which needs to be considered when investigating the association between processed red meat consumption and incidence of CVD and T2D. This analysis supports previous findings that emphasise overall dietary quality as a measure of health, rather than intakes of single foods and nutrients. Therefore, future public health recommendations should consider focusing on the total diet, based on the conflicting evidence for the role of processed red meat in disease risk. Furthermore, a global definition of processed meat should also to be developed, and modification of ingredients, similar to salt reductions, may be an effective public health strategy to improve the quality of processed red meat.
Acknowledgements
The authors are grateful for the assistance of Ricardo Segurado (Statistician at CStar, www.cstar.ie) for advice on statistical components of the study, and the NANS participants for providing detailed dietary intake data and blood samples.
This research was supported by the Irish Department of Agriculture, Food and the Marine under the National Development Plan (2007–2013) (grant no. 13/F/514) and the Health Research Board under their joint Food for Health Research Initiative (2007–2012) (grant no. FHRIUCC2).
The authors’ contribution are as follows: B. A. M., A. P. N., H. M. R., L. B., A. F. and J. W. designed the research, Y. M. L., B. A. M., A. P. N. and K. F. L. conducted the research, Y. M. L. and B. A. M. analysed the data and prepared the manuscript. All authors read and approved the final manuscript.
None of the authors has any conflicts of interest to declare.
Supplementary material
For supplementary material/s referred to in this article, please visit https://doi.org/10.1017/S0007114517002008


