


Water comprises about 60–75 % of the human body weight, and cellular homoeostasis is maintained via the balanced water/minerals content in different body liquids(Reference Nicolaidis and Arnaud1). The human consumption of water comes from foods and beverages and plain water(Reference Park, Jang and Lim2–4). The WHO recommended a daily water intake of 2·9 L for men and 2·2 L for women under standard conditions(5). Evidence has been ranked from weak to strong regarding the association of fluid intake with reduced risks of different chronic diseases, including CHD(Reference Chan, Knutsen and Blix6), chronic kidney disease(Reference Sontrop, Dixon and Garg7) and total mortality(Reference Wu, Chen and Liaw8). The specific importance of fluid intake comes from its impact on the cardiovascular system as the fluid input/output regulates the blood volume, which correlates with blood pressure and heart rate(Reference Callegaro, Moraes and Negrao9). Moreover, the fluid supplement increased the blood pressures while reduced the heart rate in both normotensive and hypertensive individuals by enhancing a sympathetic nervous system and reducing a vasovagal reaction(Reference Schroeder, Bush and Norcliffe10). However, the evidence on the association of fluid intakes from foods and beverages (including alcohol) with the risk of CVD has been inconclusive(Reference Chan, Knutsen and Blix6,Reference Wu, Chen and Liaw8,Reference Leurs, Schouten and Goldbohm11–Reference Palmer, Wong and Iff13) . The total fluid intake from foods and beverages (including alcohol) was not associated with mortality from ischaemic heart disease or stroke in Dutch men and women(Reference Leurs, Schouten and Goldbohm11). The third National Health and Nutrition Examination Survey (NHANES III) of Americans reported that higher total fluid intake from foods and beverages (including alcohol) was associated with the reduced risk of all-cause mortality but not cardiovascular mortality in men and women with chronic kidney disease, while no association was observed for the risk of either the all-cause mortality or the cardiovascular mortality in participants without chronic kidney disease(Reference Wu, Chen and Liaw8). The higher non-alcoholic beverages intake was positively associated with the risk of fatal CHD in women more than men in the Adventist Health Study(Reference Chan, Knutsen and Blix6). The higher fluid intake from foods and beverages (including alcohol) was associated with the reduced risk of mortality from CVD in Japanese men and women(Reference Cui, Iso and Eshak12), but not in Australians(Reference Palmer, Wong and Iff13).
Alcohol has its own effect on the risk of CVD that could differ from that of other fluid intakes(Reference Mostofsky, Chahal and Mukamal14). Thus, using non-alcoholic beverages intake to examine the associations with the risk of incident CVD may be more appropriate than using the total fluids including alcohol. Moreover, the non-alcoholic beverages could be potentially healthy beverages such as green tea or potentially unhealthy beverages such as cola. This study aims to examine the association of intakes of non-alcoholic beverages with risks of total stroke, CHD and total CVD under a large population-based cohort study – the Japan Public Health Center (JPHC)-based cohort study. Because the contribution of potentially unhealthy beverages, such as cola to the Japanese population’s non-alcoholic beverages intake, is believed to be minimal, we hypothesised that higher non-alcoholic beverages intake could be associated with the reduced risk of incident CVD.
Subjects and methods
Design and study population
The JPHC study started as Cohort I in 1990 and included residents of five public health centre areas aged 40–59 years, before being extended, by Cohort II in 1993, to include residents of other six public health centre areas aged 40–69 years. A total of 140 420 registered residents (68 722 men and 71 698 women) at the eleven public health centre areas throughout Japan were recruited for the baseline survey(Reference Tsugane and Sawada15). Two public health centre areas of Tokyo and Osaka were excluded from the current study because the incidences of cancer and CVD were unable to be followed up in these two communities. The 5-year follow-up survey of the JPHC study was used for the analysis.
The data on non-alcoholic beverages intake were collected in the 5-year follow-up survey of the JPHC study conducted in 1993 in Cohort I areas and 1998 in Cohort II areas, to which a total of 80 739 men and women responded. We considered the time of the 5-year survey as the starting point of the follow-up in our research, and the data were collected by its self-administered questionnaire as the baseline status of the studied participants. We excluded 2332 participants who self-reported histories of CVD or cancer at the starting point. Therefore, a total of 36 277 men and 41 130 women aged 45–74 years were enrolled in the present study. This study protocol was approved by the human ethics review committees of the National Cancer Center, Osaka University Graduate School of Medicine, and each registered hospital.
Assessment of exposure
A self-administered questionnaire was administered in the 5-year follow-up survey of the JPHC study and covered medical history, smoking habit and alcohol consumption. Hypertension was defined as having a history of hypertension or using antihypertensive medication. Diabetes mellitus was defined as having a history of diabetes or using medication for diabetes. Drinking status and the amount of ethanol per week were estimated. Never drinkers were those who reported ‘never’, former drinkers were those who reported ‘stopped drinking’ and current drinkers were further categorised according to the amount of ethanol intake into 1–149, 150–299, 300–449 and ≥ 450 g/week. For smoking status, never smokers indicated those who reported ‘never smoked’, ex-smokers indicated those who reported ‘stopped smoking’ and current smokers indicated those who smoked ≥ 1 cigarette/d at the time of the 5-year survey and were further categorised according to the number of smoked cigarettes per d into 1–19, 20–29 and ≥ 30 cigarettes per d. BMI was calculated as weight (kg) divided by the square of height (m2). Participants who reported their employment status as ‘self-employed’, ‘employed’, ‘professional’ or ‘other occupations’ were considered employed, while others were considered as unemployed. Hours spent in sitting, standing, walking, active job, sports and sleep were used to determine the level of physical activity in metabolic equivalent (MET) units. Perceived stress level was determined by the response to one item in the questionnaire ‘How much stress do you have in your daily life’? We defined that perceived stress level as low, medium and high for those who responded ‘no to a little’, ‘average’ and ‘a lot’, respectively.
The dietary section of the survey included a 138-item FFQ, and for non-alcoholic beverages, the following frequencies of intake were offered for each item: ‘almost never, 1–2, 3–4/week, and 1, 2–3, 4–6, 7–9 and more than 10/d’(Reference Sasaki, Kobayashi and Ishihara16,Reference Hamazaki, Eshak and Ikehara17) . Non-alcoholic beverages included green tea, coffee, Chinese tea, black tea, healthy drink, Ca drink, cola and sugary drink. The validity of the FFQ was tested by comparing the fluid intakes determined by the FFQ with those determined by dietary records in a subsample of our cohort. The Spearman’s correlation coefficients between the intake of non-alcoholic beverages derived from the FFQ and the dietary records were 0·43 in men and 0·28 in women for Cohort I participants, and 0·56 and 0·58 for Cohort II participants, respectively(Reference Sasaki, Kobayashi and Tsugane18, Reference Ishihara, Sobue and Yamamoto19).
Confirmation of stroke and CHD incidence
Physicians, unaware of the patients’ lifestyle data, reviewed the medical records at 78 hospitals in the sampling areas of the JPHC cohort. The incidences of stroke and its types, ischaemic stroke and haemorrhagic stroke (intracerebral and subarachnoid haemorrhages), primarily based on computed tomography and MRI(Reference Iso, Rexrode and Hennekens20), were confirmed based on data of the medical records that meet the criteria of the National Survey of Stroke(Reference Walker, Robins and Weinfeld21), which require a constellation of neurological deficits of sudden or rapid onset lasting at least 24 h or until death. The incidence of CHD was defined as myocardial infarction and/or sudden cardiac death that were confirmed from the medical records to meet the criteria of the MONICA (Multinational Monitoring of Trends and Determinants in Cardiovascular Disease) project(Reference Tunstall-Pedoe, Kuulasmaa and Amouyel22), which require evidence from electrocardiograms, cardiac enzymes and/or autopsy.
Statistical analysis
The sex-specific mean values and proportions of the baseline characteristics according to the quintiles of non-alcoholic beverages intake (< 367, 367–599, 600–804, 805–1317, and ≥ 1318 ml/d in men, and <353, 354–599, 600–782, 782–1319, and ≥ 1320 ml/d in women) were calculated, and the differences in those variables across the increasing quintiles of non-alcoholic beverages intake were tested by the ANCOVA and χ 2 test.
The follow-up period was defined and the person-years of follow-up was calculated based on the period from the submission of the 5-year questionnaire (our baseline point) to either death, emigration, incident stroke or CHD event, or end of 2009 for Cohort I or end of 2012 for Cohort II, whichever came first. The Cox regression models were used to calculate the sex-specific hazard ratios (HR) with 95 % CI of the risk of incident CVD across the increasing quintiles of non-alcoholic beverages intake, in reference to the lowest quintile, after the adjustment for age (continuous), residential area, quintiles of BMI, smoking status, ethanol intake, histories of hypertension, diabetes and medication use for hypercholesteremia, employment status, physical activity (quintiles of MET), and level of perceived stress. We conducted a test for trends across the quintiles of non-alcoholic beverages intake by assigning the median values for each quintile and testing the significance of this variable. The probability values for the statistical tests were two-tailed and P < 0·05 was regarded as statistically significant. Because of the high contribution of green tea and coffee to non-alcoholic beverages in our study, we analysed the associations of non-alcoholic beverages from green tea, coffee and others, with the risk of CVD. As the analyses of the specific beverages bear multiple comparisons, we applied the Bonferroni correction to the P trend calculation; thus, by considering three subgroup analyses of three closely related cardiovascular outcomes, an α (type 1 error) <0·006 instead of 0·05 was used to indicate statistical significance. The SAS statistical package (version 9.4, SAS Institute Inc.) was used for the analyses.
Results
Table 1 shows the sex-specific age-adjusted risk characteristics of the participants according to quintiles of non-alcoholic beverages intake. In both men and women, compared with the participants in the lowest quintile of non-alcoholic beverages intake, those in the highest quintile were more likely to smoke and to be physically active, had lower mean BMI and alcohol consumption, and were less likely to have hypertension or diabetes. Men in the highest quintiles of non-alcoholic beverages intake were more likely to have high mental stress and less likely to use medication for hypercholesteremia, while women in the highest quintile were younger compared with those in the lowest quintile of non-alcoholic beverages intake. Green tea composed 59·3 % in men and 68·5 % in women of fluids from non-alcoholic beverages, followed by coffee (22·2 % and 15·0 %) and other beverages (18·5 % and 16·5 %).
Table 1. Sex-specific age and age-adjusted risk characteristics according to quintiles of non-alcoholic beverages intake

MET, metabolic equivalent.
*P < 0·001, †P < 0·05, ‡P < 0·01, compared with the lowest quintile of non-alcoholic beverages intake.
P-values were calculated by ANCOVA for continuous variables and χ 2 for categorical variables.
During the median 13·6-year follow-up of 36 277 men and 41 130 women, there were 4578 (2784 in men and 1794 in women) incident cases of total CVD including 2179 and 1572 total strokes (ischaemic stroke: 1435 and 876, haemorrhagic stroke: 744 and 696), and 605 and 222 CHD.
Age- and multivariable-adjusted HR (95 % CI) of incident stroke and its types, CHD, and total CVD according to the quintiles of non-alcoholic beverages intake are shown for men (Table 2) and women (Table 3). The higher non-alcoholic beverages intake was associated with reduced risks of stroke and total CVD in both men and women; the multivariable HRs (95 % CIs) were 0·82 (0·71, 0·93; P trend = 0·005) and 0·86 (0·76, 0·97; P trend = 0·02), respectively, in men and 0·73 (0·63, 0·86; P trend = 0·003) and 0·75 (0·65, 0·87; P trend = 0·005), respectively, in women. Similar inverse trends were observed for stroke types in both sexes; the multivariable HRs (95 % CIs) of ischaemic and haemorrhagic strokes in the highest v. lowest quintiles of non-alcoholic beverages intake were 0·83 (0·71, 0·98; P trend = 0·02) and 0·79 (0·63, 0·99; P trend = 0·11), respectively, in men and 0·72 (0·58–0·89; P trend = 0·02) and 0·75 (0·59, 0·95; P trend = 0·07), respectively, in women. There was no association between non-alcoholic beverages intake and risk of CHD in either men or women; the multivariable HRs (95 % CIs) were 1·04 (0·80, 1·35; P trend = 0·80) in men and 0·87 (0·58, 1·29; P trend = 0·87) in women.
Table 2. Stroke and its types, CHD and CVD according to quintiles of non-alcoholic beverages intake in men
(Hazard ratios and 95% confidence intervals)
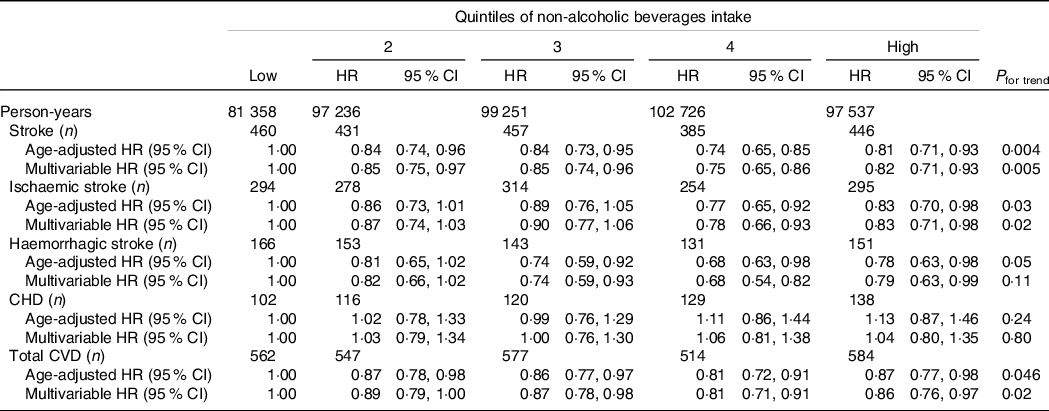
Multivariate adjustment: age, area, BMI, smoking status, alcohol consumption status, employment status, physical activity, level of perceived stress, and history of hypertension, diabetes mellitus, and medication use for hypercholesteremia.
Table 3. Stroke and its types, CHD and CVD according to quintiles of non-alcoholic beverages intake in women
(Hazard ratios and 95% confidence intervals)
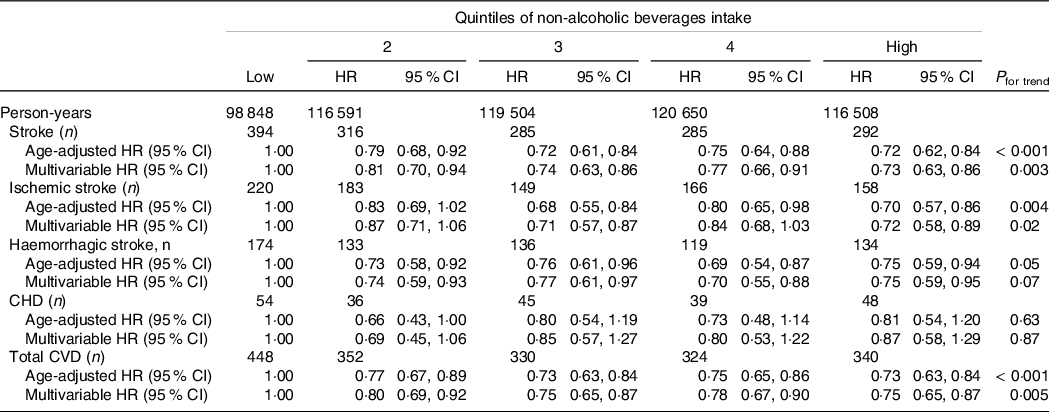
Multivariate adjustment is same as shown in Table 2.
As shown in Tables 4 and 5, we examined the association between the intake of green tea, coffee and other beverages with the risk of CVD. In these analyses, the type 1 error was set to 0·006. The intake of green tea was associated with reduced risks of stroke and total CVD in both men and women; the multivariable HRs for the highest v. lowest quintiles of green tea intake were 0·79 (0·69, 0·91; P trend = 0·001) and 0·84 (0·75, 0·95; P trend = 0·004), respectively, in men and 0·71 (0·60, 0·83; P trend < 0·001) and 0·74 (0·64, 0·86; P trend < 0·001), respectively, in women. There were no associations between the intakes of coffee or other beverages with the risk of CVD in either sex.
Table 4. Stroke, CHD and total CVD according to quintile of green tea and coffee intakes in men
(Hazard ratios and 95 % confidence intervals)
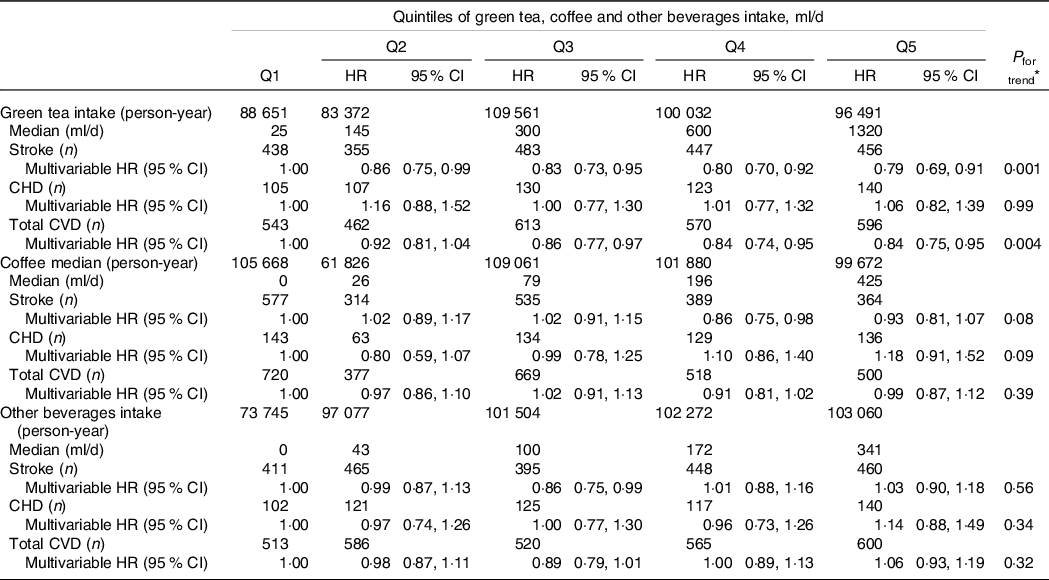
Multivariate adjustment is same as shown in Table 2.
* Type 1 error (α) < 0.006 was set as indicator of statistical significance.
Table 5. Stroke, CHD and total CVD according to quintile of green tea and coffee intakes in women
(Hazard ratios and 95 % confidence interval)
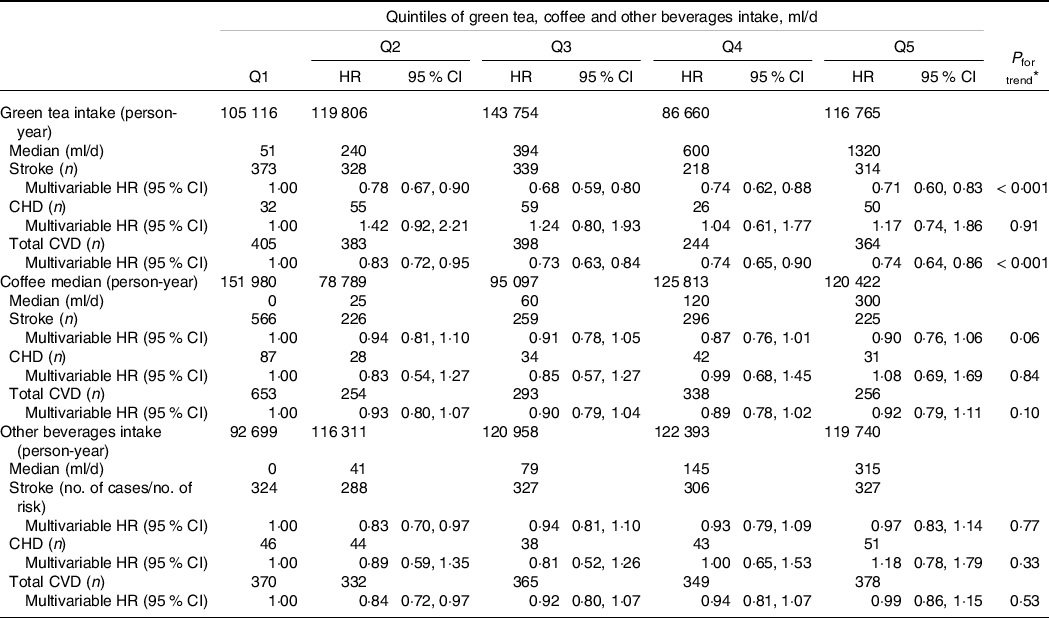
Multivariate adjustment is same as shown in Table 2.
* Type 1 error (α) < 0·006 was set as an indicator of statistical significance.
Discussion
During the median 13·6-year follow-up, we found that higher intakes of non-alcoholic beverages were associated with reduced risks of stroke and total CVD in both men and women. To our best knowledge, this is the first study to assess the association between the intake of non-alcoholic beverages and the risk of incident CVD in Asians. The association between the intake of non-alcoholic beverages and the risk of CVD was mainly attributable to green tea consumption.
Fluid intake and risk of total CVD in previous studies
Previous studies have examined the associations between total fluid intake from foods and beverages (including alcohol) and risk of mortality from CVD, but the findings were inconsistent(Reference Chan, Knutsen and Blix6,Reference Wu, Chen and Liaw8,Reference Cui, Iso and Eshak12,Reference Palmer, Wong and Iff13) . Among 3858 Australian men and women aged ≥ 49 years and followed up for 13·1 years in the Blue Mountains Eye Study, there was no association between intake of fluid from foods and beverages (including alcohol) and mortality from CVD and all causes; the multivariable HRs (95 % CIs) in the highest v. lowest quartiles of intake were 0·91 (0·70, 1·19) and 0·91 (0·68, 1·21), respectively(Reference Palmer, Wong and Iff13). Similarly, in the NHANES III study, the multivariable HR (95 % CI) of incident CVD associated with daily total fluid intakes ≥ 3576 ml in reference to < 2147 ml was 0·88 (0·69, 1·12; P trend = 0·30) among 1249 participants without chronic kidney disease and 0·83 (0·64, 1·12; P trend = 0·24) among 933 participants with chronic kidney disease(Reference Wu, Chen and Liaw8). On the other hand, Japanese men and women with higher intakes of total fluid from foods and beverages (including alcohol) had lower mortality from total CVD, when compared with those in the lowest intake quintile; the multivariable HRs (95 % CIs) in the highest quintile were 0·88 (0·72, 1·07; P trend = 0·03) in men and 0·79 (0·66, 0·95; P trend = 0·10) in women(Reference Cui, Iso and Eshak12). On the contrary, intakes of fluid from foods and non-alcoholic beverages were associated with the increased risk of fatal coronary events in women but not in men of the Adventist Health Study; the multivariable HRs (95 % CIs) for ≥ 5 glasses/d v. ≤ 2 glasses/d were 3·32 (1·18, 9·30; P trend = 0·02) and 1·34 (0·59, 3·04; P trend = 0·70), respectively(Reference Chan, Knutsen and Blix6). The different findings from these previous studies might be attributed to whether alcohol intake was added to the total fluid intake or not.
Fluid intake and risk of stroke and CHD in previous studies
The Netherlands Cohort Study reported no significant associations between the total fluid intake (including alcohol) and mortality from stroke or CHD: the multivariable HRs (95 % CIs) of stroke and CHD deaths associated with daily intakes of > 2000 ml total fluid in reference to 0–1000 ml were 0·77 (0·45, 1·30; P trend = 0·45) and 1·03 (0·73, 1·47; P trend = 0·91), respectively, in men and 0·49 (0·19, 1·24; P trend = 0·23) and 1·04 (0·67, 1·61; P trend = 0·46), respectively, in women(Reference Cui, Iso and Eshak12). Whereas, the Japan Collaborative Cohort Study of 22 939 men and 35 362 women aged 40–79 years during the 19·1-year follow-up reported that the highest intake quintile of total fluid intake from foods and beverages (including alcohol) had a lower risk of mortality from ischaemic stroke and CHD compared with those in the lowest quintile in women but not in men; the respective multivariable HRs (95 % CIs) were 0·89 (0·60, 1·31) and 0·81 (0·54, 1·21), respectively, in men and 0·70 (0·47, 0·99) and 0·60 (0·39, 0·93), respectively, in women(Reference Cui, Iso and Eshak12).
Specific beverages intake and risks of stroke and CHD in previous studies
A meta-analysis of 9 cohort studies including 259 267 individuals reported that persons who drank 1–3 cups/d compared with < 1 cup/d of green tea had reduced risks of stroke and CHD: the overall odds ratios (95 % CIs) were 0·64 (0·47, 0·86) and 0·81 (0·67, 0·98), respectively(Reference Pang, Zhang and Zheng23). Another meta-analysis of 1 279 804 participants reported a non-linear association between coffee consumption and risk of CVD: the lowest risk was observed at 3–5 cups/d compared with 0 cups/d with the summary relative risk (95 % CI) of 0·89 (0·84, 0·94)(Reference Ding, Bhupathiraju and Satija24). There was a positive association between sugar-sweetened beverages intake with risks of CHD(Reference Yin, Zhu and Malik25) and ischaemic stroke(Reference Eshak, Iso and Kokubo26), and a weak inverse association between pure fruit juice and risk of CVD(Reference Scheffers, Boer and Verschuren27).
Mechanisms for non-alcoholic beverages intake and CVD
The suggested mechanisms explaining the reduced risk of CVD associated with higher intakes of total non-alcoholic beverages could be the same anti-hypohydration effect and involvement in the role of the vasopressin system as those of total fluid intake. Hypohydration-initiated high blood viscosity(Reference Beijering, Gips and Huizenga28) was associated with an increased risk of CHD in the 8-year follow-up of 933 German men aged 45–64 years; the multivariable HR (95 % CI) in the highest v. lowest quintiles of blood viscosity was 2·68 (1·48, 4·88)(Reference Koenig, Sund and Filipiak29). The NHANES indicated that persons with larger total fluid intake had healthier lifestyles, such as being physically active and consuming high-fibre and low-sugar diets(Reference Kant, Graubard and Atchison30). In addition, the major sources of non-alcoholic beverages in the present study were the green tea and coffee, which were associated with reduced risks of diabetes(Reference Iso, Date, Wakai and Fukui31,Reference Kato, Noda and Inoue32) and CVD(Reference Ding, Bhupathiraju and Satija24,Reference Saito, Inoue and Sawada33) . Polyphenolic compounds in green tea such as catechins and caffeine with other polyphenols in coffee could have played preventive roles against oxidation, inflammation, thrombogenic prefiltration and hypertension(Reference Velayutham, Babu and Liu34,Reference Hu, Wang and Zhang35) as well.
Strengths and limitations
Strengths of our study include its prospective design, the use of a validated FFQ, the consistent endpoint determination and its large sample size from community residents. Limitations of the current study are as follows: first, the assessment of non-alcoholic beverage intake was done only at the baseline. If the participants have changed their drinking habits, their intake of non-alcoholic beverages might have changed during the follow-up period. However, the rank distributions of the participants according to their intake of non-alcoholic beverages did not vary substantially between the 5-year and 10-year surveys. A total of 71·6 % of the participants remained in the same quintile of intake (34·1 %) or slightly changed their intake by one quintile (37·5 %), while only 2·7 % of the participants have changed their intake by the extreme (lowest to highest and highest to lowest quintiles). The mean of the total intake of non-alcoholic beverages estimated from the 5-year survey was 832 (se 608) ml/d and that from the 10-year survey was 939 (se 722) ml/d. Second, higher intakes of non-alcoholic beverages could be a coincidence of healthier lifestyle; thus, the observed associations could be attributed to other factors; however, we have adjusted for a wide range of factors that could confound the association such as the level of physical activity, BMI, and intakes of energy and other dietary factors. The state of the kidney function was suggested to have a role not only in the fluid metabolism but also in the association with the risk of CVD(Reference Popkin, D’Anci and Rosenberg36); we did adjust for the history of renal disease; however, we did not have data on the estimated glomerular filtration rate or other kidney function tests of our participants. Third, non-alcoholic beverages comprise a wide range of drinks including potentially healthy and unhealthy (sugary) drinks, and the proportions of such drinks to the total intake of non-alcoholic beverages vary from population to population. In the present study, green tea composed more than 60 % of the non-alcoholic beverages, while coffee and other beverages represented 19 and 17 %, respectively, in our study.
In conclusion, the risks of stroke and total CVD were lower with higher non-alcoholic beverages intake in Japanese men and women.
Acknowledgements
This study was supported by National Cancer Center Research and Development Fund grants (since 2011) and a Grant-in-Aid for Cancer Research from the Ministry of Health, Labour and Welfare of Japan (from 1989 to 2010).
C. R., I. H., E. S. E and the JPHC Study Group designed the research; C. R. conducted the analyses and prepared the manuscript; I. H., E. S. E., M. K., I. J., T. R., S. N. and T. S. made critical revisions of the manuscript; and C. R. and I. H. had primary responsibility for final content. All authors read and approved the manuscript.
The authors declare that there are no conflicts of interest.


