


Acute kidney injury (AKI) is a severe hospital-acquired condition caused by a range of factors in various clinical settings and is associated with kidney function deterioration and increased mortality(Reference Coca, Yusuf and Shlipak1). The worldwide annual incidence of AKI is approximately 2100/million worldwide(Reference Rossaint and Zarbock2), and the number of AKI-caused deaths is approximately 2 million(Reference Chawla, Bellomo and Bihorac3), of which 20–25 % are inpatients; in particular, critical AKI has a mortality rate of more than 50 % during dialysis treatment(Reference Silver and Chertow4). Despite advances in renal replacement therapy technologies, patients with AKI still face a high risk of sequelae, including irreversible acute damage with the possibility of progression to chronic kidney disease (CKD) and other complications(Reference Coca, Singanamala and Parikh5,Reference Chawla, Eggers and Star6) . In view of the lack of effective predictive factors, active treatment and unpredictable prognoses associated with AKI, prevention and risk factor management remain critical.
Malnutrition is defined as any nutritional imbalance, which is a major complication in hospitalised patients and increases the length of stay (LOS), healthcare costs and mortality(Reference Curtis, Bernier and Jeejeebhoy7–Reference Makhija and Baker11). The prevalence of malnutrition is 15–80 % in hospitalised patients, while only 3 % could be diagnosed and treated(Reference Hartz, Stroup and Bibelnieks8,Reference Malone and Hamilton12) . It has been reported that over 40 % of CKD patients are undernourished(Reference Borek, Chmielewski and Malgorzewicz13) and uraemia and dialysis can impact the nutritional status of patients with kidney disease(Reference Xia, Healy and Kruger14,Reference MacLaughlin, Twomey and Saunt15) . AKI as the spread of inflammatory processes from the kidney to other organ systems is also affected by metabolic changes and undernutrition. Therefore, undernourished patients are more vulnerable to AKI(Reference Fiaccadori, Maggiore and Cabassi16) and many factors such as hypoproteinaemia and insulin resistance are involved in this progression(Reference Fiaccadori, Cremaschi and Regolisti17). Good nutritional support has been advocated in AKI, whether treated with or without RRT. In animal experiments, enteral v. parenteral nutrition has been shown to alleviate AKI(Reference Mouser, Hak and Kuhl18) and increased protein intake reduces tubular injury(Reference Pons, Plante and LeBrun19,Reference Roberts, Black and Zaloga20) . In patients with acute renal failure, protein and amino acids augment renal perfusion and improve renal function(Reference Abel, Beck and Abbott21). A randomised controlled trial studying the effects of daily intravenous amino acid supplementation in critically ill patients showed a significant increase in estimated glomerular filtration rate in the treatment group(Reference Doig, Simpson and Bellomo22). However, the nutrition status is often neglected in AKI patients; therefore, accurate determination of nutritional status and providing nutritional support remain a challenging task in the treatment of AKI(Reference Fiaccadori, Regolisti and Maggiore23,Reference Fiaccadori, Sabatino and Morabito24) .
The Nutritional Risk Screening 2002 (NRS-2002), developed by the European Society for Clinical Nutrition and Metabolism (ESPEN)(Reference Kondrup, Allison and Elia25), has been widely used in clinical malnutrition screening and validated for assessing the nutritional status of patients for nutritional intervention in a variety of diseases(Reference Peng, Chen and Tang26,Reference Inoue, Misu and Tanaka27) including CKD(Reference Borek, Chmielewski and Malgorzewicz13,Reference Tan, Long and Fang28) . The NRS-2002 was composed of a score for impaired nutritional status, a score for the severity of disease and an additional score if age ≥70 years(Reference Kondrup, Allison and Elia25), which recognise malnutrition if total score of NRS-2002 ≥3(Reference Kondrup, Allison and Elia29). Those NRS-2002 components such as low BMI, major abdominal operation and intensive care admission are also recognised risk factors for the occurrence of AKI; however, the relationship between the entirety NRS-2002 and AKI is unknown. Therefore, the aim of the present study was to (1) study the amounts of malnutrition in AKI patients, (2) investigate the relationship between NRS-2002 and AKI and (3) assess the ability of NRS-2002 and AKI to predict prognosis in hospitalised patients, all of which will contribute to the prediction, prevention and treatment of AKI.
Materials and methods
Study design and procedure
This is a retrospective propensity score matching (PSM) study which includes all hospital admissions except obstetrics departments. A total of 430 000 inpatients from five institutions admitted between 1 June 2012 and 31 December 2017 were enrolled in the present study. Fig. 1 describes the selection of patients in the final analysis, and 46 549 consecutive inpatients were eligible. Patients were excluded if they met one of the following characteristics:
(1) Patients with age <18 years old.
(2) Patients with hospitalisation <24 h.
(3) Patients with less than twice serum creatinine (Scr) test.
(4) Patients requiring dialysis before or after hospitalisation.
(5) Patients with missing data elements which needed further analysis.
Fig. 1. Flow diagram of patient selection. KDIGO, Kidney Disease Improving Global Outcomes; AKI, acute kidney injury; NRS-2002, Nutritional Risk Screening 2002; eGFR, estimated glomerular filtration rate.
The present study was approved by the Institutional Review Board (IRB, QDFY WZ 2018-9-13) to screen out those patients with qualifying Scr levels. All subjects were treated with standard care without intervention from the present study and followed up for 5–63 months until 1 January 2019, with a median time of 14 months. Clinical data were obtained via electronic medical records and a database review and were de-identified (patient names were replaced with the identification code, and private patient information was deleted before analysis) to protect patient privacy. IRB supervised the entire de-identified process; thus, each patient’s informed consent is waived.
All patients underwent malnutrition risk screening by using the NRS-2002 within the first 24 h after admission. Complete blood counts, blood chemistry analyses and urine tests were performed within 3 d of admission. In addition, necessary information including demographic characteristics (sex, age and BMI), inpatient department (medical, surgical, oncology, gynaecology or intensive care unit) and hospitalisation-related factors (LOS, surgery and number of deaths) was collected. Patients’ co-morbidities (hypertension, diabetes mellitus, CHD and CKD) were all defined according to International Classification of Diseases (ICD) 10th Revision (https://apps.who.int/iris/handle/10665/42980) in our hospital. The information was extracted from an electronic clinical letter via regular expression matching.
Diagnostic criteria
The diagnostic classification and criteria of AKI were based on Kidney Disease: Improving Global Outcomes 2012 as follows: (1) Scr level >26·5 mmol/l within 48 h; (2) an increase in Scr to more than 1·5-fold the baseline-confirmed value or an increase presumed to have occurred within 7 d or (3) urine output <0·5 ml/kg per h for more than 6 h. AKI staging was defined according to the Kidney Disease: Improving Global Outcomes guidelines. Baseline Scr was defined as the first Scr value measured during hospitalisation. The AKI diagnosis time was established once the participants first met the Kidney Disease: Improving Global Outcomes criteria. The baseline-estimated glomerular filtration rate was calculated using the CKD–Epidemiology Collaboration formula(Reference Levey, Stevens and Schmid30).
Nutritional status during hospitalisation was evaluated by the NRS-2002 scale, which consists of a score for impaired nutritional status, a score for the severity of disease and an additional score if age ≥70 years. Additionally, impaired nutritional status is scored from 0 to 3 according to changes in BMI, weight and food intake. The severity of disease is scored from 0 to 3 based on different kinds of diseases according to the individual medical history and age records. Moreover, an additional 1 point should be added to the total score for patients aged over 70 years. A total score of ≥3 indicated nutritional impairment. The NRS-2002 was validated in the Chinese population(Reference Jie, Jiang and Nolan31,Reference Zhang, Wang and Jiang32) .
Statistical analysis
We choose an empirical threshold that indicators with more than 15 % missing values were excluded from data. In addition, indicators with less than 15 % missing values warranted interpolation by multiple imputation using the mice package(Reference Zhang33), and all model variables were considered simultaneously. We assumed that the data were missing at random(Reference Ibrahim, Chu and Chen34); therefore, we performed predictive mean matching(Reference Schafer and Graham35) to generate five complete imputed data sets that fit the logistic models. Sample size calculation showed that an estimated 442 AKI-free events would be needed to provide 90 % power for detecting a minimum clinically meaningful OR of 0·64 for NRS-2002 scores <3 relative to NRS-2002 scores ≥3 with a two-sided α of 0·05. Continuous variables were transformed into categorical variables based on recognised cutoff values.
To account for measurement confounding, we performed 1:1 rate PSM based on selected covariates using logistic regression with a caliper of 0·2 of the standard deviation(Reference Austin36). The PSM was performed for the NRS-2002 scores <3 and ≥3 matched patients and stratified by the baseline characteristics and other variables related to hospitalisation, such as the inpatient department, surgery and concomitant drugs. Forward stepwise regression analyses were performed to select adjusted indicators for logistics and Cox regression models. The Kaplan–Meier method was used to study the effects of NRS-2002 and AKI on short- and long-term prognosis among the inpatients, whereas the Mantel–Haenszel log-rank test was performed to evaluate differences among the groups classified by the NRS-2002 and AKI stage. The results were compared using the χ 2 test or Fisher’s exact test. Continuous variables were compared using a t test or the Mann–Whitney U test for variables with a non-normal distribution. The AUC of the receiver operating characteristics was compared by using the DeLong method. All analyses were performed using R version 3.4.2 (http://www.r-project.org/).
Results
Patient characteristics and propensity score matching
In total, 46 549 consecutive inpatients were eligible for final analysis, in which 7175 (15 %) patients had AKI and 39 374 (85 %) patients were AKI-free. Before PSM, 37 190 (80 %) and 9359 (20 %) patients had NRS-2002 scores <3 and ≥3, respectively. The patients with NRS-2002 scores ≥3 had higher concentrations of leucocytes, aspartate aminotransferase and alanine aminotransferase but lower Hb and estimated glomerular filtration rate and had increased use of antibiotics and surgical operation than those in the NRS-2002 scores <3 group (Table 1). Additionally, the incidence of AKI was 31 % in the NRS-2002 scores ≥3 group, which was higher than 12 % in the NRS-2002 scores <3 group. The NRS-2002 scores (3·2 (sd 1·6) v. 2·5 (sd 1·1), P < 0·05) in AKI group as well as the components nutrition score and disease severity score are higher than those without AKI (online Supplementary Table S1). Therefore, patients with scores ≥3 or AKI seemed to be more likely to suffer severe disease and worse liver or kidney function.
Table 1. Characteristics of inpatients before and after propensity score matching
(Mean values and standard deviations; numbers of patients and percentages)

NRS-2002, Nutritional Risk Screening 2002; ALB, albumin; PLT, platelet; ALT, alanine transaminase; AST, aspartate aminotransferase; UA, uric acid; eGFR, estimated glomerular filtration rate; ACEI, angiotensin-converting-enzyme inhibitors; ARB, angiotensin II receptor blockers; CCB, Ca channel blockers; NSAID, non-steroidal anti-inflammatory drugs; ICU, intensive care unit; CKD, chronic kidney disease; DM, diabetes mellitus; HBp, hypertension; LOS, length of stay; AKI, acute kidney injury.
* Age, BMI, ALB and AKI were not used for covariate balance.
To eliminate this bias, we used PSM to match two more comparable 1:1 rate cohorts. After PSM, NRS-2002 scores <3 and ≥3 groups were well balanced on most characteristics, except the incidence of AKI which was still higher in the NRS-2002 scores ≥3 group than in the <3 group (29 v. 16 %, P < 0·05, Table 1). Moreover, we compared the short-term prognosis between NRS-2002 scores <3 group and ≥3 group after PSM. The results showed patients with NRS-2002 scores ≥3 had longer LOS (12·6 (sd 7·8) v. 10·4 (sd 6·2) d, P < 0·05), higher mortality rates (9·6 v. 2·5 %, P < 0·05) and higher rates of AKI than the patients with normal nutritional status (Table 2). Since NRS-2002 requires weekly assessment, we investigated the condition within 7 d after the NRS-2002 assessment and showed that the incidence of AKI in the NRS-2002 scores ≥3 group was higher than that in the NRS-2002 <3 group (18·73 v. 2·05 %, P < 0·05, Table 1), suggesting that NRS-2002 could also be associated with AKI during early hospitalisation.
Table 2. Nutritional Risk Screening 2002 (NRS-2002) and acute kidney injury (AKI) in first 7 d and whole hospitalisation after propensity score matching
(Numbers of patients and percentages; mean values and standard deviations)
LOS, length of stay.
Nutritional Risk Screening 2002 components are associated with acute kidney injury
To better identify whether malnutrition increases the risk of AKI and study the relationship of NRS-2002 components and AKI, both univariate and multivariate logistic regression were performed (Table 3). As a result, the total score of NRS-2002 showed a strong association with AKI, that is, the risk of AKI changed in parallel with the NRS-2002 score (P for trend <0·05, 0·67 AUC for the univariate model, 0·78 for the multivariate model), suggesting that undernutrition represents a major negative factor for AKI. In the NRS-2002 component, albumin (ALB) was the most important nutritional variable associated with AKI (AUC 0·67). Other parts of the NRS-2002, such as the severity of disease (AUC 0·63), impaired nutritional status (AUC 0·59) and age (AUC 0·539), all slightly contributed to the risk of AKI but were not as significant as the total score of the NRS-2002 (Table 3). Moreover, we studied the relationship between NRS-2002 and AKI in different clinical situations. The results showed these associations are constant across different sex, surgical status and history of diabetes mellitus and hypertension, indicating a good generalisability association that undernutrition increases the risk of AKI (Fig. 2).
Table 3. Logistic regression model including variables associated with malnutrition as assessed by the Nutritional Risk Screening 2002 (NRS-2002) and corresponding risk for acute kidney injury (AKI)
(Odds ratios and interquartile ranges (IQR))

* The logistic regression model was adjusted by serum creatinine, antibiotic, Ca channel blockers, angiotensin-converting-enzyme inhibitors, aspartate aminotransferase, HDL, surgery, plasma fibrinogen, non-steroidal anti-inflammatory drugs, diabetes mellitus and chronic kidney disease.
Fig. 2. Distributions and odds ratios of Nutritional Risk Screening 2002 (NRS-2002) for acute kidney injury (AKI) by using restricted cubic splines among 46 549 inpatients. Logistic regression analysis with restricted cubic spline functions displayed a significant association of change in NRS-2002 with AKI in different clinical settings. (a) All patients; (b) non-surgery; (c) surgery; (d) non-hypertension; (e) hypertension; (f) non-diabetes; (g) diabetes; (h) male; (i) female.
Both acute kidney injury and malnutrition increased the risk of mortality
We further study the effects of NRS-2002 and AKI on short- and long-term mortality. Patients with NRS-2002 scores <3 achieved significantly better long-term survival than those with higher scores (P < 0·05), suggesting that malnutrition was associated with adverse prognosis of inpatients (Fig. 3(a)). Similarly, AKI during hospitalisation significantly reduced survival, and survival worsened in patients with higher AKI stages (Fig. 3(b)). Therefore, both malnutrition identified by NRS-2002 and AKI were negative prognostic factors for short- and long-term survival. Moreover, the risk of mortality of non-AKI patients with NRS-2002 scores ≥3 was higher than that of patients with NRS-2002 scores <3 (HR 6·47, 6·06–6·90, P < 0·05). Similar outcomes were noted in AKI patients with NRS-2002 scores <3 (HR 6·74, 6·28–7·24, P < 0·05), and AKI patients with NRS-2002 scores ≥3 had the worst prognosis as expected (HR 24·8, 23·3–26·3, Fig. 3(c), Table 4), suggesting that NRS-2002 scores ≥3 or AKI was associated with higher risk of mortality of patients. Furthermore, we studied the predictive ability of AKI and NRS-2002 for mortality by using both univariate and multivariate Cox regression analysis. Univariate Cox regression (Table 4) showed that the NRS-2002 was strongly associated with long-term survival (AUC 0·79, P < 0·05) and was better than AKI (AUC 0·71, P < 0·05). The combination of the NRS-2002 and AKI exhibited higher accuracy than the individual variables (AUC 0·80, P < 0·05). However, multivariate Cox regression analysis revealed that the NRS-2002 scores were not the direct factor that increased mortality when the scores were ≥3 (Table 4). Since the death events of patients mainly occurred during hospitalisation, the short-term prognosis of patients was similar to the long-term prognosis (Fig. 3(d)–(f) and Table 4).
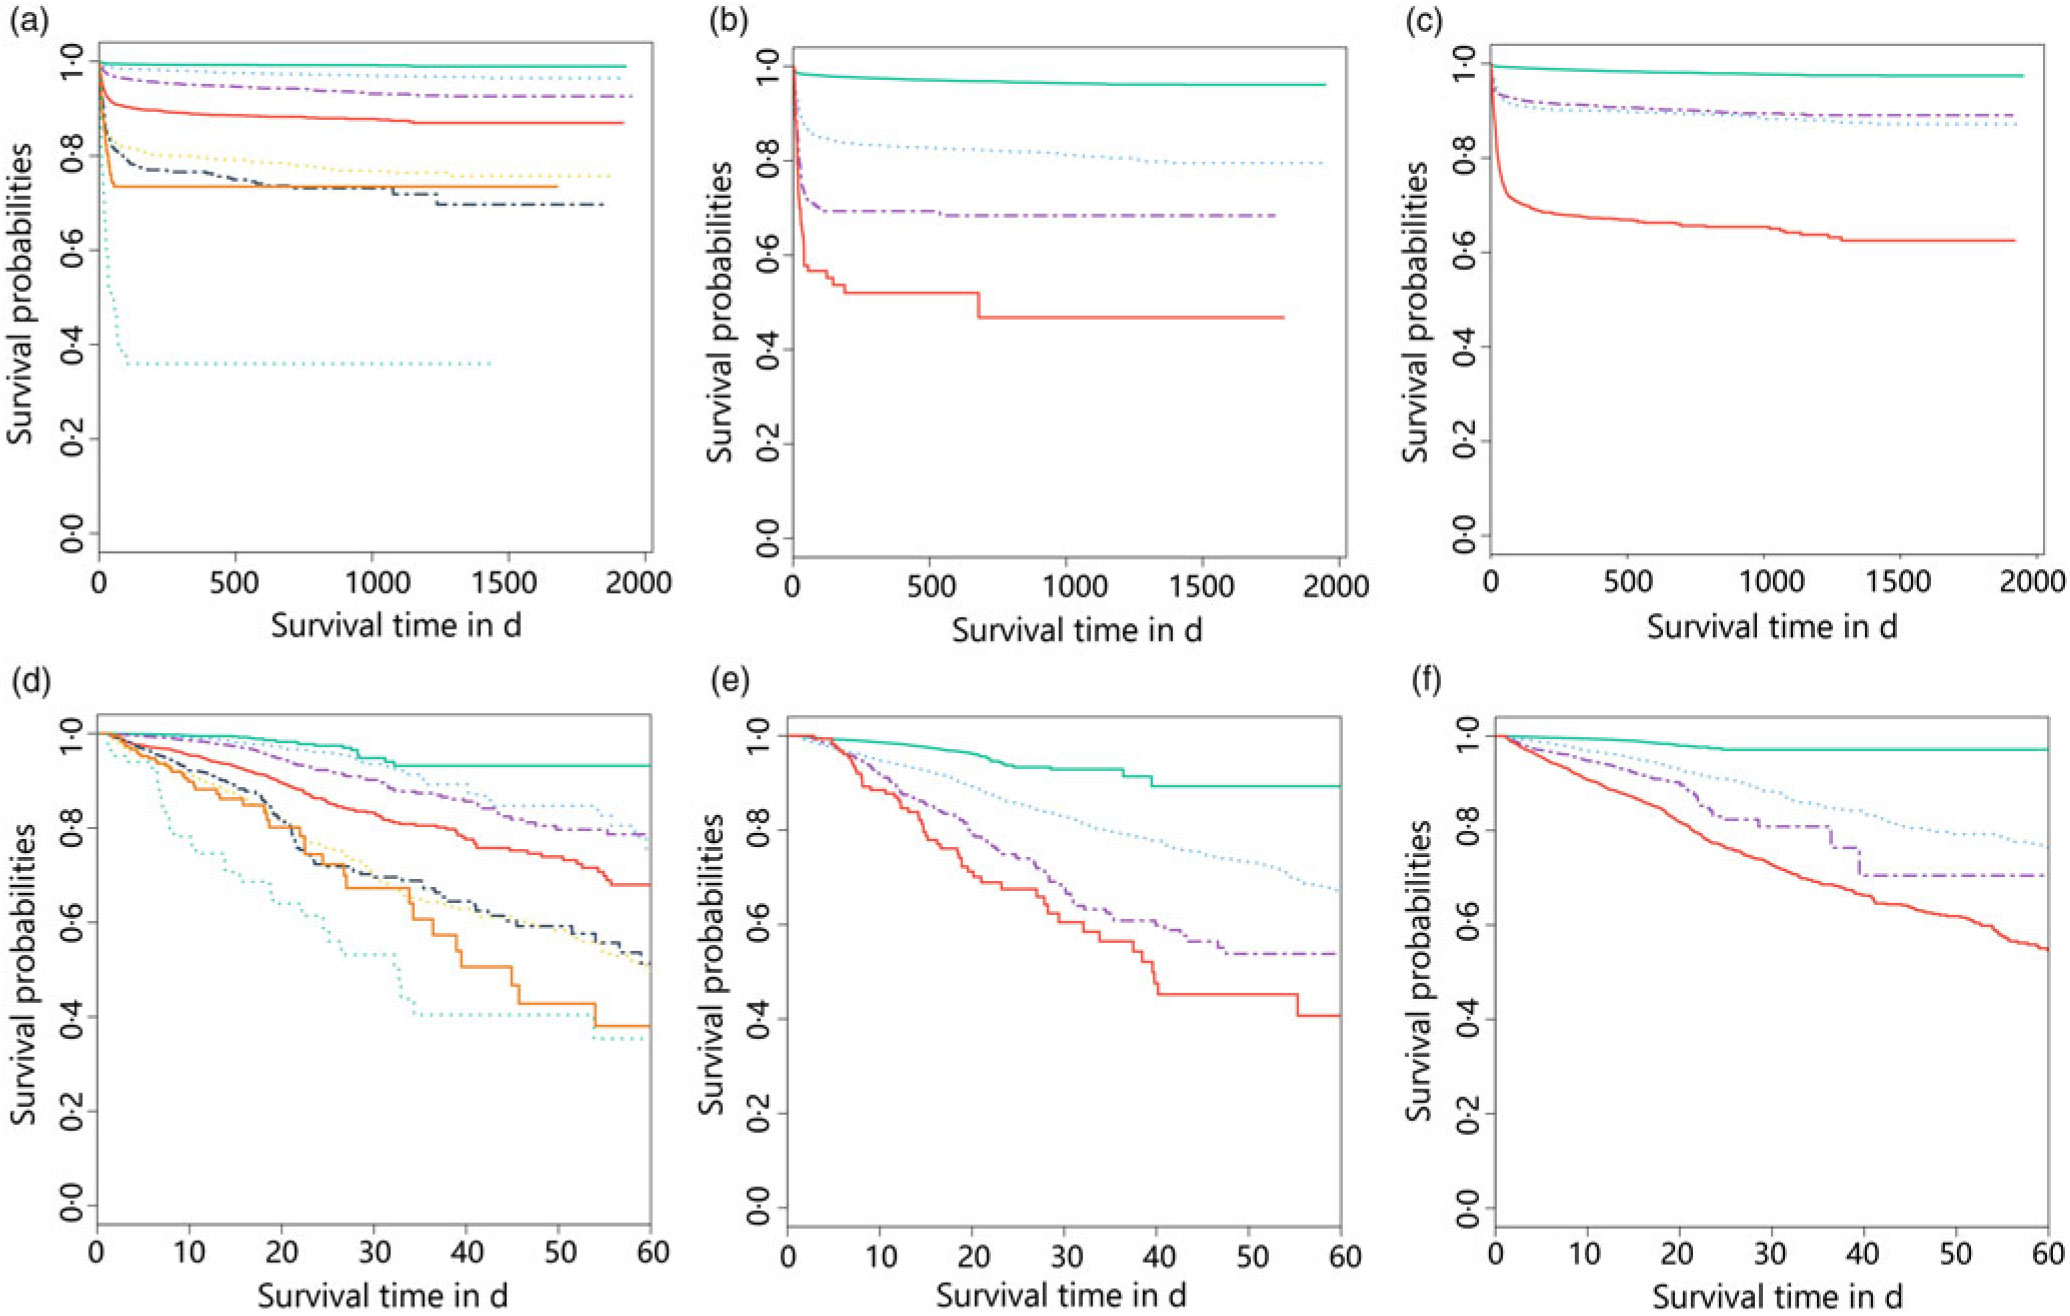
Fig. 3. Stratification of long- (a–c) and short- (d–f) term survival probabilities among patients in different Nutritional Risk Screening 2002 (NRS-2002) scores and acute kidney infection (AKI) stages. (a) NRS-2002: ![]() , 0;
, 0; ![]() , 1;
, 1; ![]() , 2;
, 2; ![]() , 3;
, 3; ![]() , 4;
, 4; ![]() , 5;
, 5; ![]() , 6;
, 6; ![]() , 7. (b) AKI stage:
, 7. (b) AKI stage: ![]() , 0;
, 0; ![]() , 1;
, 1; ![]() , 2;
, 2; ![]() , 3. (c) AKI and NRS-2002:
, 3. (c) AKI and NRS-2002: ![]() , nAKI and NRS-2002 < 3;
, nAKI and NRS-2002 < 3; ![]() , AKI and NRS-2002 ≥ 3;
, AKI and NRS-2002 ≥ 3; ![]() , nAKI and NRS-2002 < 3;
, nAKI and NRS-2002 < 3; ![]() , AKI and NRS-2002 ≥ 3. (d) NRS-2002:
, AKI and NRS-2002 ≥ 3. (d) NRS-2002: ![]() , 0;
, 0; ![]() , 1;
, 1; ![]() , 2;
, 2; ![]() , 3;
, 3; ![]() , 4;
, 4; ![]() , 5;
, 5; ![]() , 6;
, 6; ![]() , 7. (e) AKI stage:
, 7. (e) AKI stage: ![]() , 0;
, 0; ![]() , 1;
, 1; ![]() , 2;
, 2; ![]() , 3. (f) AKI and NRS-2002:
, 3. (f) AKI and NRS-2002: ![]() , nAKI and NRS-2002 < 3;
, nAKI and NRS-2002 < 3; ![]() , AKI and NRS-2002 ≥ 3;
, AKI and NRS-2002 ≥ 3; ![]() , nAKI and NRS-2002 < 3;
, nAKI and NRS-2002 < 3; ![]() , AKI and NRS-2002 ≥ 3.
, AKI and NRS-2002 ≥ 3.
Table 4. Adjusted and unadjusted Cox regression model of the association between Nutritional Risk Screening 2002/acute kidney infection (NRS-2002/AKI) and prognosis of patients
(Odds ratios and interquartile ranges (IQR))
* The Cox regression model was adjusted by aspartate aminotransferase, uric acid, β-blockers, medical, sex, leucocytes, Hb, proton pump inhibitors, antibiotic, oncology, non-steroidal anti-inflammatory drugs, lactate dehydrogenase, CHD, diabetes mellitus, and intensive care unit admission.
Discussion
Malnutrition screening is a simple and efficient tool for identifying the risk of malnutrition and helping patients receive timely and effective intervention in the hospital(Reference Kondrup, Allison and Elia25,Reference Stratton, Hackston and Longmore37) . Many nutrition screening tools are available, but European Society for Clinical Nutrition and Metabolism recommends the use of the NRS-2002 in hospitalised patients. However, European Society for Clinical Nutrition and Metabolism also recommends a malnutrition universal screening tool for adults in community settings and a mini nutritional assessment short form for older adults. Due to the lack of a gold standard tool for assessing the risk of malnutrition, different approaches have been used in published studies. However, the NRS-2002 is more flexible, accurate and straightforward for use in clinical practice. To the best of our knowledge, our study is the first to evaluate the association between the NRS-2002 and AKI in hospitalised patients and to estimate the ability of NRS-2002 and AKI in predicting prognosis.
Malnutrition and AKI are common complications in hospitalised patients and increase LOS and mortality, but the nutritional status of patients as it relates to AKI is poorly described in the literature. In our study, 46 549 inpatients from five institutions were enrolled between 1 June 2012 and 31 December 2017 and followed up for 5–63 months. The patients with NRS-2002 scores ≥3 had a greater risk of AKI and longer LOS and higher mortality rates than the patients with normal nutritional status, which was consistent with previous studies that undernourished patients were generally hospitalised longer and had lower survival rates(Reference Borek, Chmielewski and Malgorzewicz13,Reference Norman, Pichard and Lochs38) . Without effective intervention, AKI can develop irreversibly in patients with CKD and end-stage renal disease(Reference Coca, Singanamala and Parikh5) and increase mortality. Although many guidelines recommend a good nutritional support in AKI patients, the increase of metabolic work for nutritional support may aggravate AKI progress(Reference Joannidis, Druml and Forni39). Therefore, further investigation of the relationship of AKI and malnutrition is crucial.
Studies have demonstrated that malnutrition is related to poor prognosis in AKI, but no study has shown that malnutrition screening predicts the occurrence of AKI. Marina et al. enrolled 133 patients with a clinical diagnosis of AKI and identified that nutritional markers (a low energetic intake, higher C-reactive protein level, etc.) are significantly associated with a risk of death in AKI patients(Reference Berbel, Goes and Balbi40). Fiaccadori et al. assessed 309 patients with AKI based on subjective global assessment (SGA); the results showed that 58 % of patients had undernutrition and that severe undernutrition was associated with poor prognosis(Reference Fiaccadori, Lombardi and Leonardi41). Our research confirms that the malnutrition risk (NRS-2002 scores ≥ 3) is strongly associated with the development of AKI. The incidence of AKI was 29 % in the NRS-2002 scores ≥3 group, which was higher than 16 % in the NRS-2002 <3 group. Furthermore, malnutrition, hypoproteinaemia, abnormal BMI levels, diabetes mellitus, chronic lung disease and other disease are recognised risk factors leading to AKI(Reference Hoste, Kellum and Selby42). The individual factors are weak to predict the AKI, but as an entirety tool, NRS-2002 shows a robust ability to predict AKI. When the NRS-2002 score increased, the risk of AKI increased (0·67 AUC for the univariate and 0·78 for the multivariate model) and the association between the NRS-2002 and AKI was constant across different sex, surgical status and history of diabetes mellitus and hypertension, which suggests that the association between the NRS-2002 and AKI has good generalisability in different clinical settings. Thus, clinicians should continuously test Scr or other biomarkers in undernutrition patients to determine whether renal function is impaired, avoid the use of nephrotoxic drugs and maintain blood perfusion of the kidneys.
The NRS-2002 has good generality and accuracy in evaluating the risk of long-term and short-term mortality, but whether NRS-2002 scores ≥ 3 or AKI independently affects long-term mortality is unknown. Almeida et al.(Reference Almeida, Correia and Camilo43) compared the subjective global assessment and NRS-2002 in their validation study conducted with 300 surgical patients. The results showed that the NRS-2002 correctly identified 96 % of the patients at nutritional risk compared with subjective global assessment. The sensitivity and specificity values for the NRS-2002 were 0·8 (0·76–0·84) and 0·89 (0·84–0·92), respectively, thus successfully identifying risk. Our results showed that both the NRS-2002 and AKI had a dose–response relationship between their severity and the adverse effect on the short- and long-term survival of the patients, which is consistent with previous studies(Reference Berbel, Goes and Balbi40,Reference Shiao, Huang and Lai44,Reference Hobson, Yavas and Segal45) . AKI patients with NRS-2002 scores ≥ 3 had the worst prognosis (HR 24·8, 23·3–26·3) than non-AKI patients with NRS-2002 scores < 3 (HR 6·47, 6·06–6·90, P < 0·05) or AKI patients with NRS-2002 scores ≥ 3(HR 6·74, 6·28–7·24, P < 0·05), indicating that both malnutrition risk (NRS-2002 scores ≥ 3) and AKI are adverse to prognosis of patients. Univariate Cox regression analyses showed that the NRS-2002 and AKI have a significant association with short- and long-term survival, while multivariate analyses showed that NRS-2002 scores ≥ 3 were not the direct factor that increased mortality. Moreover, the NRS-2002 and AKI have synergy that better predict the long-term prognosis of patients with an AUC of 0·80, which is better than using either AKI (AUC 0·71) or NRS-2002 (AUC 0·79) alone. Our finding suggests that both NRS-2002 scores ≥ 3 and AKI can worsen the short- and long-term prognosis of patients and the prognosis of the malnourished patient who develops AKI is far worse than that of the patient with normal nutritional status; thus, good nutritional support has been advocated in AKI.
We also found that ALB was an important nutritional variable associated with AKI (AUC 0·67). Low ALB is a known predictor of poor outcomes, including renal dysfunction and mortality(Reference Engelman, Adams and Byrne46). Engelman et al. reported that hypoalbuminaemia was an independent risk factor for AKI after cardiac surgery(Reference Lee, Baek and Chin47), which was consistent with our results. Other parts of the NRS-2002 (impaired nutritional status, severity of disease and age) slightly contributed to the risk of AKI but were not as significant as the total score of the NRS-2002. High BMI increases the risk of AKI; however, our results showed that BMI was not associated with AKI (AUC 0·526). A previous study showed that patients with AKI and a BMI of 30–35 kg/m2 had a reduced risk of mortality during hospitalisation(Reference Druml, Metnitz and Schaden48). Furthermore, Qian et al. performed a meta-analysis including 2157 AKI cases and 49 777 controls, showing that BMI was not absolutely associated with AKI(Reference Yi, Li and Jian49). Therefore, due to the difficulty in determining the dry weight of patients, using BMI as a parameter of nutritional monitoring in association with AKI is questionable.
The present study has several limitations. First, our data were obtained from five institutions. Thus, future studies are needed to validate our results in a broader setting. Second, the urine output was recorded by patients’ family members, which was not accurate and excluded for further analysis in our study. Although we collected nearly all of the comprehensive indicators and used reasonable statistical methods to eliminate bias, variables with inaccurate and missing data, such as urine output, were not included in this analysis, which might have affected our results and the predictive efficacy of the model. Finally, Cox and logistic regression models are reliable classifications and prediction methods, but these approaches are not the best analytical methods considering the rapid development of machine learning such as Support Vector Machine and Deep-learning approach(Reference Esteva, Kuprel and Novoa50,Reference Esteva, Kuprel and Novoa51) , which may help attain better prediction results.
In conclusion, malnutrition is common among hospitalised patients and increases LOS and mortality. There is a strong association between NRS-2002 and AKI that the risk of AKI changed in parallel with the NRS-2002 score. Both AKI and NRS-2002 scores ≥ 3 can worsen the prognosis that the undernourished patients who develop AKI yield far worse prognosis than patients with normal nutritional status. Additional studies are required to determine whether the NRS-2002 can be used in cases of AKI in other institutions or countries.
Acknowledgements
This work was supported by the National Natural Science Foundation of China (81170688, 81470973, 81770679 and 81800601). No funding bodies had any role in study design, data collection and analysis, decision to publish or preparation of the manuscript.
C. Li conceived of the presented idea and contributed to study design, data analysis and interpretation. L. X., C. G. and L. Z. verified the analytical methods and statistical results, and contributed to the final version of the manuscript. C. Luo, B. Z, X. Z., J. W., J. Z., J. H., D. L., H. L. and X. M. are independent members who collected the data within 5 years. L. C., Y. W. and H. Z. contributed to the interpretation of the results. Y. X. is the senior author of this manuscript in charge of overall direction and planning. All authors provided critical feedback and helped shape the research, analysis and manuscript.
The authors declare that there are no conflicts of interest.
Supplementary material
For supplementary material referred to in this article, please visit https://doi.org/10.1017/S000711451900271X


