


Mg deficiency is known to disturb Zn metabolism. Mg deficiency increases the concentration of Zn in the liver(Reference Kimura, Itokawa, Itokawa and Durlach1–Reference Vormann, Gunther and Hollriegl3), while Zn concentration decreases in the testis(Reference Kimura, Itokawa, Itokawa and Durlach1) and the heart(Reference Mills, Broghamer and Higgins2). Although the liver plays a central role in the metabolism of Zn, it has not been clarified how Mg deficiency enhances Zn accumulation in the liver.
Metallothionein (MT) is a cysteine-rich, low-molecular-weight protein consisting of four isoforms. Isoforms MT-1 and MT-2 are expressed in the liver(Reference Andersen, Taplitz and Birren4) and are known to have diverse functions in Zn homeostasis and in protection against heavy metal toxicity and oxidative stress(Reference Vasák5). The expression of MT is up-regulated by metals, including Zn, and by oxidative stress in the liver(Reference Andrews6). Because Mg deficiency is known to induce oxidative stress in the liver(Reference Vormann, Gunther and Hollriegl3, Reference Calviello, Ricci and Lauro7, Reference Martin, Uring-Lambert and Adrian8), it has been speculated that oxidative stress caused by Mg deficiency would increase hepatic Zn concentration through the up-regulation of MT expression(Reference Vormann, Gunther and Hollriegl3).
Solute carrier family 39 members such as Zip1(Reference Jou, Hall and Philipps9), Zip5(Reference Wang, Kim and Petris10) and Zip14(Reference Liuzzi, Lichten and Rivera11) and solute carrier family 30 members such as ZnT1(Reference Langmade, Ravindra and Daniels12), ZnT5(Reference Kambe, Narita and Yamaguchi-Iwai13) and ZnT6(Reference Huang, Kirschke and Gitschier14) are expressed in the liver. Solute carrier family 39 members increase the cytosolic Zn concentration by importing Zn into the cytosol from the extracellular fluid or intracellular organelles, and solute carrier family 30 members decrease the cytosolic Zn concentration by promoting Zn efflux from the cytosol(Reference Lichten and Cousins15). Thus, these transporters affect Zn metabolism in the liver. However, the effect of Mg deficiency on the expression of Zn transporters has not been reported.
Mg frequently acts as a natural Ca antagonist(Reference Iseri and French16), and Ca deficiency has been reported to ameliorate some of the effects of Mg deficiency(Reference Bussiere, Gueux and Rock17). Therefore, simultaneous Ca and Mg deficiency possibly suppresses Zn accumulation observed in the liver of Mg-deficient animals.
We performed an investigation to clarify the effects of Mg and Ca deficiencies, and the effects of their interactions on the Zn concentration and the expression of MT and Zn transporters in the rat liver.
Materials and methods
Animals and diets
A total of twenty-four male-specific pathogen-free Sprague–Dawley rats aged 4 weeks were purchased from SLC Japan and cared for according to the Guide for the Care and Use of Laboratory Animals (Animal Care Committee, Kyoto University). The rats were individually housed in stainless-steel cages in a temperature-, humidity- and light-controlled room (24°C, 60 % and 12 h light–12 h dark cycle, respectively). All rats were fed the American Institute of Nutrition-93G (AIN-93G) diet(Reference Reeves18) for a 5 d adaptation period. Then, the animals were divided into four groups of six rats as a 2 × 2 factorial arrangement (two dietary Mg levels and two dietary Ca levels): one group was given the control diet, another group was fed a Mg-deficient (MGD) diet, another group was fed a Ca-deficient (CAD) diet and the remaining group was fed a Mg- and Ca-deficient (MCD) diet. These diets were prepared on the basis of the AIN-93G diet(Reference Reeves18) with the Mg- and Ca-free AIN-93G mineral premix. MgO was added at 26·1 mmol/kg for the control and CAD diets at the expense of maize starch. CaCO3 was added at 130 mmol/kg for the control and MGD diets and at 13 mmol/kg for the CAD and MCD diets. The dietary concentrations of Mg, Ca and Zn are shown in Table 1. The animals were pair-fed with their respective experimental diets adjusted to match the feed intake of the MGD group for 3 weeks. The rats were allowed free access to demineralised water during the experiment.
Table 1 Mineral concentration of the experimental diets (mmol/kg diet)
MGD, Mg-deficient; CAD, Ca-deficient; MCD, Mg- and Ca-deficient.
Data and sample collection
We measured feed intake and body weight during the experiment. Feed efficiency was calculated from the ratio of weight gain:feed intake. Inflammatory skin lesions were evaluated by the inflammatory score(Reference Loser, Hansen and Apelt19) with a slight modification based on the following criteria: 0 points, no skin lesion; 1 point, hyperaemia of one ear accompanied by swelling; 2 points, hyperaemia of both ears accompanied by swelling; 3 points, inflammation of one ear, including slough; 4 points, inflammation of both ears, including slough; 5 points, inflammation of both ears and tail.
Under isoflurane anaesthesia, a blood sample was obtained from the abdominal aorta with a plastic syringe at the end of the experiment. Serum was separated by centrifugation at 3000 g for 30 min at 4°C. The left femur was removed, cleaned of adhering tissues and weighed. The serum and femur samples were stored at − 20°C until analyses. The liver was promptly excised, weighed, washed with ice-cold isotonic saline, placed in liquid N2 and stored at − 80°C until analyses.
Determination of minerals, thiobarbituric acid-reactive substances and metallothionein protein
The liver, femur, serum and diet samples were wet-digested with trace element-grade HNO3 and H2O2 (Wako Chemicals). Then, we determined the Mg, Ca and Zn concentrations in the serum and tissue samples with an atomic absorption spectrophotometer (AA-6600F; Shimadzu).
The liver samples were homogenised in chilled saline and the homogenate was centrifuged at 105 000 g for 30 min at 4°C (CS100X; Hitachi Koki). The concentration of thiobarbituric acid-reactive substances (TBARS) in the supernatant was determined using a commercial kit (OXI-TEK TBARS Assay Kit; ZeptoMetrix) according to the instruction manual.
The total hepatic MT protein concentration was determined according to the Cd-Chelex method(Reference Bartsch, Klein and Summer20, Reference Kiyozumi, Sakaguchi and Shiozuka21). Briefly, the liver samples were homogenised in a 250 mm-sucrose solution on ice and centrifuged at 105 000 g for 60 min at 4°C. The supernatant was mixed with 0·55 mm-CdCl2 in 20 mm-Tris–HCl buffer (pH 8), incubated for 10 min at room temperature, and then heated at 100°C for 3 min. After cooling, the mixture was centrifuged at 8000 g for 10 min at 4°C. Then, 16 mg/ml of the ion-exchange resin (Chelex 100; Bio-Rad Japan) were added to the supernatant and shaken for 30 min. The resin and precipitate were removed by centrifugation at 8000 g for 10 min at 4°C. The Cd concentration in the supernatant was determined as the form binding to MT by an inductively coupled plasma mass spectrometer (Elan 6000; Perkin Elmer). The protein concentration of MT was calculated using a molecular weight of 6600 for MT and the assumption that 7 g of Cd atoms corresponds to 1 mol of MT(Reference Bartsch, Klein and Summer20).
RNA preparation and quantitative RT-PCR
Total RNA was extracted from the liver samples with TRIzol reagents (Invitrogen) according to the manufacturer's protocol. Absorbance at 260 nm was measured to quantify the RNA concentration, and simultaneously the ratio of absorbance at 260 nm to that at 280 nm was monitored to assess the purity of RNA. Quantitative RT-PCR was carried out as described previously(Reference Ishizaki, Kotani and Funaba22). The gene transcripts of MT-1, MT-2, Zip1, Zip5, Zip14, ZnT1, ZnT5, ZnT6 and glyceraldehyde-3-phosphate dehydrogenase (Gapdh) were amplified by complementary DNA-specific primers (Table 2). The relative levels of gene expression were normalised against the mRNA level of Gapdh.
Table 2 Sequence of the PCR primers for amplification
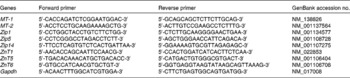
MT, metallothionein; Gapdh, glyceraldehyde-3-phosphate dehydrogenase.
Statistical analyses
Statistical analyses (except for the inflammation score) were performed using SAS statistical software (version 9.1; SAS Institute). Results are expressed as means with their standard errors. Data reflecting mRNA levels were log-transformed to provide an approximation of a normal distribution before the analysis. The data were analysed as a 2 × 2 factorial using the general linear model procedure. The statistical model included the main effects of dietary Mg, dietary Ca and their interaction. When an interaction was significant, the significant differences between means were evaluated using a multiple comparison procedure (Student–Newman–Keuls) or the significant difference between two means was evaluated using the two-sided t test. The inflammation score data are expressed as means with their standard errors, and a significant difference between groups was determined each day by the Steel–Dwass test(Reference Hollander and Wolfe23). When all rats in more than two groups had no inflammation, the data of one group were adopted as representative data in the statistical analysis because of methodological limitations. Statistical significance was considered to be P< 0·05.
Results
No skin lesions were observed in the control group and in the CAD group throughout the experiment. The inflammation score in the MGD group was significantly higher than that in the MCD group on day 4 (P< 0·05); this score peaked on day 5 and had essentially disappeared by day 13 (Fig. 1). Although two rats in the MCD group had a relatively high score on the last 2 d, the inflammation score did not differ significantly among the control, CAD and MCD groups throughout the experiment.
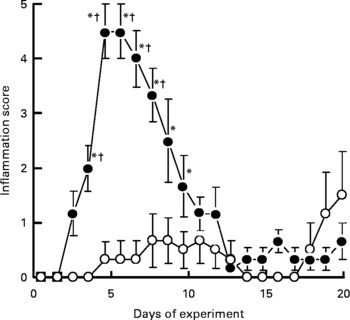
Fig. 1 Effects of magnesium and calcium deficiencies on the inflammation score in the skin of rats. Values are means, with their standard errors represented by vertical bars (n 6). * Mean values were significantly different from the control and the calcium-deficient groups (P< 0·05). † Mean values were significantly different from the magnesium- and calcium-deficient group (P< 0·05). Lesions were not observed in the control group and the calcium-deficient group throughout the experimental period. –●–, Magnesium-deficient group; –○–, magnesium- and calcium-deficient group.
The dietary treatments did not significantly affect the final body weight (Table 3). Ca deficiency and Mg deficiency did not affect the body-weight gain. However, the interaction between Ca and Mg deficiency was significant (P= 0·029). Body-weight gain did not differ among the control, CAD and MCD groups but it was significantly lower in the MGD group than in the other groups (P< 0·05). The dietary treatments did not affect feed intake because the animals were pair-fed. Therefore, feed efficiency was similarly affected as body-weight gain by the dietary treatments.
Table 3 Effects of magnesium and calcium deficiencies on growth parameters in rats* (Mean values with their standard errors, n 6)
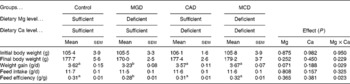
MGD, Mg-deficient; CAD, Ca-deficient; MCD, Mg- and Ca-deficient.
a,bMean values within a row with unlike superscript letters were significantly different (P< 0·05).
* When an interaction was significant, the significant differences among means were evaluated using the Student–Newman–Keuls test.
Serum Mg concentration was significantly decreased by Mg deficiency (P< 0·001) but was significantly increased by Ca deficiency (P< 0·001) (Table 4). The interaction between Ca and Mg deficiency was also significant (P= 0·008). Serum Mg concentration was significantly lower in the Mg-deficient groups than in the Mg-sufficient groups (P< 0·05). The CAD group had a significantly higher serum Mg concentration than the control group (P< 0·05). Although the multiple comparison analysis showed that serum Mg concentration did not differ significantly between the MCD and MGD groups, the Mg concentration was 40 % higher (P= 0·01 by t test) in the MCD group than in the MGD group. The dietary treatments did not affect serum Ca concentration. The dietary Ca concentration had a significant effect on serum Zn concentration (P< 0·001); Ca deficiency significantly increased serum Zn concentration. On the other hand, Mg deficiency did not affect serum Zn concentration and did not affect the increase in serum Zn concentration caused by Ca deficiency.
Table 4 Effects of magnesium and calcium deficiencies on mineral concentrations in serum and the amount of mineral in rat femur † (Mean values with their standard errors, n 6)
MGD, Mg-deficient; CAD, Ca-deficient; MCD, Mg- and Ca-deficient.
a,b,c,dMean values within a row with unlike superscript letters were significantly different (P< 0·05).
* Mean values were significantly different between the two groups (P= 0·01).
† When an interaction was significant, the significant differences among means were evaluated using the Student–Newman–Keuls test or the significant difference between two means was evaluated using the two-sided t test.
Ca deficiency significantly decreased the femoral weight (P= 0·009); however, Mg deficiency did not affect either the femoral weight or the reduction of femoral weight caused by Ca deficiency. The amount of femoral Mg was significantly decreased by either Mg or Ca deficiency (P< 0·001). The interaction between Ca and Mg deficiency was also significant (P< 0·001). The Mg-deficient groups had significantly smaller amounts of femoral Mg than the Mg-sufficient groups (P< 0·05). Femoral Mg was significantly lower in the CAD group than in the control group (P< 0·05). Additionally, the amount of Mg was significantly lower in the MCD group than in the MGD group (P< 0·05). Ca deficiency significantly affected the amount of femoral Ca (P< 0·001); Ca deficiency decreased the amount of Ca. Mg deficiency did not affect the amount of femoral Ca and the extent of decreased femoral Ca by Ca deficiency. The amount of femoral Zn was significantly decreased by Ca deficiency (P= 0·026) but was slightly increased by Mg deficiency (P= 0·007). An interaction between Ca deficiency and Mg deficiency was not observed.
The dietary treatments did not affect the liver weight (Table 5). Either Mg or Ca deficiency significantly increased the Zn concentration in the liver (Mg deficiency, P= 0·009; Ca deficiency, P= 0·004). An interaction was not observed, indicating that Mg and Ca deficiencies additively increase hepatic Zn concentrations. Because the dietary treatments did not affect the liver weight, the amount of hepatic Zn was similarly affected as its concentration by the dietary treatments. Either Mg or Ca deficiency increased the concentration of MT protein in the liver (Mg deficiency, P= 0·001; Ca deficiency, P= 0·003). An interaction was not observed, indicating that Mg and Ca deficiencies additively increase the MT protein concentrations. Hepatic TBARS concentration was increased by Mg deficiency (P= 0·034), but Ca deficiency affected neither the hepatic TBARS concentration nor the extent of increased TBARS concentration by Mg deficiency.
Table 5 Effects of magnesium and calcium deficiencies on zinc, metallothionein (MT) and thiobarbituric acid-reactive substance (TBARS) concentrations in the rat liver (Mean values with their standard errors, n 6)
MGD, Mg-deficient; CAD, Ca-deficient; MCD, Mg- and Ca-deficient.
The mRNA level of MT-1 was significantly increased by either Mg or Ca deficiency in the liver (Mg deficiency, P< 0·001; Ca deficiency, P= 0·001) and an interaction was not observed (Table 6). The mRNA level of MT-2 was significantly increased by either Mg or Ca deficiency in the liver (P< 0·001) and an interaction was not observed. These results indicate that Mg and Ca deficiencies additively increase the mRNA levels of MT-1 and MT-2. Mg deficiency was found to significantly increase the hepatic mRNA level of Zip14 (P= 0·014) but Ca deficiency affected neither the mRNA level of Zip14 nor the increase in mRNA level caused by Mg deficiency. The dietary treatments did not affect the mRNA levels of Zip1, Zip5, ZnT1, ZnT5 and ZnT6, indicating that the increased hepatic Zn concentration caused by Ca or Mg deficiency is not related to the mRNA levels of these transporters.
Table 6 Effects of magnesium and calcium deficiencies on mRNA levels of metallothionein (MT) and zinc transporters in the rat liver* (Mean values with their standard errors, n 6)
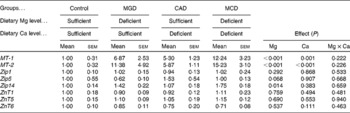
MGD, Mg-deficient; CAD, Ca-deficient; MCD, Mg- and Ca-deficient.
* Data are expressed as relative values with respect to the control group.
Discussion
Although Mg deficiency did not affect serum Zn concentration, Mg deficiency increased hepatic Zn concentration and the Zip14 mRNA level without affecting the mRNA levels of the other Zn transporters. Zip14 imports Zn into the cytosol through the plasma membrane in the liver(Reference Lichten and Cousins15). The suppression of Zip14 expression by a specific small interfering RNA decreases the extent of Zn uptake by hepatocytes(Reference Liuzzi, Aydemir and Nam24), and the up-regulation of Zip14 expression is considered to increase the extent of hepatic Zn accumulation(Reference Liuzzi, Lichten and Rivera11). These results suggest that Mg deficiency increases Zn uptake by the liver through the up-regulation of Zip14 expression at the mRNA level. Hepatic expression of Zip14 is transcriptionally enhanced by IL-1β(Reference Lichten, Liuzzi and Cousins25) and IL-6(Reference Liuzzi, Lichten and Rivera11). These cytokine concentrations in the plasma have been reported to increase in rats fed a low-Mg diet for 3 weeks(Reference Weglicki, Phillips and Freedman26). It is possible that the elevation of these cytokine levels up-regulates the mRNA expression of Zip14 in the liver of Mg-deficient rats.
Mg deficiency increases the concentration of MT protein with increasing mRNA levels of MT-1 and MT-2 in the liver. MT-1 transcription is enhanced by increased cytosolic Zn concentrations and oxidative stress(Reference Andrews6). Thus, we consider that the expressions of MT mRNA and MT protein are enhanced by an increased Zn uptake through the up-regulation of Zip14 expression in the liver of Mg-deficient animals. This is supported by reports showing that overexpression of Zip14 increased the mRNA expression of MT-1 via an increased Zn uptake in HEK 293T cells(Reference Liuzzi, Lichten and Rivera11) and that its down-regulation decreased the mRNA expression of MT-1 through the suppression of Zn uptake in cultured hepatocytes(Reference Liuzzi, Aydemir and Nam24). Mg deficiency increased hepatic Zn concentration by 20 % and increased hepatic MT expression by 40 %. An experiment using subcutaneous injection with Zn indicated that MT concentration highly and linearly correlated with Zn concentration in the liver of rats and that MT concentration largely responded to changes in Zn concentration(Reference Onosaka and Cherian27). Therefore, we consider that the increase in Zn concentration is enough to explain the enhancement of MT expression in the liver of Mg-deficient rats. Additionally, Mg deficiency induced oxidative stress, which is reflected by increased TBARS concentrations measured in the present study. This is supported by previous reports(Reference Vormann, Gunther and Hollriegl3, Reference Calviello, Ricci and Lauro7, Reference Martin, Uring-Lambert and Adrian8). Therefore, it is also likely that oxidative stress partly contributes to the up-regulation of the mRNA expression of MT in the liver of Mg-deficient animals.
Hepatic Zn concentration is 2-fold lower in MT-1- and MT-2-null mice than in wild-type mice when excess Zn is provided, and 72 % of the total Zn in the liver is associated with MT in the wild-type mice(Reference Kelly, Quaife and Froelick28). Therefore, the large difference of MT expression probably affects the Zn concentration in the liver. On the other hand, it has been reported that the total Zn concentration was not changed in the rat liver even when Zn-bound MT was increased by 5- and 7-fold by cold stress and treatment with CCl4, respectively(Reference Oh, Deagen and Whanger29). The administration of lipopolysaccharides has been reported to cause approximately a 12-fold increase in the mRNA level of MT-1 in the mouse liver but did not affect the total Zn concentration(Reference Durnam, Hoffman and Quaife30). Mg deficiency was found to increase the expression of MT protein and MT-1 mRNA by 40 % and 7-fold, respectively. These results suggest that the increase in MT expression is not enough to increase the Zn concentration in the liver of Mg-deficient animals. The increase in MT expression does not contribute significantly to increasing the Zn concentration. We consider that Mg deficiency increases Zn uptake by enhancing Zip14 expression in the liver, and that MT expression is up-regulated by an increased Zn concentration and possibly by oxidative stress. Then, MT traps Zn loaded to the liver in Mg-deficient animals.
The levels of circulating Zn have been reported to decrease immediately after inducing Zip14 expression in the mouse liver(Reference Liuzzi, Lichten and Rivera11) and MT expression in the rat liver(Reference Oh, Deagen and Whanger29). However, the up-regulation of Zip14 mRNA and MT protein expression did not affect serum Zn concentration in the Mg-deficient rats. These results suggest that serum Zn concentration is not affected by the chronic up-regulation of the expression of Zip14 or MT in Mg-deficient rats. An adaptive mechanism of Zn may prevent hypozincaemia in Mg-deficient rats with chronically enhanced expression of Zip14 or MT.
In contrast to the observations in cases of Mg deficiency, Ca deficiency was found to increase serum Zn concentration along with reducing the amount of femoral Zn. Bone is a major reservoir of Zn in the body, and Ca deficiency accelerates the release of Zn from the bone. This is accompanied by bone resorption(Reference Golden and Mills31). A low-Ca diet has been reported to increase plasma Zn concentration(Reference Min, Ueda and Tanaka32). This is supported by the present results. Therefore, we suggest that Ca deficiency increases serum Zn concentration through the stimulation of bone resorption in the present experiment. The present results indicate that Ca deficiency increased the concentrations of Zn and MT in the liver. Furthermore, Ca deficiency increased the mRNA levels of MT-1 and MT-2 in the liver without affecting the mRNA levels of Zn transporters. As mentioned above, MT concentration highly and linearly correlated with Zn concentration in the liver of rats and MT concentration largely responded to changes in Zn concentration(Reference Onosaka and Cherian27). These results suggest that enhanced Zn supply to the liver increases hepatic Zn concentration in Ca-deficient rats, leading to the up-regulation of MT expression through increases in the mRNA expressions of MT-1 and MT-2. Then, hepatic MT traps Zn supplied from the bone in Ca-deficient animals.
Reductions in dietary Zn beyond the capacity to maintain homeostasis lead to the utilisation of Zn from pools located in the bone and the liver(Reference King33), and hepatic MT serves as a Zn reservoir that can be utilised when Zn is deficient(Reference Kelly, Quaife and Froelick28). The amount of hepatic Zn was 0·68 μmol higher in the CAD group than in the control group. The amount of Zn in the left femur was 0·25 μmol lower in the CAD group than in the control group; femoral Zn was 17 % lower in the CAD group than in the control group. According to the equation of House & Wastney(Reference House and Wastney34), the amount of whole-bone Zn was calculated to be 23 μmol in rats weighing 177 g. This body weight corresponds to the final mean body weight for both groups. Therefore, Zn loss from the whole bone was estimated to be 3·9 μmol (23 μmol multiplied by 0·17) during Ca deficiency based on the assumption that each bone responds to Ca deficiency in a similar manner to the femur. These results show that the increase in hepatic Zn corresponds to 17·4 % (0·68 μmol divided by 3·9 μmol) of Zn loss from the skeletal tissues. This suggests that the liver only partly saves the released Zn from the bone during periods of Ca deficiency.
Skin lesions are a clinical sign of inflammation in Mg-deficient rats(Reference Mazur, Maier and Rock35). Mg deficiency-induced skin lesions were observed to appear shortly after the initiation of the experiment. This was resolved by simultaneous Ca deficiency. Additionally, Mg deficiency reduced weight gain and feed efficiency, which was also alleviated by simultaneous Ca deficiency. These results indicate that Ca deficiency rescues the effects of Mg deficiency on inflammation and growth retardation. Mg acts as a natural Ca antagonist(Reference Iseri and French16) and the reduction of the extracellular ratio of Mg:Ca has been reported to lead to an inflammatory response(Reference Malpuech-Brugère, Rock and Astier36). The dietary restriction of Ca with hypocalcaemia has been reported to suppress the incidence of skin lesions in Mg-deficient rats, suggesting that hypocalcaemia could be beneficial by decreasing external Ca availability and Ca entry, and thus decreasing the intracellular Ca concentration in Mg-deficient animals(Reference Bussiere, Gueux and Rock17). On the other hand, Ca deficiency did not affect serum Ca concentration in the present experiment probably because Ca levels in Ca-deficient diets were 20-fold higher in the present experiment than in the above-cited report(Reference Bussiere, Gueux and Rock17). Therefore, it is unlikely that the amelioration of skin lesions and growth retardation are related to the reduction of the antagonistic effect of extracellular Mg on Ca entry in the present experiment. Bones hold the major pool of Mg in the body and release Mg in response to Mg deficiency(Reference Wallach37). This is supported by the present results, which indicate that Mg deficiency causes a significant decrease in femoral Mg level without affecting the femoral Ca level. Furthermore, the required dietary Mg decreases linearly with a reduction in dietary Ca in rats fed with low-Mg diets (based on the recovery of body-weight gain)(Reference McAleese and Forbes38). The restriction of dietary Ca decreases the amount of femoral Mg and increases serum Mg concentration, regardless of the dietary Mg level in the present experiment. This suggests that the supply of Mg from the bone to the soft tissues is enhanced by Ca deficiency even in Mg-deficient animals. We suggest that Ca deficiency ameliorates Mg deficiency by increasing the Mg supply from the bone. This leads to alleviation of skin lesions and growth retardation. However, it must be noted that the restriction of dietary Ca did not allow complete recovery from the low concentration of serum Mg in Mg-deficient rats. The MCD rats remained Mg deficient.
The MGD and MCD groups suffered severe Mg deficiency and the CAD and MCD groups suffered severe Ca deficiency in the present experiment because the Mg or Ca concentration in the deficient diets was set as low as 10 % of the requirement levels. Mg or Ca deficiency shown in the present experiment may not take place actually. On the other hand, Ca deficiency did not affect serum Ca concentration and body-weight gain. These results suggest that Ca homeostasis is maintained in the Ca-deficient animals and the extent of Ca deficiency did not reach levels to induce pathological conditions in the present experiment. As reviewed by Nielsen(Reference Nielsen39), severe Mg deficiency induces many pathological conditions in experimental animals but subclinical Mg deficiency per se does not. On the other hand, severe Mg deficiency (14 % of the requirement) increased hepatic Zn concentration within 10 d in rats and the increase in hepatic Zn concentration was also observed but delayed when rats suffered moderate Mg deficiency (22 % of the requirement)(Reference Vormann, Gunther and Hollriegl3). Therefore, we can postulate that MT and Zip14 mRNA expression is also up-regulated when rats are given a moderate Mg-deficient diet for a long time.
In conclusion, Mg and Ca deficiencies up-regulate MT expression in the liver through increasing Zn uptake by different mechanisms. Mg deficiency up-regulates Zip14 mRNA expression, and Ca deficiency increases the Zn supply from the bone to the liver. As a result, Mg and Ca deficiencies additively increase the expression of MT and Zn concentrations in the liver.
Acknowledgements
The present study received no specific grant from any funding agency in the public, commercial or not-for-profit sectors. M. K. and T. M. designed the research; M. K., N. I., K. H. K. and M. F. conducted the research; M. K. analysed the data; M. K., M. F. and T. M. prepared the manuscript. T. M. had primary responsibility for the final content of the manuscript. All authors read and approved the final manuscript. The authors declare no conflict of interest.


