The current obesity pandemic triggers several co-morbidities such as CVD, dyslipidaemia, metabolic inflammation and type 2 diabetes mellitus(Reference Al-Kuraishy and Al-Gareeb1,2) . At the same time, the management of overweight and obesity is considered a major modifiable intervention in the prevention of CVD as the leading cause of death worldwide(Reference Goff, Lloyd-Jones and Bennett3). A common interventional approach to combat obesity and associated metabolic disorders is energy restriction(Reference Jain and Singh4). Nevertheless, weight reduction during energy restriction alone is associated with the remarkable decrease in fat free mass, energy expenditure, fat oxidation and satiety, all lead to increased risk of weight regain and metabolic disorders(Reference Schuster5,Reference Wolfe6) . Considering the aforementioned issues as well as relatively low adherence to lifestyle modifications such as energy-restricted diet and exercise, a novel field of research on the role of pharmacological agents and dietary supplements is emerging. Among the nutraceuticals, lipophilic carotenoids have attracted a lot of attention in terms of obesity management(Reference Bonet, Canas and Ribot7,Reference Mounien, Tourniaire and Landrier8) . The hypothesis around anti-obesogenic properties of carotenoids is rigorously supported by the fact that the storage, metabolisation and biological activities of carotenoids are mainly accomplished in the adipose tissue(Reference Mounien, Tourniaire and Landrier8). The primary evidence showed that many of the health-promoting effects of carotenoids were mediated through their local effects in adipose tissue to reverse ‘adiposopathy’ phenomenon(Reference Bonet, Canas and Ribot7). Adiposopathy is characterised by functionally impaired adipose tissue, mainly accompanied by adipocyte hypertrophy, visceral adiposity and release of NEFA resulting in metabolic and endocrine disorders and inflammatory responses(Reference Bays, Toth and Kris-Etherton9). Evidence linking carotenoid consumption to obesity management suggested a regulatory role of carotenoids on key aspects of adipose tissue biology such as adipogenesis, adipose tissue metabolism, adipocyte capacities for fat accumulation, secretory actions and local inflammation(Reference Bonet, Canas and Ribot7,Reference Mounien, Tourniaire and Landrier8) . Carotenoids, belonging to a family of C40 lipophilic pigments, are classified into two groups based on their chemical structure: unoxygenated carotenoids which are known as carotenes, and oxycarotenoids or xanthophylls which are not pure hydrocarbons and contain oxygen atoms as well(Reference Von Lintig10). To date, more than 700 types of carotenoids were identified in nature, of which fifty exist in the human diet and only six found in human plasma, including α- and β-carotenes, lycopene, lutein, zeaxanthin and β-cryptoxanthin(Reference Maiani, Periago Castón and Catasta11), among them xanthophyll lutein has attracted a novel progressive attention in recent years, due to its more potent antioxidant activity than the other carotenoids(Reference Wang, Tsao and Zhang12). Considering the highly concentration of lutein in the macula, decades of research have focused on the potential protective role of lutein against age-related macular degeneration. However, the distribution of lutein throughout the body, particularly in brain and the adipose tissue, may afford lutein the functions beyond the eye health(Reference Dwyer, Navab and Dwyer13–Reference Kijlstra, Tian and Kelly17).
On the other hand, evidence showed that daily consumption of more than 6–14 mg of lutein had a health-promoting effect and prevented age-related diseases(Reference Seddon, Ajani and Sperduto18). Given that the consumption of fruits and vegetables, as the major dietary sources of lutein, is low, especially in overweight and obese people, the dietary intake of lutein remains insufficient(Reference Hajizadeh-Sharafabad, Ghoreishi and Maleki16,Reference Johnson19–Reference Calder, Ahluwalia and Brouns21) . Notably, lutein consumption among American and European populations has been estimated about 1·7 mg/d, and in developing countries the average intake was far below this level(Reference Alvarado-Ramos, De Leon and Fontes22,Reference O’Neill, Carroll and Corridan23) . In spite of scarce clinical trials for investigating the effects of lutein supplementation on adiposity, several observational studies supported the inverse association between circulating levels of lutein and adiposity(Reference Dwyer, Navab and Dwyer13,Reference Sugiura, Nakamura and Ogawa24–Reference Ford, Gillespie and Ballew30) . Data from animal models also confirmed the anti-obesogenic effects of lutein, through underlying mechanisms including stimulation of fatty acids β-oxidation and energy expenditure, reduction of adipocyte hypertrophy and suppression of adipocyte inflammation(Reference Qiu, Gao and Xiang31,Reference Han, Cui and Wang32) . Moreover, many epidemiological studies have reported a strong inverse correlation between dietary intake and/or serum level of lutein and CVD, dyslipidaemia, the metabolic syndrome and insulin resistance(Reference Dwyer, Navab and Dwyer13,Reference Suzuki, Ito and Inoue25,Reference Coyne, Ibiebele and Baade29,Reference Coyne, Ibiebele and Baade33–Reference Xu, Zou and Huang35) . A systematic review and meta-analysis of seventy-one observational and human intervention studies demonstrated a significant positive association between serum level or dietary intake of lutein and cardiometabolic health(Reference Leermakers, Darweesh and Baena15). Our recent systematic review also highlighted protective effects of lutein consumption against cardiovascular risk factors(Reference Hajizadeh-Sharafabad, Ghoreishi and Maleki16). In the aspect of anti-atherogenic effects, one clinical trial with a Mediterranean diet proposed lutein as the potential responsible for less atherogenic LDL-cholesterol particles and decreased levels of oxidised-LDL(Reference Barona, Jones and Kopec36). Several studies on human or animal models also attributed anti-atherogenic properties of lutein due to its effects on dyslipidaemia and plaque formation in the arteries(Reference Dwyer, Navab and Dwyer13,Reference Han, Cui and Wang32,Reference Xu, Zou and Xiao37,Reference Kim, Leite and deOgburn38) .
To the best of our knowledge, there was not any clinical trial about the possible effects of lutein supplementation in the obese individuals. The aim of the present study was to determine whether lutein consumption along with a low-calorie diet (LCD) would improve anthropometric indices, body composition, metabolic parameters and satiety in the middle-aged obese individuals.
Materials and methods
Participants
The present study was conducted at Tabriz University of Medical Sciences, Tabriz, Iran between November 2019 and March 2020. Healthy men and postmenopausal women aged 45–65 years and BMI between 30 and 45 kg/m2 were included in the study. Exclusion criteria were as follows: weight fluctuation more than 3 kg within the last 6 months, regular use of medications such as lipid-lowering drugs, anti-diabetic agents, corticosteroids, immunosuppressants, anti-coagulants, anti-obesity drugs or dietary supplements, use of hormone replacement therapy (within the past 6 months), any known chronic diseases (such as metabolic diseases, cancer, heart, gastrointestinal, liver, lung and kidney diseases) and smoking. The study protocol was approved by the ethics committee of Tabriz University of Medical Sciences, Tabriz, Iran (ethics code: IR.TBZMED.REC.1398·692) and registered in the Iranian Registry of Clinical Trials (https://www.irct.ir/trial/43999, registration number: IRCT20191109045382N1).
Study design
The present study was a 10-week double-blinded, randomised placebo controlled parallel-group trial in which participants were randomly allocated into two groups who consumed either a lutein supplement or a placebo plus an LCD for both arms. Lutein supplement was purchased from Bulk Supplements, composed of lutein extracted from the marigold plant and maltodextrin as well. After an initial phone screening, volunteers were invited for information-gathering interviews regarding health history, dietary habits and other lifestyle components for checking the eligibility for the study. Eligible participants followed a 2-week run-in period before randomisation to a dietary intervention to be controlled for detecting the previous dietary habits and adapting to dietary modification, and then they were assigned to the two arms of intervention or placebo by the statistician using block randomisation method generated by Random Allocation Software, with a block of size 4 matched for BMI. The intervention allocation was blinded for investigators and participants. Participants in the intervention group received one capsule of lutein daily, containing 20 mg lutein and 300 mg maltodextrin, while those in the placebo group received the same amount of maltodextrin capsules with a similar appearance for 10 weeks. In the present study, the dosage of lutein supplementation as well as the intervention period was determined based on the previous studies that had shown the proper tolerability, safety and the effectiveness in improving the metabolic or inflammatory parameters(Reference Xu, Zou and Xiao37,Reference Wang, Jiao and Li39) . To increase the intestinal absorption, study subjects were recommended consuming the capsules with some butter or other oils. During the intervention period, participants completed five screening visits at the baseline, week 2, week 4, week 8 and week 10 for doing the designed intervention. Adverse events were recorded at each visit by asking the subjects, and the intervention compliance was evaluated by counting the number of unused capsules. We also reiterated the importance of adherence to the study protocol by weekly calling the individuals. Treatment compliance was defined as the consumption of ≥90 % of the supplements. All study subjects provided written informed consent prior to commencement of the study.
Weight-loss programme
Apart from receiving supplements, each participant was instructed to follow an individualised LCD. The required energy was calculated based on the Mifflin St. Jeor equation considering participants’ age, sex, weight, height and physical activity (PA) level. In order to achieve weight loss, everyone’s energy was considered 25 % less than the calculated energy requirement. The proportion of carbohydrate, protein and fat in the weight loss plan was set at 55 , 15 and 30 % of total energy intake, respectively. After completing the calculations, meal plan was designed based on the food-based dietary guidelines for Iranians (available at http://www.fao.org/nutrition/education/food-based-dietary-guidelines/regions/countries/iran/fr/). Individual’s dietary habits were considered as well. Moreover, participants were trained for food exchange list as well as serving size of the food groups and the number of servings in the daily diet plan. To improve adherence to the daily meal plan, all participants were contacted by weekly telephone calls and were requested to complete 3-d diet records until the next visit and send them back to the investigators.
Assessment of dietary intake, appetite sensations and physical activity
Dietary intake was evaluated by means of a 3-d food record (2 weekdays and 1 weekend day) and a 24-h dietary record, which collected before, after and during the intervention period. All food items were analysed by Nutritionist IV software (modified version for Iranian foods) for energy and nutrients content. Appetite sensation was assessed using a visual analogue scale before the commencement of the study and at the endpoint. The visual analogue scale items for psychometrically measuring the appetite were in domains of hunger, satiety, fullness and desire to consume something sweet, fatty or salty, each question had a score from 1 to 10. In addition, PA levels were assessed using the international PA questionnaire before and the end of the intervention period. Then, the international PA questionnaire data were converted to metabolic equivalent-min/week (MET-min/wk) using the MET intensity of each activity.
Anthropometric measurements and body composition analysis
Anthropometric measurements and body composition analysis were conducted in a fasted state at the baseline as well as the endpoint of the study. All participants were advised for wearing lightweight clothing without shoes. At each counseling session, body weight and waist circumference (WC) were also measured in a non-fasted state. Body weight and height were measured using a Seca digital scale and a wall-mounted stadiometer with a precision of 0·1 kg and 0·1 cm, respectively. BMI was defined as the body weight in kg divided by the square of the body height in metres. In addition, a non-elastic tape with a precision of 0·5 cm was used to measure WC in the midpoint between the lowest rib and the iliac crest, as well as the hip circumference around the widest part of the buttocks, in a standing position for computing the waist to hip ratio. Fasting body composition was measured by a bioimpedance analyzer, Tanita MC-780 S MA.
Biochemistry
Venous blood samples (10 ml) were taken at the beginning and the end of the intervention and immediately centrifuged for isolating serum from the whole blood and stored at –80°C for further analysis. Before freezing the samples, fasting lipid profile including total cholesterol (TC), HDL-cholesterol and TAG as well as fasting blood sugar (FBS) measurements were carried out in the Jahad Medical Diagnostic and Pathology Laboratory by enzymatic colorimetric method and commercial kits (Pars-Azmoon Co.). Also, the LDL-cholesterol level was calculated using the Friedewald equation(Reference Friedewald, Levy and Fredrickson40). The ELISA method was used for measuring serum insulin levels using commercial kits (Monobind). Homoeostatic model assessment for insulin resistance (HOMA-IR) value was calculated on the basis of the following formula: HOMA-IR = (fasting glucose (mg/dl) × fasting insulin (μIU/ml))/405. The calculation formula used to determine the quantitative insulin sensitivity check index (QUICKI) was as follows: QUICKI = 1/ (log (‘fasting insulin) + log (fasting glucose)). Serum levels of NEFA were measured by an enzymatic colorimetric technique, using an analytic kit (Randox Laboratories Ltd).
Statistical analysis
Statistical analysis was performed using IBM SPSS software (SPSS, Inc.). On the basis of the previous clinical trial, considering a type I error of 5 % (α = 0·05) and type II error of 20 % (b = 0·20, power = 80 %), the minimum sample size was calculated 18 per group(Reference Xu, Zou and Xiao37). Considering a dropout rate of 30 %, twenty-four persons for each group were determined. We conducted the statistical analysis based on the following principles: 1) a per-protocol analysis of the treatment efficacy on all subjects who completed the 10-week intervention (n 45), and 2) an intention to treat approach based on multiple imputation method on all subjects who were included (n 48) in the study; the per-protocol results were only presented as the results were the same. For comparing baseline qualitative and categorical variables between the two groups, the χ 2 test and independent samples t test were used, respectively. Since all quantitative variables had normal distribution, based on the Kolmogorov–Smirnov test, paired samples t test and independent samples t test were used for within-group and between-group comparisons, respectively. Absolute effects of treatment were assessed using ANCOVA adjusted for confounding factors including baseline values, age and mean changes in BMI. Change percentage was measured using the following equation: PC = 100 × ((endpoint value – baseline value)/baseline value). Differences were considered as statistically significant at P < 0·05.
Results
A flow diagram of the study participants is presented in Fig. 1. After a run-in period of 2 weeks on an LCD, forty-eight individuals were randomly allocated into either lutein or placebo group along with weight reduction diet plan, for an intervention period of 10 weeks. One participant in the lutein group was excluded due to immigration. Two in the placebo group were also excluded for the following reasons: poor compliance with the weight loss diet (n 1) and unwillingness to continue (n 1). Therefore, a total of forty-five participants (lutein (n 23) and placebo (n 22)) completed the trial. Counting the returned capsules showed relatively high compliance with an average of 90·6 % consumption.
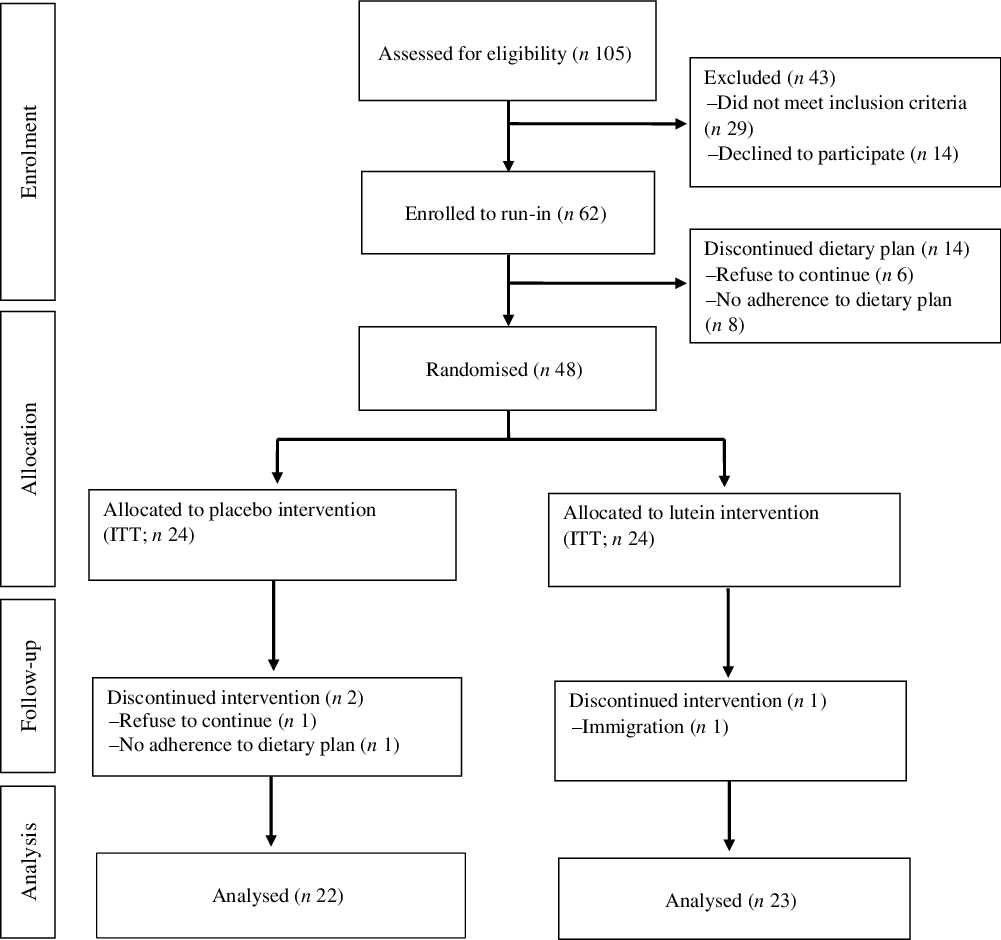
Fig. 1. Flow diagram of study participants. ITT, intention to treat.
Participants’ characteristics
The characteristics of participants who completed the 10-week intervention are illustrated in Table 1. No significant difference was seen at the baseline in terms of sex, with eight men and fifteen women in the lutein group and ten men and twelve women in the placebo group (P = 0·465). Means of the study subjects’ age and BMI were 53·82 (sd 4·98) years and 34·11 (sd 3·51) kg/m2, respectively. There was no statistically significant difference between the two groups in terms of age, BMI, PA, systolic blood pressure and diastolic blood pressure at the baseline. No adverse effects, following lutein supplementation, were reported by the participants.
Table 1. Baseline characteristics of the participants
(Mean values and standard deviations; numbers and percentages)
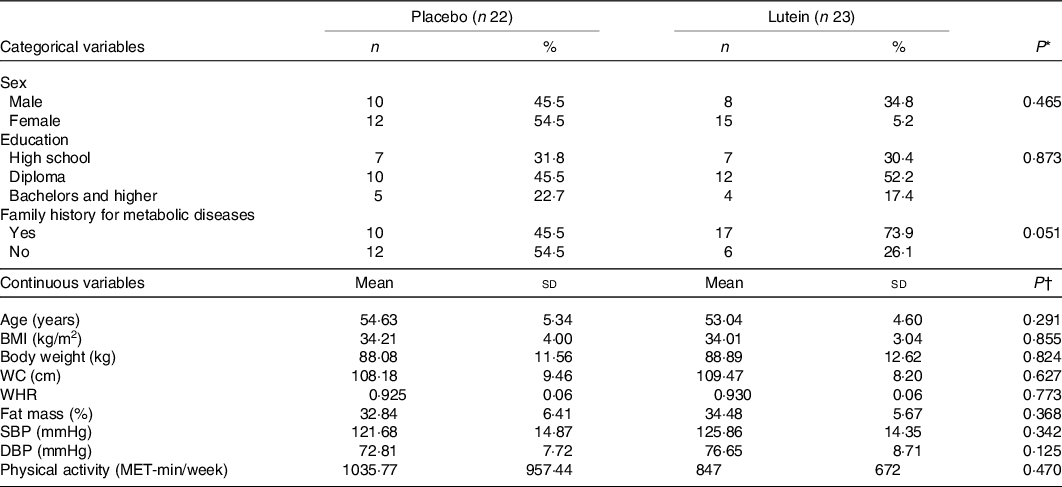
WC, waist circumference; WHR, waist:hip ratio; SBP, systolic blood pressure; DBP, diastolic blood pressure.
* Based on independent samples t test.
† Based on χ 2 test.
Dietary intake, appetite sensations and physical activity
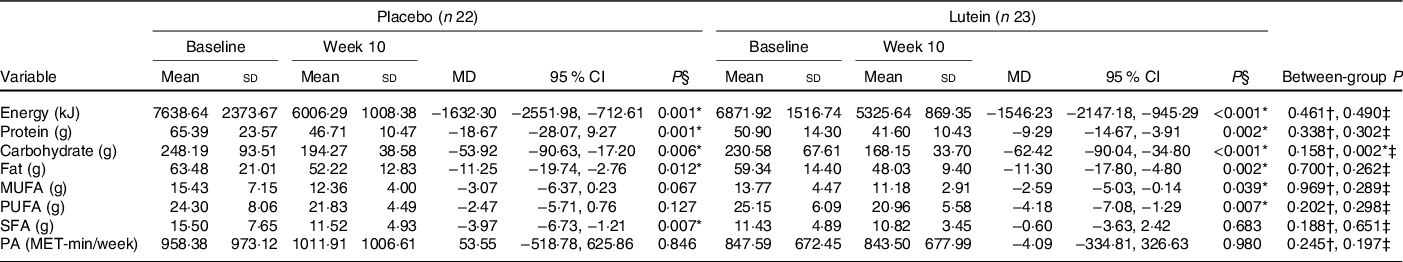
As shown in Fig. 2, there were no significant differences between the two groups in hunger, the feeling of fullness, desire to eat and desire to eat sugary sweets. As of interest, there was a marginally significant decrease in desire to eat salty foods in the lutein group compared with the placebo group (−31·63 v. 8·92 %, P = 0·054). However, despite the decreased craving for fatty foods in the lutein-supplemented group comparing the control (−10·57 v. 9·81 %), it did not reach statistical significance (P = 0·138). Values of dietary intake and PA at the baseline and end of the intervention are shown in Table 2. The energy intake significantly decreased in both groups during the intervention; however, between-group differences were not statistically significant. Macronutrient intake of protein, carbohydrate and fat also showed significant reduction in both groups; however, only the decrease in carbohydrate consumption was significantly higher in lutein group compared with controls. The intake of MUFA and PUFA remained unchanged in placebo group, whereas lutein group showed a significant reduction in dietary content of MUFA and PUFA during study, while the between-group differences were not significant. SFA intake significantly decreased only in placebo group; however, there was not any statistically difference between the study groups. None of the interventions changed the PA, significantly.
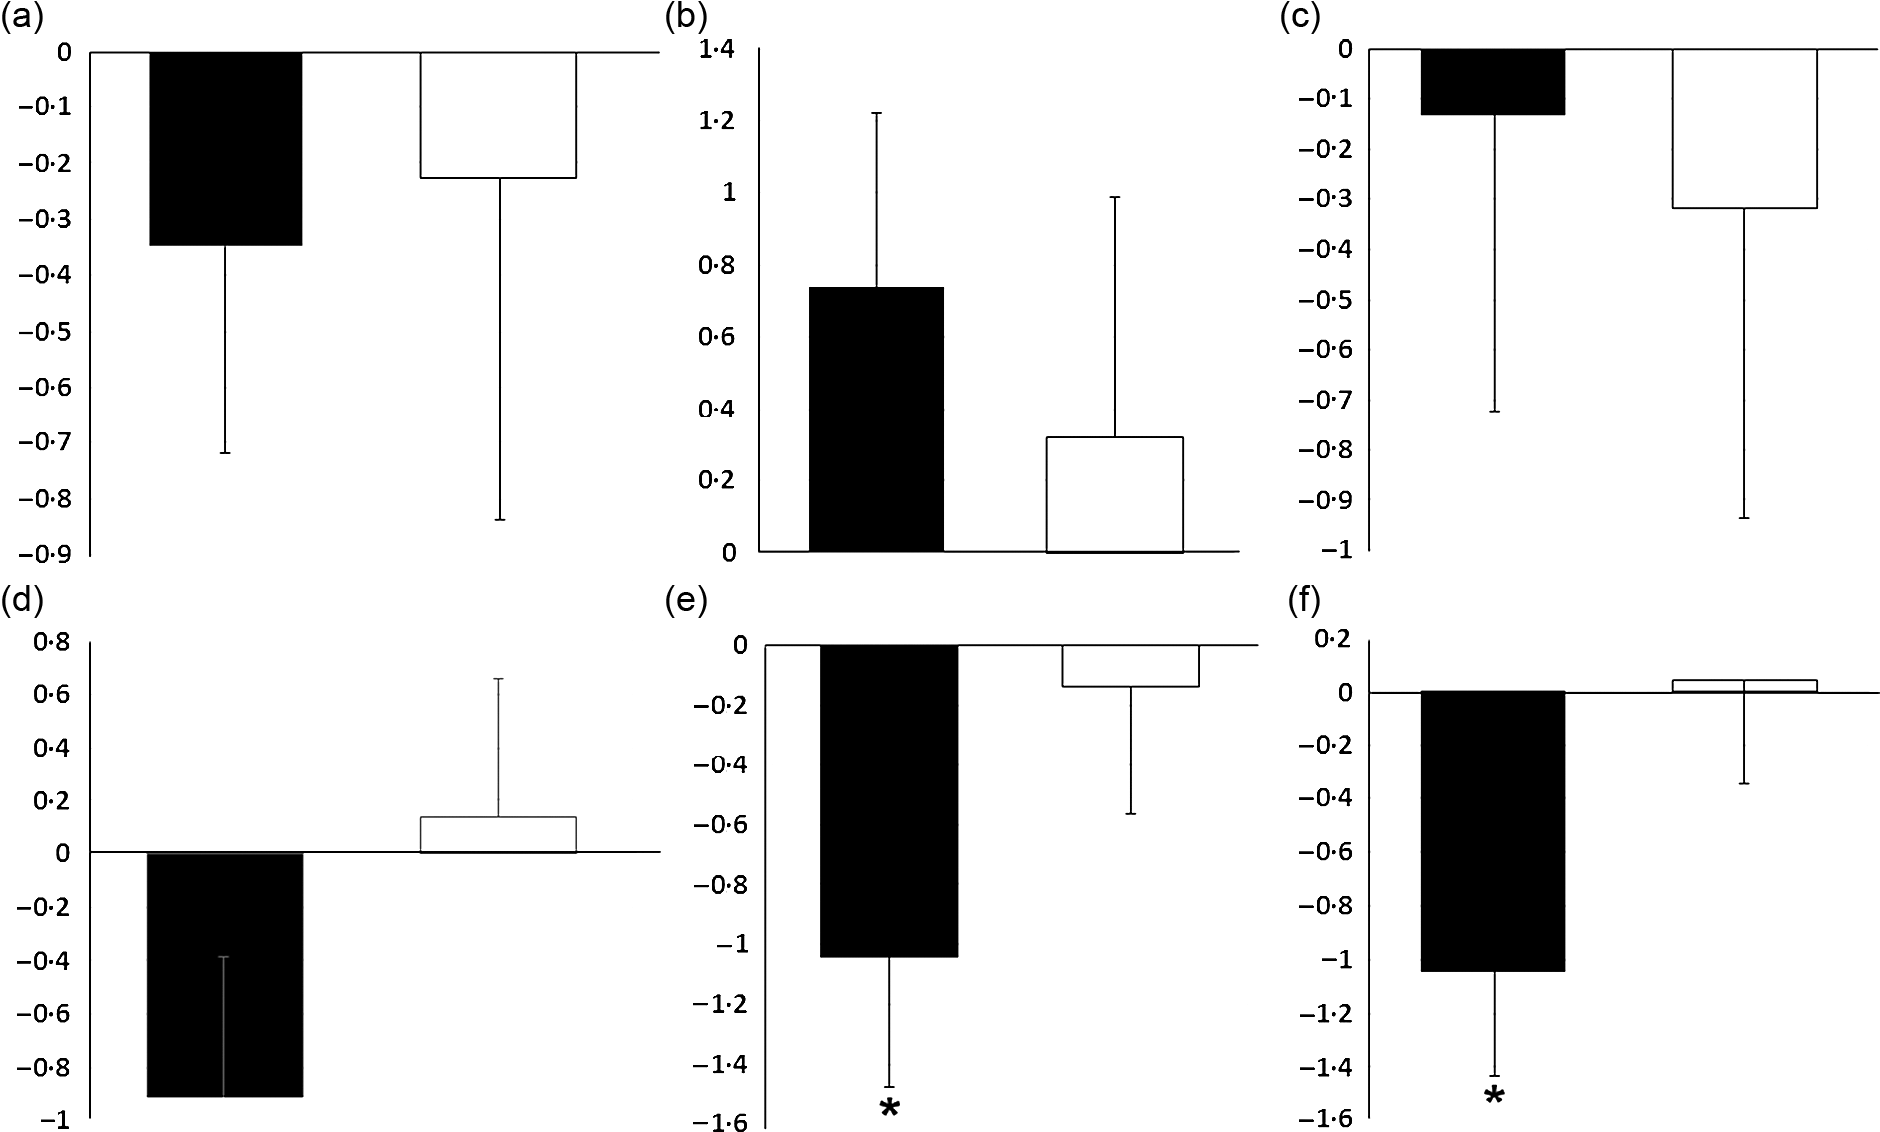
Fig. 2. Effect of intervention on appetite sensations: (a) fold change of hunger; (b) fold change of the feeling of fullness; (c) fold change of the desire to eat; (d) fold change of the desire to eat sweet foods; (e) fold change of the desire to eat salty foods; (f) fold change of the desire to eat fatty foods. Values are means of fold change with their standard errors represented by vertical bars. Data analyses were done using the paired sample t test (*P < 0·05 v. baseline) and ANCOVA (adjusted for baseline values, age and changes in BMI). ![]() , Lutein (n 23) and
, Lutein (n 23) and ![]() , placebo (n 22).
, placebo (n 22).
Table 2. Comparison of dietary intake and physical activity (PA) changes after 10 weeks according to experimental groups
(Mean values and standard deviations; mean differences (MD) and 95 % confidence intervals)

* P < 0·05.
† Based on independent samples t test.
‡ Based on ANCOVA test, adjusted for baseline values, age and changes in BMI.
§ Based on paired samples t test.
Anthropometric and body composition measurements
Anthropometric and body composition measurements at the baseline as well as the end of the intervention are shown in Table 2. Baseline values of BMI, body weight, WC, hip circumference and body composition were not significantly different between the two groups. There was a significant decrease in body weight and BMI in both groups (P < 0·001) after the 10th week. There was a slightly more reduction in BMI in the lutein-supplemented group than the control (−2·82 v. −2·38 %), with no significant between-group difference (P = 0·543). In spite of the significant decrease of body fat percentage in both groups at the end of the intervention period, there was a much more reduction in the body fat percentage of the lutein-supplemented group compared with the control (−8·36 v. −4·78 %, P = 0·047). Moreover, after 10 weeks of supplementation, participants in the placebo group experienced a significant reduction in fat-free mass value (−1·14 %, P = 0·012), while it remained unaffected with the lutein supplementation (−0·49 %, P = 0·383), although there was no statistically significant between-group difference (P = 0·087). There was also a statistically significant increase of the body water in the lutein-supplemented group comparing the controls (2·90 v. 0·91 %, P = 0·018). Furthermore, only lutein supplementation led to a significant reduction in visceral fat (−6·24 %, P = 0·001), but without statistically significant difference with the control (−2·09 %, P = 0·148) group (P = 0·103). Markedly, both groups experienced significant decreases in the WC and PC (in the lutein-supplemented group, −4·17% and −1·78 %, respectively and in the control group, −4·93 and −2·46 %, respectively). The same was seen for waist to hip ratio (−2·39 % for lutein-supplemented group and −2·54 % for the controls). None of these changes was statistically different between the two study groups (Table 3).
Table 3. Comparison of anthropometric indices and body composition changes after 10 weeks according to experimental groups
(Mean values and standard deviations; mean differences (MD) and 95 % confidence intervals)
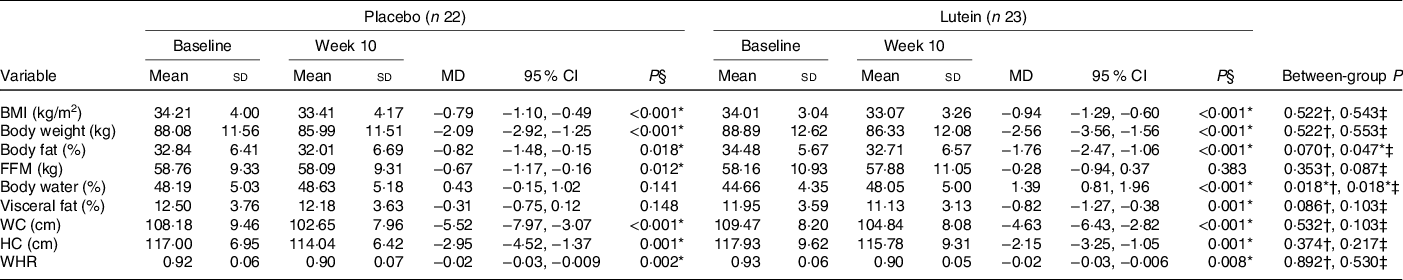
FFM, fat-free mass; WC, waist circumference; HC, hip circumference; WHR, waist:hip ratio.
* P < 0·05.
† Based on independent samples t test.
‡ Based on ANCOVA test, adjusted for baseline values, age and changes in BMI.
§ Based on paired samples t test.
Metabolic biomarkers
Values of lipid profile, glucose homoeostasis parameters and NEFA are shown in Table 4. There were not any statistically significant differences between the two study groups in terms of the lipid profile, FBS, HOMA-IR, QUICKI and NEFA before the commencement of the study. There was a significant decrease in TC in the lutein group when compared with the placebo group (−10·39 % in lutein v. −0·37 % in placebo, P = 0·038). Also, there was a significant reduction in serum levels of LDL-cholesterol from baseline to the end of the intervention following lutein supplementation (−15·02 % in lutein group v. −1·32 % in controls). The reduction in LDL-cholesterol in lutein group was significant compared with placebo group based on independent samples t test (P = 0·022), although, after adjusting for baseline and potential confounders, the between-group difference does not reach significance level (P = 0·102). No significant differences in the changes of TAG (3·78 % in lutein group v. 3·34 % in controls, P = 0·912) or HDL-cholesterol (−2·57 % in lutein group v. 3·77 % in controls, P = 0·232) were detected between lutein and control groups. Also, a 1·02 % reduction in FBS in the lutein-supplemented group was observed compared with a 0·56 % increase in the placebo group; however, no significant difference was found between groups (P = 0·976). Also, during the 10 weeks, both lutein and placebo groups experienced a non-significant reduction in HOMA-IR (−4·96 % in lutein group v. −7·48 % in placebo group, P = 0·747) as well as a non-significant increase in QUICKI (3·17 % in lutein group v. 3·48 % in placebo group, P = 0·619). No significant difference in NEFA levels was observed between lutein and placebo groups (17·13 % in lutein group v. 7·54 % in placebo group, P = 0·857).
Table 4. Comparison of lipid profile, glucose homoeostasis parameters, and NEFA changes after 10 weeks according to experimental groups
(Mean values and standard deviations; mean differences (MD) and 95 % confidence intervals)
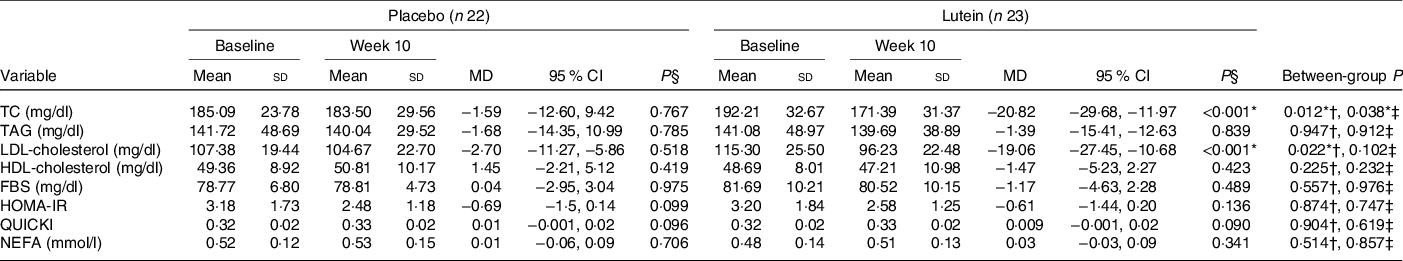
TC, total cholesterol; FBS, fasting blood sugar; HOMA-IR, homoeostasis model assessment of insulin resistance; QUICKI, quantitative insulin sensitivity check index.
* P < 0·05.
† Based on independent samples t test.
‡ Based on ANCOVA test, adjusted for baseline values, age and changes in BMI.
§ Based on paired samples t test.
Discussion
The present clinical trial investigated the effects of lutein supplementation on anthropometric indices, body composition and metabolic parameters in the middle-aged obese individuals under an LCD. Since both lutein-supplemented group and the controls received an LCD, significant decreases of the body weight (presented by BMI), WC and waist to hip ratio were observed in both arms. Therefore, we focused on body composition values which is the first time that the effect of lutein supplementation on body composition of obese adults has been investigated, to our knowledge. Remarkably, lutein supplementation significantly increased total body fat loss compared with the controls. Moreover, there was a considerable increase of total body water and lean body mass in the lutein-supplemented group, although the latter did not reach the statistical significance. Actually, it seems that LCD alone caused the weight loss due to loss of both body fat mass and fat-free mass, while lutein-induced weight loss was the result of reduced body fat mass, without noticeable change in fat-free mass, that is of the utmost importance in the overweight and obese patients who are on a weight loss programme. In addition, we indicated from the within-group analysis that the lutein group lost a significant amount of visceral fat rating from baseline to week 10 of intervention, whereas the placebo group did not manifest significant changes in visceral fat; however, the between-group difference did not reach significance level. This is in contrast to the previous clinical trial in which the healthy subjects received 10 or 20 mg/d lutein for 12 weeks and there were no statistically significant changes in body fat mass or body weight and WC(Reference Wang, Jiao and Li39). This discrepancy in the results may be due to the fact that the study subjects in that study were not obese(Reference Wang, Jiao and Li39). However, the obtained results of the present study are in line with a number of observational studies in which serum levels of lutein were inversely associated with adiposity. Noteworthy, among the eleven observational studies examining the association of the serum levels of lutein and adiposity, measured by BMI, WC and body fat percentage, seven studies(Reference Dwyer, Navab and Dwyer13,Reference Waters, Clark and Greene26–Reference Ford, Gillespie and Ballew30,Reference Wang, Gaziano and Norkus41) indicated a significant inverse relationship, but not two(Reference Bovier, Lewis and Hammond42,Reference Ben Amara, Tourniaire and Maraninchi43) . Also, one study reported a significant negative association between WC and lutein levels only in women(Reference Suzuki, Ito and Inoue25) and in another study, the inverse relationship between lutein levels and BMI was significant in non-smokers only(Reference Sugiura, Nakamura and Ogawa24). Experimental study on animals demonstrated that lutein administration prevented excessive weight gain and visceral adiposity and decreased hepatic lipid accumulation in ApoE-deficient mice fed the high-fat diet as well(Reference Han, Cui and Wang32). In another study, supplementation of mice with lutein reduced levels of perinephric and abdominal fat mass compared with controls; however, no significant changes were reported in body weight or energy efficiency(Reference Qiu, Gao and Xiang31).
As previously implied, loss of lean body mass due to restricted-calorie diet may overshadow the health benefits of the weight loss diet plan and make it difficult to continue due to decreasing energy expenditure(Reference Gill, Bartels and Batsis44,Reference Miller and Wolfe45) and that is particularly important in the sarcopenic obese patients who are on a hypocaloric diets. Therefore, we targeted postmenopausal women and men aged over 45 years old to find whether lutein supplementation could prevent loss of lean mass during calorie restriction in these populations. The trend towards the increase in fat loss and preservation of lean mass when lutein was added to LCD suggested that lutein may be a promising dietary agent in the management of obesity. The current hypothesis that lutein could improve body composition was primarily based on the interaction of lutein with the nuclear receptors such as retinoic acid receptor, retinoid X receptor and PPAR and subsequent increase in energy expenditure (Fig. 3). Data from animal or in vitro studies demonstrated that lutein and its metabolites, as natural agonists for the nuclear retinoic acid receptor, could activate retinoic acid receptor/retinoid X receptor heterodimers which interact with retinoic acid response elements located in the retinoic acid-responsive genes and thereby regulate transcription of various genes involved in adipocyte metabolisms such as CCAAT-enhancer binding protein and PPAR(Reference Selvaraj and Klasing46–Reference Matsumoto, Mizukami and Mizuno49). Moreover, lutein may also involve in the expression of PPAR target genes.
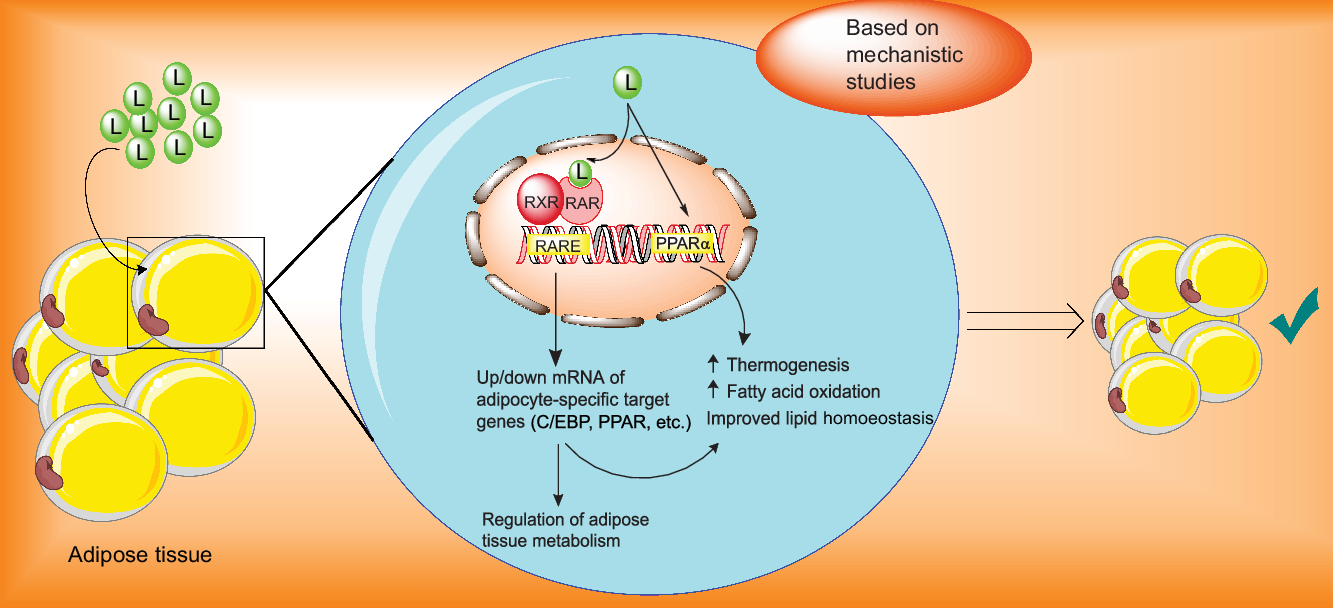
Fig. 3. Proposed mechanisms of the actions of lutein in the management of adiposity. C/EBP, CCAAT-enhancer binding protein; L, lutein; RARE, retinoic acid response element; RAR, retinoic acid receptor; RXR, retinoid X receptor.
It has been reported that lutein up-regulates gene expression of PPARα, which increases β-oxidation of fatty acids, decreases adipocyte hypertrophy and attenuates adipose tissue inflammation(Reference Qiu, Gao and Xiang31,Reference Han, Cui and Wang32,Reference Selvaraj and Klasing46,Reference Selvaraj, Shanmugasundaram and Klasing48,Reference Stienstra, Duval and Müller50) . Additionally, in an animal model supplemented with lutein, exercise led to a significant decrease in the serum level of lutein along with significant increases in carnitine palmitoyltransferase 1 and AMP-activated protein kinase. Considering the involvement of AMP-activated protein kinase and carnitine palmitoyltransferase 1 in energy metabolism and lipid utilisation, the authors suggested that lutein led to elevated lipid metabolism, likely due to increasing cellular levels of carnitine palmitoyltransferase 1 and AMP-activated protein kinase(Reference Matsumoto, Hagio and Inoue51).
There was no significant reduction in energy intake in the lutein-supplemented group compared with controls, as were body weight and appetite that was measured by the visual analogue scale tool. This is in agreement with studies on the other carotenoids, suggesting that carotenoids ameliorate adiposity, potentially through elevating energy expenditure, independent of changes in food intake(Reference Ikeuchi, Koyama and Takahashi52–Reference Takayanagi, Morimoto and Shirakura54).
The second hypothesis was that lutein supplementation may result in improving the metabolic parameters, which have been proposed with other carotenoids(Reference Ried and Fakler55–Reference Yoshida, Yanai and Ito58). In the present trial, significant reduction of the serum levels of TC was observed in lutein group compared with the control, while the serum levels of LDL-cholesterol were significantly decreased only in the lutein group and also TAG and HDL-cholesterol serum concentrations remained unaffected in the both study groups. There are few human studies on the effects of lutein on lipid profile with the mixed results. In a study on the patients with early atherosclerosis, the consumption of 20 mg/d lutein for 12 weeks significantly decreased LDL-cholesterol and TAG levels; however, between-group differences did not reach significance level(Reference Xu, Zou and Xiao37). Noteworthy, authors showed a significant negative association between serum levels of lutein and LDL-cholesterol and also suggested that increased serum levels of lutein following lutein intake were responsible for reduced levels of LDL-cholesterol(Reference Xu, Zou and Xiao37). In contrast, findings from another clinical trial on healthy individuals consuming 10 or 20 mg/d lutein for 12 weeks did not show any significant changes in lipid profile. Therefore, it seems that people with cardiovascular risk factors may be more likely to benefit from lutein consumption than healthy individuals. In addition, the influence of lutein supplementation on lipid profiles, particularly cholesterol levels, was also supported by animal models(Reference Han, Cui and Wang32,Reference Kim, Leite and deOgburn38) . In the Los Angeles atherosclerosis study, lutein administration significantly decreased plasma concentrations of very low and intermediate density lipoprotein as well as atherogenicity in mice, without significant changes in plasma levels of LDL-cholesterol or HDL-cholesterol(Reference Dwyer, Navab and Dwyer13). On the other hand, observational evidence did not show a significant association between serum levels of lutein and TC(Reference Ben Amara, Tourniaire and Maraninchi43,Reference Renzi, Hammond and Dengler59) , LDL-cholesterol(Reference Xu, Zou and Huang35,Reference Ben Amara, Tourniaire and Maraninchi43,Reference Renzi, Hammond and Dengler59) and TAG(Reference Sugiura, Nakamura and Ogawa24,Reference Suzuki, Ito and Inoue25,Reference Coyne, Ibiebele and Baade29,Reference Xu, Zou and Huang35,Reference Renzi, Hammond and Dengler59) , while there was a significant positive relationship between serum levels of lutein and HDL-cholesterol in the majority of studies(Reference Sugiura, Nakamura and Ogawa24,Reference Suzuki, Ito and Inoue25,Reference Coyne, Ibiebele and Baade29,Reference Renzi, Hammond and Dengler59,Reference Wang, Chung and McCullough60) .
Previously, we conducted a mechanistic systematic review on the effect of lutein on cardiovascular risk factors, such as dyslipidaemia(Reference Hajizadeh-Sharafabad, Ghoreishi and Maleki16). Accordingly, the possible mechanisms by which lutein could improve lipid profiles were mainly based on the incremental effects of lutein on LDL-cholesterol receptor and scavenger receptor class B type 1 which involved in the elimination of LDL from plasma and removal of cholesterol from peripheral tissues towards the liver, respectively, and thereby caused a reduction of plasma levels of cholesterol(Reference Hajizadeh-Sharafabad, Ghoreishi and Maleki16).
In the present study, values of FBS, HOMA-IR and QUICKI remained unchanged, probably due to the short study duration, that is consistent with the finding of a clinical trial on the patients with early atherosclerosis in which the intake of 20 mg/d for 12 weeks did not result in significant changes in FBS(Reference Xu, Zou and Xiao37). Nevertheless, the insulin resistance values expressed by HOMA-IR ≥ 2·5(Reference Matthews, Hosker and Rudenski61), observed in the present study, were progressed to a normal range following lifestyle modification in both groups. The results from a diabetic animal model showed a significant decrease in hyperglycaemia compared with the controls(Reference Sharavana, Joseph and Baskaran62). To our knowledge, there was no human intervention study of the effect of lutein on HOMA-IR and QUICKI. Our findings on glycaemic control also concurred with the results of observational studies; as of ten available studies(Reference Sugiura, Nakamura and Ogawa24,Reference Suzuki, Ito and Inoue25,Reference Coyne, Ibiebele and Baade29,Reference Coyne, Ibiebele and Baade33,Reference Ford, Will and Bowman34,Reference Ben Amara, Tourniaire and Maraninchi43,Reference Blondin, Yeung and Mumford63–Reference Sugiura, Nakamura and Ikoma66) , just two(Reference Coyne, Ibiebele and Baade33,Reference Ford, Will and Bowman34) found a significant inverse relationship between serum levels of lutein and glycaemia parameters. However, the number of in vivo studies was not enough to draw a definite conclusion about the effects of lutein on glycaemic control.
In conclusion, the present study, for the first time, provided strong evidence for the effects of lutein supplementation on body composition and lipid profile in obese middle-aged individuals. Based on our results, individuals who followed the LCD in combination with lutein consumption significantly experienced more body fat loss compared with individuals who followed the LCD alone. Moreover, lutein supplementation preserved lean mass during calorie restriction, whereas weight loss in the controls was paralleled by a significant decline of lean mass. Despite a significant reduction of WC in both lutein and control groups, a significant decrease in visceral fat was observed only in the lutein group, albeit without reaching statistical significance between the two arms. Regarding metabolic parameters, TC and LDL-cholesterol were significantly reduced in the lutein group, although the between-group difference was significant only for serum TC levels. No significant changes were observed in TAG, HDL-cholesterol, FBS, insulin resistance, NEFA and appetite sensations. Taken together, the major conclusion was that lutein can be considered as an adjuvant to an LCD in a weight loss programme for the obese older adults who not only are at high risk of age-related macular degeneration but also are prone to sarcopenia and metabolic disorders. Further well-designed studies with longer duration and in different age groups are warranted.
Strengths and limitations
Low dropout rate, individualised calorie-restricted diet and high level of compliance with treatment protocol can be considered as the study strengths. Moreover, inclusion of merely postmenopausal women and men aged over 45 years for partly controlling the potentially confounding variables of age and female sexual hormones were other advantages of the present study. Noteworthy to mention, the intervention period was designed for 12 weeks at the baseline of the study; however, due to coincidence of COVID-19 infection outbreak peak in Iran and the final parts of the study, we had to reduce the intervention period to 10 weeks, as we did not have access to the study subjects due to quarantine restrictions. Maybe some lack of statistically significant differences between the two study groups was because of the reduced period of intervention. Another limitation of the study was subjective assessment of dietary intake, appetite and PA using the self-reported methods, although under- and/or over-reporting of the aforementioned parameters is highly prevalent in obese people. On the other hand, we did not use dual-energy X-ray absorptiometry which is mainly considered the gold standard for body composition measurements due to the lack of access to this technique for the research project. Given that bioelectrical impedance analysis has been validated and is highly consistent with the gold standard method(Reference Guida, Laccetti and Gerardi67), it was used for measuring the body composition. Lack of the measurement of lutein plasma levels due to financial restrictions, which was the most appropriate method for measuring the compliance of the study subjects, considered another limitation of the present study. As previously stated, further studies for addressing the possible mechanisms underlying the reducing effects of lutein on body fat mass while preserving lean mass as well as improving lipid profile are highly recommended.
Acknowledgements
The authors express their sincere gratitude to all participants in the study. This paper was prepared based on data achieved from a PhD dissertation submitted to Tabriz University of Medical Sciences (Fatemeh Hajizadeh-Sharafabad).
This work was financially supported by the ‘Research Vice-Chancellor’ and ‘Nutrition Research Center’ of Tabriz University of Medical Sciences, Tabriz, Iran, Grant agreement no. 62935.
F. H.-S., A. T.-E. and Z.G. designed the study and contributed to the conception of the project; F. H.-S. and M.S. conducted the research; F. H.-S. analysed the data and drafted the manuscript. All authors read and approved the final manuscript.
The authors declare that there are no conflicts of interest.