


Mitochondria act as organelles that regulate a series of functions, such as lipid metabolism, energy production, calcium homeostasis and cell death. Therefore, regulating mitochondrial morphology and energy production plays an important role in maintaining cell health(Reference Bhargava and Schnellmann1). Mitochondrial fusion, fission and biogenesis determine the shape, quality and quantity of mitochondria, and also sense metabolic cues or respond to energy changes to maintain the function of mitochondria(Reference Mansouri, Gattolliat and Asselah2). Mitochondrial morphology is regulated by the balance between fusion and fission, and cells adjust mitochondrial morphology to coordinate the relationship between energy requirements and resource availability. Mitochondrial fusion leads to morphological extension, which increases the efficiency of ATP production, reduces the production of reactive oxygen species (ROS), exchanges mitochondrial DNA (mtDNA) and other matrix components between mitochondria and promotes oxidative phosphorylation(Reference Li, Gao and Chen3). According to reports(Reference Von Stockum, Nardin and Schrepfer4), two GTPase mitochondrial fusion proteins mitofusin 1 and 2 (MFN1/2) mediate mitochondrial outer membrane fusion, and optic atrophy protein 1 (OPA1) mediates mitochondrial inner membrane fusion. Mitochondrial fission is related to mitochondrial uncoupling and allows dysfunctional mitochondria to separate into mitochondrial targets(Reference Chaudhari and Kipreos5). In mammals, dynamin-related protein 1 (DRP1) is recruited to the mitochondrial outer membrane and combines with receptor proteins at the mitochondrial outer membrane, including mitochondrial fission protein 1 (FIS1), mitochondrial fission factor (MFF) and mitochondrial dynamics proteins of 49 and 51 kDa (MID49 and MID51). Eventually, these proteins oligomerise to form ring structures that separate mitochondria via constriction(Reference Losón, Song and Chen6). The integration of mitochondrial dynamics and the state of cell bioenergy can maintain the stability of mitochondrial quality and respond to bioenergy stress(Reference Dalmasso, Marin Zapata and Brady7). Research on mitochondrial dynamics shows that there is a strong connection between energy requirements/supply and mitochondrial morphology. The nutrient-rich environment separates mitochondria, while a starvation environment promotes mitochondrial fusion(Reference Liesa and Shirihai8). Therefore, bioenergetic adaptation may be associated with the remodelling of mitochondrial morphology.
Currently, intermittent fasting (IF) has been used as an effective method to control weight and improve metabolic health(Reference Rynders, Thomas and Zaman9). IF is mainly divided into intermittent energy restriction and time-restricted feeding. Growing evidence demonstrates the advantage of intermittent energy restriction in improving glucose and lipid homeostasis in short to medium term and preventing high-fat diet (HFD)-induced obesity and insulin resistance(Reference Baumeier, Kaiser and Heeren10,Reference Yang, Cao and Mao11) . Moreover, IF requires dynamic network remodelling through fusion and fission to maintain mitochondrial homeostasis(Reference Weir, Yao and Huynh12). The regulation of mitochondrial morphology is essential for cell energy homeostasis. However, whether the preventive effect of IF on diet-induced obese mice is related to the mitochondrial morphology within adipose tissue remains unknown.
Sirtuin 3 (Sirt3) regulates metabolism and protein acetylation during intermittent food deprivation or fasting(Reference Liu, Cheng and Li13). Studies have shown that Sirt3 expression increases significantly during fasting, which reduces the degree of acetylation of fatty acid β-oxidation-related enzymes(Reference Zhang, Zhou and Bai14). Sirt3-mediated trifunctional enzyme subunit α deacetylation directly promotes fatty acid β-oxidation and the content of trichloroacetic acid, decreases the lipid signalling which leads to insulin secretion and regulates the production of ATP(Reference Zhang, Zhou and Bai14,Reference Shimazu, Hirschey and Hua15) . Knockdown of Sirt3 fails to cause continuous cytoplasmic ATP production, increases acetylation of mitochondrial enzymes that participate in fatty acid β-oxidation, the tricarboxylic acid cycle (TCA) and the electron transport chain, and weakens calcium signal transduction(Reference De Marchi, Galindo and Thevenet16,Reference Tsuda, Fukushima and Matsumoto17) . Therefore, lysine acetylation is closely related to the metabolic state. In recent years, studies have demonstrated that a large number of proteins located in the mitochondria (the energy centre of cells) can be modified by lysine acetylation(Reference Osborne, Cooney and Turner18). This modification mainly relies on the Sirtuin family of nicotinamide adenine dinucleotide (NAD)+-dependent deacetylases(Reference Zhang, Wen and Luo19). In addition, OPA1 is deacetylated and activated by Sirt3 to exert its mitochondrial fusion function. When Sirt3 is absent, OPA1-mediated mitochondrial fusion function is inhibited(Reference Samant, Zhang and Hong20). This connects protein acetylation modifications with energy metabolism controlled by mitochondrial dynamics.
Recent work has shown the importance of reversible protein acetylation, such as changing the activity of class I HDAC and/or Sirtuin to maintain mitochondrial biological function and energy metabolism during normal heart and ischaemia–reperfusion injury(Reference Herr, Baarine and Aune21,Reference Herr, Singh and Dhammu22) . It is important to combine metabolomics and epigenomics techniques to reveal the mechanism that controls the dynamic changes in mitochondrial dynamics caused by the epigenetic modification of energy limitations caused by mitochondrial proteins. Changes in energy and nutrition lead to significant fluctuations in mitochondrial proteins and control the fate of mitochondria through post-translational modification. We deeply investigated the regulation of mitochondrial morphology through epigenetics and the regulation of cellular and the global energy metabolism. Our research provides several new ideas for the treatment and improvement of metabolic diseases, such as obesity, and for the maintenance of global energy metabolism in mammals.
Methods
Animal experiment
All experimental protocols were approved by the guidelines and regulations approved by the Animal ethics committee of Northwest A&F University (DK2022063). C57BL/6J male mice were purchased from the Laboratory animal centre of the fourth Military Medical University. ob/ob mice were purchased from VIEWSOILD. Initially, twenty-four 6-week-old C57BL/6J male mice were randomly divided into four groups (n 6 each). Mice were housed on a 12-h light/dark cycle and had free access to food and water. The researchers recorded the changes in body weight and food intake of the mice every 2 d. Two groups of mice were fed the standard chow diet (Chow, fat provided 10 % of total energy, Trophic Animal Feed High-tech Co., Ltd), and the other two groups were fed the HFD (fat provided 60 % of the total energy, Trophic Animal Feed High-tech Co., Ltd). In addition, twelve ob/ob mice were randomly divided into two groups (n 6 each) and housed under the same conditions, with all ob/ob mice fed the HFD and fed an ad libitum diet for 12 weeks. In the second phase, six groups of mice were treated with IF, which divided the mice into six groups, wild-type (WT) (n 6), WT-IF (n 6), HFD (n 6), HFD-IF (n 6), ob/ob (n 6) and ob/ob-IF (n 6). The WT, HFD and ob/ob groups were fed under the same conditions as the ad libitum, WT-IF, HFD-IF and ob/ob-IF mice, which were treated with IF. The IF group was fed ad libitum for 8 h (23:00–7:00), and fasting was administered for the remaining 16 h (7:00–23:00). The second phase lasted for 4 weeks. Finally, tissue was collected after overnight fasting. Blood samples were collected from all six groups of mice by orbital blood sampling after overnight fasting, and the serum was collected by centrifugation and stored at −80°C for testing. Serum samples were tested to detect multiple biochemical parameters using serum biochemical indicator kits, including total cholesterol (TC, Jiancheng), total TAG (Jiancheng), HDL (Jiancheng) and LDL (Jiancheng).
Cell culture
Overexpression plasmid vectors of sirt3 (pc-Sirt3) were constructed in our lab (F: 5′-CCCAAGCTTATGGCGCTTGACCCTCTAGG-3′, R: 5′-TGCTCTAGATTATCTGTCCTGTCCATCCAGC-3′, Hind III: AAGCTT, Xba I: TCTAGA), and the interference vectors of Sirt3 were constructed by TSINGKE.
The frozen 3T3-L1 adipose precursor cells (Shanghai Bioleaf Biotech Co) were resuscitated, passaged and plated. Cells were cultured in DMEM containing 10 % foetal bovine serum and placed in a humidified incubator at 37°C and 5 % CO2. Transfection was performed when the cell density reached approximately 75 %. Taking a six-well plate as an example, approximately 6 h before transfection, the medium was changed to serum-free medium without penicillin–streptomycin solution. 2 μg of recombinant plasmid and 2 μl of transfection reagent were added to the serum-free medium, vortexed to mix and incubated for 20 min. The mixed solution was added to a petri dish and placed in an incubator for 6 h and was then replaced with a normal culture medium. After 48 h, induction solution I (IBMX: 0·5 mmol/l, Dex: 1 mmol/l, insulin: 10 ug/ml) was added for 2 d, and then induction solution II (insulin: 10 ug/ml) was switched for 8 d. After 8 d, the cells were collected for further processing. For drug treatment, JNK inhibitor SP600125 (SP) and activator Anisomycin (Ani) were purchased from MedChemExpress. In accordance with previous studies(Reference Xiao, Wang and Yuan23,Reference Laursen, Kessler and Fröhli24) , cells were incubated with 10 μM SP600125 or 1 μg/ml anisomycin for 30 min.
Transmission electron microscopy and mitochondrial analysis
Mouse inguinal white adipose tissue (iWAT) was collected immediately after execution, quickly cut into 1 mm × 1 mm × 1 mm pieces, placed in 2·5 % glutaraldehyde (0·1 M, pH 7·2–7·4) for 24 h, and rinsed three times in PBS buffer (pH 7·2, 0·1 mol/l) for 15 min each. Tissue was dehydrated using an ethanol gradient (30 %, 50 %, 70 %, 80 %, 90 % and 100 %) twice for 10 min each. Next, resin infiltration was performed with 25 % embedding agent for 2 h, 50 % embedding agent for 8 h, 75 % embedding agent for 12 h and pure embedding agent twice, each time at room temperature for 24 h. Subsequent embedding was performed using embedding mould and cured in an oven at 55°C for 48 h. After curing, the sections were sectioned using an ultrathin sectioning machine. Staining was conducted using 2 % UO2 acetate for 30 min and lead citrate for 10 min. After staining, sections were observed under transmission electron microscopy (TEM).
For mitochondrial aspect ratio analysis, according to previous studies(Reference Gómez-Valadés, Pozo and Varela25), each individual mitochondrial in the electron microscopy images was manually outlined using ImageJ software (n 8 each group). Mitochondrial marker consistency checks were performed twice on all samples. We used the mitochondrial aspect ratio (AR = long axis/short axis) as a measure of mitochondrial shape.
Mitochondrial isolation and Janus Green B staining
The mitochondrial extraction kit was purchased from Solarbio. Fresh mouse iWAT (100–200 mg) was rinsed with PBS, cut into pieces and placed in a small volume glass homogenizer. Next, 1·0 ml of ice precooled lysis buffer was added, and the tissue was homogenised thirty times in an ice bath at 0°C. The homogenised tissue was transferred to a centrifuge tube and centrifuged at 1000 × g for 5 min at 4°C. The supernatant was removed, transferred to a new tube and centrifuged at 1000 × g for 5 min at 4°C. The supernatant was removed, transferred to a new tube and centrifuged at 12 000 × g for 10 min at 4°C. Next, 0·5 ml of wash buffer was added to the sediment, and the mitochondrial sediment was resuspended at 1000 × g for 5 min at 4°C. The supernatant was transferred to a new tube and centrifuged again at 4°C, 12 000 × g for 10 min. The supernatant was discarded, and the mitochondrial precipitate was resuspended in 50 μl of Store buffer to obtain complete and purified mitochondria for immediate use for experiments or storage at −70°C.
The freshly extracted mitochondria were mixed with Janus Green B staining solution (0·05 %) (Solarbio) for 3 min and observed under a fluorescence microscope.
JC-1 staining
The JC-1 staining kit was purchased from UE. It is a fluorescent probe widely used to detect mitochondrial membrane potential. Mitochondria were extracted from 100 to 200 mg mouse iWAT, and the mitochondrial precipitate from the last step was retained (without Store Buffer) and added directly into 0·5 ml of JC-1 working solution (10 μl of 100 × JC-1 staining solution was added to 890 μl of sterilised diH2O, mixed well followed by the addition of 100 μl of 10 × Assay Buffer, that was then vortexed to fully mix). Mitochondria were resuspended, incubated at 37°C for 15 min and centrifuged at 1000 × g for 5 min at room temperature. The staining solution was removed, and the precipitates were washed twice with PBS buffer. Finally, the precipitate was resuspended in 0·5 ml PBS and observed under a fluorescence microscope. The mitochondria fluoresced red at 590 nm and green at 530 nm.
NAD+ detection
NAD+ content assay kit was purchased from Nanjing Jiancheng Bioengineering Institute. Mouse iWAT (0·1 g) or 5 × 10⁶ cells were added to 1 ml of acidic extract, ground in an ice bath, boiled for 5 min, cooled on ice and centrifuged at 10 000 × g for 10 min at 4°C. The supernatant was mixed with an equal volume of alkaline extract and centrifuged at 10 000 × g for 10 min at 4°C. After tissue samples fully reacted with the test reagents in the kit according to the instructions, the absorbance was measured at 570 nm with a 1-cm optical diameter cuvette. The sample reaction product was recorded as A1 and the control product was recorded as A0. NAD+ content: NAD+ (µmol/g tissue or nmol/104 cells) = (A1-A0–0·099) x 72·2 ÷ 0·1 × 1000.
ATP detection
The ATP content assay kit was purchased from Nanjing Jiancheng Bioengineering Institute. For mouse iWAT samples, 0·1 g iWAT was accurately weighed, 900 μl of preboiled double-distilled water was added to prepare a 10 % homogenate that was placed in boiling water for 10 min, mixed and extracted for 1 min and then centrifuged at 3500 rpm for 10 min and the supernatant was taken for measurement. Samples and reagents in the kit were mixed and reacted thoroughly according to the instructions. The absorbance of the products was measured at 636 nm using a 0·5-cm optical diameter cuvette. The absorbance of the control group was recorded as A0 and that of the sample was recorded as A1. The absorbance of the blank control was recorded as A2 and that of the standard was recorded as A3. Tissue ATP concentration: ATP (nmol/mg protein) = (A1-A0)/(A3-A2) × Cstandard (1 × 10³ nmol/ml) ÷ Csample (protein concentration). The protein concentration of the product supernatant was determined using the BCA protein concentration kit (Solarbio).
For cell samples, 106 cells were collected and 300–500 μl of preboiled double-distilled water was added and placed in boiling water to homogenise and break up. To prepare for the assay, the cell suspension was heated in boiling water for 10 min, mixed and extracted for 1 min. The subsequent assay and calculations were the same as those for the tissue samples.
Measurement of mtDNA copy number
Total DNA was extracted from mouse iWAT or 3T3-L1 adipocytes using the Animal Tissues/Cells Genomic DNA Extraction Kit (Solarbio). The mtDNA copy number was detected by qPCR with the following reagents: The mitochondrial DNA was represented by the gene primer sequence encoded by 12 s RNA, primer sequence: mtDNA-F: ACCGCGGTCATACGATTAAC, mtDNA-R: CCCAGTTTGGGTCTTAGCTG. The nuclear-encoded Gcg gene was used to represent nuclear DNA as a loading control, primer sequences: nucDNA-F: CAGGGCCATCTCAGAACC, nucDNA-R: GCTATTGGAAAGCCTCTTGC.
Reactive oxygen species fluorescence detection
The ROS detection kit was purchased from UE. DCFH-DA, a fluorescent probe specific for intracellular ROS, can pass freely through the cell membrane into living cells and is hydrolysed by intracellular esterases to form DCFH, which is nonfluorescent and cannot pass through the cell membrane and is then oxidised by intracellular ROS to produce DCF with fluorescence. After cell culture, DCFH-DA was diluted 1:1000 with serum-free medium to a final concentration of 10 μM. The original medium was removed from the plates and an appropriate volume (no less than 1 ml for six-well plates) of DCFH-DA was added and incubated for 30 min at 37°C in a cell culture incubator protected from light. After incubation, the cells were then washed twice with serum-free medium to fully remove any DCFH-DA that had not entered the cells and then placed under a fluorescence microscope for observation.
MitoTracker red
MitoTracker Red CMXRos Kit was purchased from Beyotime. When the cells grew to the desired confluency, the medium was removed, and MitoTracker Red CMXRos staining working solution (100 nM, prewarmed at 37°C) was added. The cells were incubated for 40 min under normal culture conditions. After staining, the cells were washed with medium and replaced with freshly prepared and prewarmed buffer containing 2–4 % formaldehyde for cell fixation. After fixation, the cells were washed, and diluted DAPI was added to stain the nuclei for 1 min. The cells were observed under a fluorescence microscope.
Label-free proteomic analysis of acetylation modification of mouse adipose tissue
The sample was removed from −80°C, 100–200 mg of tissue sample was weighed into a mortar precooled with liquid nitrogen and liquid nitrogen was added to fully grind the tissue to a powder. The samples of each group were added to 4 times the volume of lysis buffer (8 M urea, 1 % protease inhibitor, 3 μM trichostatin A (TSA), 50 mM nicotinamide (NAM) and 2 mM EDTA) and lysed ultrasonication. The samples were centrifuged at 12 000 × g for 10 min at 4°C to remove cell debris, the supernatant was transferred to a new centrifuge tube, and a BCA kit was used to determine the protein concentration. The sample was sent to post-translational modification BIO for trypsin digestion, affinity enrichment, LC/MS analysis, database search and bioinformatics analysis.
CRISPR-Cas9
http://crispr.dbcls.jp/ website and Primer Premier 6·0 primer design software were used to design primer sequences (Target 1-F: TAGAGTCGAAGTAGTGATTGCGTCAGAGCGAACACGTTTG, Target 1-R: GCTATTTCTAGCTCTAAAACCAAACGTGTTCGCTCTGACG, Target 2-F: TAGAGTCGAAGTAGTGATTGGGTGGCCACAATGGTAGCGT, Target 2-R: GCTATTTCTAGCTCTAAAACACGCTACCATTGTGGCCACC, 2300-Cas9-F: GTAAAAC-GACGGCCAGTGCC, 2300-Cas9-R: CAATTTGTGAAATATCCCGGGG). The target sequences were cloned by PCR. Target 1 and Target 2 were ligated to CAS9-IV plasmids. The product of the previous step was used as a template, and 2300-Cas9 was cloned by PCR with the designed primers. After double digestion of plasmid 2300-CAS9 with HindIII and SmaI, the digestion product was ligated to Target 1-iv and Target 2-iv. The products were quickly transformed into competent cells. The recombinant plasmid was identified by colony PCR, the recombinant plasmid was extracted and positive strains were selected and sent to TSINGKE for sequencing.
RNA extraction and real-time PCR
Total RNA of tissues or cells were extracted with TRIpure Reagent kit (Takara). 500 ng of total RNA was reverse transcribed using an M-MLV reverse transcriptase kit (Takara). Primers were synthesised by Invitrogen. Real-time PCR procedures were performed as described previously(Reference Wei, Li and Che26).The levels of mRNA were normalised to Gapdh. The expression of genes was analysed by the 2−△△Ct method.
Immunoblotting and antibodies
According to our previous studies(Reference Wei, Li and Che26), protein was isolated from tissues or cultured cells. Western blotting was performed as previously described(Reference Wei, Li and Che26). Protein samples (30 μg) were separated by electrophoresis on 12 % and 5 % SDS-PAGE gels using a slab gel apparatus and transferred to polyvinylidene fluoride (PVDF) membranes (Millipore). Antibodies against OPA1 (ab157457, Abcam), FIS1(ab156865, Abcam), MFF (ab129075, Abcam), SIRT3(ab189860, Abcam), SIRT1 (ab110304, Abcam), Pan-Kac antibody (ab190479, Abcam), β-actin (ab8226, Abcam), GAPDH(AB0037, Abways), ATF2 (CY5037, Abways), TOM20 (CY5527, Abways), JNK (CY5490, Abways), p-JNK (CY5541, Abways) and the secondary antibody (AB0101, Abways) were used. Proteins were visualised using chemiluminescent peroxidase substrate (Millipore), and then the blots were quantified using the ChemiDoc XRS system (Bio-Rad).
Co-immunoprecipitation and acetylation assay
Co-immunoprecipitation Kit was purchased from Themo. Cells were harvested 48 h after transfection, and cell lysis buffer was added. Subsequent steps were performed in strict accordance with the instructions within the kit. Antibodies against MDH2 (ab110317, Abcam) and Pan-Kac (ab190479, Abcam) antibodies were used.
Glucose tolerance test and insulin tolerance test
For the glucose tolerance test, mice were fasted overnight, glucose (1 g/kg) was administered intraperitoneally (i.p.), and blood glucose levels were measured at 0 min, 30 min, 60 min, 90 min and 120 min using a glucometer.
For the insulin tolerance test, mice were fasted for 4 h and i.p. injected with insulin (0·75 U/kg), and blood glucose levels were measured at 0 min, 15 min, 30 min, 45 min and 60 min using a glucometer.
Statistical analysis
Statistical analyses were conducted using SPSS (version 19.0). To examine the significant differences between groups, the data were compared using Student’s t test, whereas data comparisons across more than two groups were performed using one-way or two-way ANOVA, followed by Bonferroni’s post hoc tests. Data were presented as the mean ± sem. P < 0·05 was considered to be significant, and P < 0·01 was considered to be highly significant.
Results
Intermittent fasting improves metabolism and promotes mitochondrial fusion in high-fat diet mice
We fed C57BL/6 WT mice a HFD for 12 weeks and then began IF for 4 weeks. After IF, the weight of the mice was significantly reduced (P < 0·05), but there was no significant change in food intake (Fig. 1(a) and (b)). After separating the mouse adipose tissues, the weight of each adipose tissue was measured, and the ratio of adipose tissue to body weight was calculated. The most significant reduction was observed in iWAT (P < 0·05) (Fig. 1(c)). Furthermore, the blood serum concentrations of major metabolites in the mice were measured, and IF significantly reduced the levels of TC (P < 0·05), TAG (P < 0·05) and LDL (P < 0·01) and had an upwards trend in HDL (P = 0·068) (online Supplementary Fig. S1A). We also found that IF improved glucose tolerance in HFD mice (online Supplementary Fig. S1B). Adipose tissue is a key regulator of energy metabolism, and time-restricted feeding has been proven to directly improve energy metabolism in mouse iWAT(Reference Hepler, Weidemann and Waldeck27), therefore, we chose iWAT for subsequent study. We isolated and purified iWAT mitochondria and detected the mitochondrial markers TOM20 and OPA1, which are expressed only in mitochondria (online Supplementary Fig. S1C). Through Janus Green B staining, we observed a reduction in the number of mitochondria in the IF group of mice (online Supplementary Fig. S1D). Next, the changes in mitochondrial morphology were explored. We observed mouse iWAT under a TEM. The mitochondrial morphology of iWAT after IF tended to be prolonged, showing a mitochondrial fusion morphology (Fig. 1(d)). Interestingly, we also observed that the HFD caused mitochondrial division (Fig. 1(d)). Meanwhile, IF significantly increased the mitochondrial AR (P < 0·01) (Fig. 1(e)). In addition, IF significantly increased the expression of the mitochondrial fusion protein OPA1 and decreased the expression of the fission proteins FIS1 and MFF (P < 0·01) (Fig. 1(f)). IF also significantly increased the mRNA levels of mitochondrial the fusion genes Opa1 and Mfn2 (P < 0·01) and decreased the mRNA levels of the mitochondrial division genes Fis1 and Drp1 (P < 0·05) (Fig. 1(g)). Therefore, the above results indicate that IF promotes iWAT mitochondrial fusion in HFD mice.

Fig. 1. IF promotes iWAT mitochondrial fusion in HFD mice. (a, b) Body weight (a) and food intake of HFD and HFD–IF mice (HFD n 6, HFD–IF n 6). (c) Weight ratio of adipose tissue to body weight (HFD n 6, HFD–IF n 6). (d) TEM image of HFD (Left) and HFD–IF (Right) mouse iWAT, arrows point to mitochondria. Scale bar, 1 μm. (e) Quantification of mitochondrial aspect ratio, n 8 each group. (f) Western blotting of mitochondrial fusion and division-related protein and its quantification, n 3. (g) RT-qPCR of mitochondrial fusion and division-related gene, n 4. *P < 0·05, **P < 0·01 compared with control group. Data are mean ± sem. HFD, high-fat diet; IF, intermittent fasting; TEM, transmission electron microscopy.
Intermittent fasting partially promotes mitochondrial fusion in wild-type and obese mice
Meanwhile, we administered IF procedures on C57BL/6 WT and leptin-deficient obese mice (ob/ob) mice, aiming to explore whether IF has an effect on the morphology and number of mitochondria in both types of mice. In WT mice, after isolating iWAT mitochondria and staining them with Janus Green B, the number of iWAT mitochondria in WT mice was also reduced (online Supplementary Fig. S2A). Observations under TEM showed that the mitochondrial morphology after IF tended to be extended, and it also had an increased mitochondrial AR, showing a mitochondrial fusion morphology (Fig. 2(a)). IF significantly increased the expression of the mitochondrial fusion protein OPA1 (P < 0·05); however, the expression of the fission proteins FIS1 (P = 0·83) and MFF (P = 0·61) was not significantly different (Fig. 2(b)). In addition, IF significantly increased the mRNA level of the mitochondrial fusion gene Opa1 (P < 0·05) and reduced the mRNA levels of the mitochondrial division gene Fis1 (P < 0·01) (Fig. 2(c)). The results indicate that IF promotes iWAT mitochondrial fusion in WT mice. In ob/ob mice, we found that IF also reduced the number of iWAT mitochondria (online Supplementary Fig. S2B). However, IF showed no significant change in the mitochondrial AR in ob/ob mice (P = 0·49) (Fig. 2(d)). Although IF significantly increased the expression of the mitochondrial fusion protein OPA1 (P < 0·01), the expression of FIS1 (P = 0·16) and MFF (P = 0·25) was not significantly different (Fig. 2(e)). Meanwhile, IF significantly reduced the mRNA level of the mitochondrial division gene Fis1 (P < 0·05), but there were no significant changes in the other mitochondrial fusion- and division-related genes Opa1 (P = 0·052), Mfn2 (P = 0·061) and Drp1 (P = 0·21) (Fig. 2(f)). Thus, the above results indicate that IF partially promotes iWAT mitochondrial fusion in WT or ob/ob mice but is much less significant than IF in HFD mice, especially genetically obese ob/ob mice.

Fig. 2. IF leads to a tendency for mitochondria to fuse in wild-type and obese mice. (a) TEM image of WT (Left) and WT-IF (Right) mouse iWAT, arrows point to mitochondria. Scale bar, 1 μm. And mitochondrial aspect ratio quantification, n 8. (b) Western blotting of mitochondrial fusion and division-related protein and its quantification, n 3. (c) RT-qPCR of mitochondrial fusion and division-related gene, n 4. (d) TEM image of WT (Left) and WT-IF (Right) mouse iWAT, arrows point to mitochondria. Scale bar, 1 μm. And mitochondrial aspect ratio quantification, n 8 each group. (e) Western blotting of mitochondrial fusion and division-related protein and its quantification, n 3. (f) RT-qPCR of mitochondrial fusion and division-related gene, n 4. *P < 0·05, **P < 0·01 compared with control group. Data are mean ± sem. IF, intermittent fasting; WT, wild type; TEM, transmission electron microscopy
Intermittent fasting improves mitochondrial function in mouse inguinal white adipose tissue
Mitochondrial fusion is usually accompanied by an improvement in mitochondrial function(Reference Chan28). Therefore, we explored whether IF affects the mitochondrial function in HFD, WT or ob/ob mice. We used a JC-1 fluorescent probe to detect the mitochondrial membrane potential of mouse iWAT. In HFD mice, JC-1 staining showed increased red fluorescence, and the ratio of red to green fluorescence also increased significantly (P < 0·01); that is, the mitochondrial membrane potential increased (online Supplementary Fig. S3A). Next, the ATP content of mouse iWAT was detected, and results showed that IF significantly promoted ATP production (P < 0·01) (Fig. 3(a)). Subsequently, RT-qPCR was applied to detect the mtDNA copy number in mouse iWAT. The results in Fig. 3(b) demonstrated that IF significantly increased the copy number of mitochondrial DNA (P < 0·01). Following the detection of the mRNA expression of mitochondrial function-related genes under IF, the results showed that IF significantly increased the mRNA expression levels of Tfam, Uqcrc, ATP5a1, Cox4i1 and Sdhb (Fig. 3(c)). All of the above results indicate that IF has a significant impact on improving the mitochondrial function of HFD mice. In WT mice, after IF, the mitochondrial membrane potential was significantly increased (online Supplementary Fig. S3B). IF also promoted the production of ATP (P < 0·01) (Fig. 3(d)), but the effects on the mtDNA copy number were not significant (P = 0·065) (Fig. 3(e)). Moreover, the mRNA expression of the mitochondrial function-related genes Tfam, Uqcrc, ATP5a1 and Sdhb was significantly increased (Fig. 3(f)). Interestingly, similar results with WT mice were obtained from ob/ob mice after IF. Manifesting as a significant increase in mitochondrial membrane potential (online Supplementary Fig. S3C) and ATP production (Fig. 3(g)), the mtDNA copy number exhibited an upwards trend (P = 0·074) (Fig. 3(h)). However, the mitochondrial function-related genes showed no significant changes and even showed significant downregulation of ATP5a1 and Cox4i1 (Fig. 3(i)). Overall, our results indicate that the effect of IF on mitochondrial fusion and function was most remarkable in diet-induced obese (HFD) mice, and there was a tendency to promote mitochondrial function in WT mice and ob/ob mice, but the tendency was not as significant as that in HFD mice.

Fig. 3. IF improves mitochondrial function of mice iWAT. (a, d and g) Measurement of mitochondrial ATP content in mouse iWAT, n 3. (b, e and h) Measurement of mtDNA in mouse iWAT, n 4. (c, f and i) RT-qPCR of mitochondrial function-related genes in mouse iWAT, n 4. *P < 0·05, **P < 0·01 compared with control group. Data are mean ± sem. IF, intermittent fasting.
Intermittent fasting induces SIRT3 expression and protein deacetylation in inguinal white adipose tissue of high-fat diet mice
To elucidate the proteomic changes induced by IF in HFD mice to explain the molecular mechanisms by which IF improves mouse health, we performed a label-free proteomic analysis of HFD mouse iWAT. Meanwhile, we extracted the total protein of iWAT from HFD mice and detected its acetylation level. The results showed that IF significantly promoted the deacetylation of iWAT protein in HFD mice (P < 0·05) (Fig. 4(a)). Subcellular structural localisation analysis revealed that 22 % of proteins with altered acetylation levels were localised to mitochondria (Fig. 4(b)). The cluster analysis heatmap based on GO enrichment shows that IF activates NAD (Fig. 4(c)), which has a positive effect on mouse iWAT. In addition, the NAD+ content was also consistent with the sequencing results, and IF significantly increased the NAD+ content of mouse iWAT (P < 0·01) (Fig. 4(d)), which also indicated inhibition of the acetylation level. The above results illustrate that IF promotes the deacetylation of iWAT protein in HFD mice. Several studies have demonstrated that Sirt3 is activated during IF and shows higher deacetylation of mitochondrial proteins in response to mitochondrial metabolism and obesity progression(Reference Wang, Cao and Zheng29,Reference Yang, Yang and Baur30) . Therefore, the effect of IF on Sirtuin expression in the iWAT of HFD mice was further explored. IF significantly increased the mRNA expression level of Sirt3 (P < 0·05); however, there was no significant effect on Sirt1 (P = 0·075), Sirt2 (P = 0·37) or Sirt5 (P = 0·56) (Fig. 4(e)). IF also increased the protein expression of SIRT3 (P < 0·05) (Fig. 4(f)). The enrichment analysis of the KEGG pathway shows that the protein modification level of the TCA cycle metabolism pathway changed significantly (Fig. 4(g)). The heatmap of the proteins corresponding to the differentially modified sites shows that MDH2 is the key enzyme of the TCA cycle in the most significantly different modifiable proteins (Fig. 4(h)). The cluster analysis heatmap based on GO enrichment shows that the biological process of mitochondrial membrane composition changed significantly (Fig. 4(i)), indicating that protein deacetylation caused by IF is closely related to the changes in mitochondrial membrane components. Overall, our results indicate that IF deacetylates mitochondrial proteins by promoting Sirt3 expression in iWAT of HFD mice. Sirt3-mediated protein deacetylation may be an important process in the regulation of energy metabolism by IF.

Fig. 4. IF induces Sirt3 expression and protein deacetylation in iWAT of HFD mice. (a) Protein acetylation level in HFD (Left) and HFD–IF (Right) mouse iWAT and its quantification, n 3 each group. (b) Subcellular structural localisation of proteins corresponding to differentially expressed acetylation sites in HFD–IF group compared with HFD group. (c) Cluster analysis of upregulated molecular function in HFD–IF group based on GO enrichment. (d) Measurement of NAD+ content between HFD with HFD–IF mouse iWAT, n 4 each group. (e) mRNA expression of sirtuins family genes, n 4 each group. (f) protein expression of sirtuins family genes and quantification, n 3 each group. (g) KEGG pathway enrichment of proteins corresponding to differentially modified sites in HFD–IF group compared with HFD group. (h) Differentially modified sites analysis in HFD–IF group compared with HFD group. (i) Cluster analysis of upregulated biological process in HFD–IF group based on GO enrichment. *P < 0·05, **P < 0·01 compared with control group. Data are mean ± sem. HFD, high-fat diet; IF, intermittent fasting.
Sirt3 promotes mitochondrial fusion and improves mitochondrial function
IF regulates mitochondrial fusion and fission dynamics, and Sirt3 is closely related to metabolic improvements caused by IF. However, the mechanism of Sirt3-induced deacetylation levels of mitochondrial metabolism-related proteins and mitochondrial fusion and fission dynamics is still unknown. Thus, we further explored whether Sirt3 regulates mitochondrial dynamics or improves mitochondrial function. The Sirt3 overexpression vector was constructed using the pc-DNA3·1 plasmid. After treating the adipocytes with pc-Sirt3 and si-Sirt3, the overexpression and interference efficiency of pc-Sirt3 and si-Sirt3 were significant (P < 0·05) (Fig. 5(a)). Next, we isolated and purified adipocyte mitochondria after treatment with pc-Sirt3 and si-Sirt3 (online Supplementary Fig. S4A). Using Janus Green B staining and the mitochondrial probe mitoTracker, which labels mitochondria in cells, we demonstrated that pc-Sirt3 reduces the number of adipocyte mitochondria (Fig. 5(b) and online Supplementary S4B). More importantly, pc-Sirt3 increased the mRNA levels of Opa1 and Mfn2 and inhibited Drp1 and Fis1 (P < 0·05) (Fig. 5(c)). At the protein expression level, pc-Sirt3 increased the expression level of the fusion protein OPA1 (P < 0·01) and inhibited the fission proteins FIS1 and MFF (P < 0·05) (Fig. 5(d)). The above results indicate that Sirt3 promotes the mitochondrial fusion of adipocytes. We further explored the effect of Sirt3 on mitochondrial function. The ATP content of adipocytes increased after pc-Sirt3 treatment (P < 0·05), as si-Sirt3 inhibited ATP production (P < 0·05) (Fig. 5(e)). In addition, pc-Sirt3 increased adipocyte mtDNA (P < 0·05) (Fig. 5(f)). pc-Sirt3 increased the mRNA expression of the mitochondrial function markers ATP5a1, Sdhb, Tfam and Ndufb8 (P < 0·05) (Fig. 5(g)). Dysregulation of adipose tissue energy homeostasis is often accompanied by increased ROS levels(Reference Ahmed, Sultana and Greene31). By measuring ROS production, we found that pc-Sirt3 inhibited adipocyte ROS production, while si-Sirt3 produced the opposite result (P < 0·05) (online Supplementary Fig. S4C). The above results indicate that Sirt3 improves mitochondrial function by promoting mitochondrial fusion in adipocytes.

Fig. 5. Sirt3 promotes mitochondrial fusion and improves mitochondrial function. (a) Overexpression and interference efficiency of pc-Sirt3 and si-Sirt3, n 4. (b) mitoTracker probe staining. Scale bar, 300 μm. (c) RT-qPCR of mitochondrial fusion and division-related gene, n 4. (d) Western blotting of mitochondrial fusion and division-related protein and its quantification, n 3. (e) Measurement of adipocyte mitochondrial ATP content, n 3. (f) Measurement of adipocyte mtDNA, n 4. (g) RT-qPCR of adipocyte mitochondrial function-related gene, n 4. * P < 0·05, **P < 0·01 compared with control group. Data are mean ± sem.
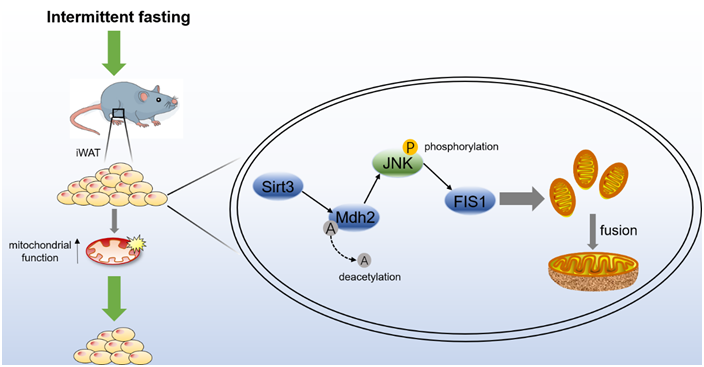
Sirt3 deacetylates Mdh2 and promotes mitochondrial fusion by inhibiting the JNK-FIS1 pathway
According to the sequencing results, the protein modification level of the metabolic pathway of the TCA cycle changes significantly, and Mdh2, the most significant modifiable protein is the key enzyme of the TCA cycle (Fig. 4(g) and (h)). Sirt3 is known as an NAD+-dependent deacetylase(Reference Zhang, Wen and Luo19). To verify this result, the NAD+ content of adipocytes treated with pc-Sirt3 and si-Sirt3 was first detected, Fig. 6(a) shows that pc-Sirt3 increased the NAD+ content in adipocytes (P < 0·05), and si-Sirt3 reduced the NAD+ content (P < 0·05). Furthermore, the total protein acetylation level of adipocytes was tested, and pc-Sirt3 inhibited the acetylation level (P < 0·01), while si-Sirt3 showed the opposite effect (Fig. 6(b)). To explore whether Sirt3 induced by IF modulates Mdh2 acetylation levels, the Mdh2 protein of adipocytes treated with pc-Sirt3 and si-Sirt3 was purified by IP, and its acetylation level was detected. The result showed that pc-Sirt3 deacetylated Mdh2 (P < 0·01) (Fig. 6(c)). The JNK-FIS1 pathway may play an important role in the regulation of mitochondrial fusion and fission and mitochondrial function(Reference Yao, Jing and Guo32). Therefore, the JNK inhibitor SP600125 (SP) and JNK activator anisomycin (Ani) were used to treat adipocytes. As shown in Fig. 6(d), pc-Sirt3 inhibited the protein levels of p-JNK/JNK and FIS1 (P < 0·05). After applying the inhibitor SP, the inhibitory effect of pc-Sirt3 on p-JNK/JNK and FIS1 was more significant (P < 0·05), and this inhibitory effect was weakened after supplementing the agonist Ani (Fig. 6(d)). The above results indicate that Sirt3 deacetylates Mdh2 and regulates the JNK-FIS1 pathway. To explore whether Sirt3 affects the JNK-FIS1 pathway by regulating the level of Mdh2 acetylation, we treated adipocytes with Cas9-Mdh2 and knocked out Mdh2 (Fig. 6(e)) and then treated Mdh2−/− adipocytes with pc-Sirt3 or si-Sirt3 to detect the protein expression levels of p-JNK, JNK and FIS1. As shown in Fig. 6(f), pc-Sirt3 inhibited the expression of p-JNK and FIS1 (P < 0·01), but the inhibitory effect of pc-Sirt3 on the JNK-FIS1 pathway was significantly reduced after Mdh2 was knocked out (P < 0·05). In addition, pc-Sirt3 promoted the mRNA levels of the mitochondrial fusion genes Opa1 and Mfn2 (P < 0·05) and strongly inhibited the expression of Fis1 (P < 0·01). However, when Mdh2 was knocked down, this trend was weakened after knocking down Mdh2 (Fig. 6(g)). Overall, our results reveal that Sirt3 inhibits the JNK-FIS1 pathway by deacetylating Mdh2 to promote mitochondrial fusion.

Fig. 6. Sirt3 deacetylates Mdh2 and promotes mitochondrial fusion by inhibiting the JNK-FIS1 pathway. (a) Measurement of adipocyte NAD+ content, n 3. (b) Adipocyte total protein acetylation level and its quantification, n 3. (c) Co-immunoprecipitation of Mdh2 acetylation level and its quantification. (d) P-JNK, JNK and FIS1 protein levels and their quantification after SP or Ani treatment and protein quantitative, n 3. (e) Mdh2 mRNA levels in adipocytes treated with 2300-Cas9 + Target 1 and 2300-Cas9 + Target 2, n 4. (f) P-JNK, JNK and FIS1 protein levels and their quantification, n 3. (g) RT-qPCR of mitochondrial fusion and division-related genes, n 4. *P < 0·05, **P < 0·01 compared with control group. Data are mean ± sem.
Discussion
IF has drawn increasing attention in recent years and is considered a novel and promising method for weight loss and inflammation reduction. In addition, IF is believed to have great potential in improving long-term health. Studies have shown that IF can reduce weight and have an effect on heart protection(Reference Garza-González, Nieblas and Solbes-Gochicoa33,Reference Varady, Bhutani and Klempel34) . This protective effect may be related to decreased lipid deposition, increased adiponectin concentration and decreased leptin and LDL concentrations(Reference Patterson and Sears35). During fasting, fat is consumed after the activation of the gluconeogenesis process, and then the body supplies energy by glucose-ketone (G-to-K) conversion(Reference Mattson, Moehl and Ghena36,Reference Wilhelmi de Toledo, Grundler and Bergouignan37) . Therefore, IF is effective for reducing lipid deposition, as well as inducing a series of biochemical changes to improve their resistance to stress, injury and disease(Reference Mattson, Moehl and Ghena36,Reference Zhang, Gao and Deng38) . In our study, IF significantly reduced body weight in HFD mice, demonstrating the health benefits of IF in obese patients.
Mitochondria participate in core central metabolic pathways, particularly adipose tissue-related energy metabolism processes(Reference Annesley and Fisher39). According to TEM observations from previous studies, the skeletal muscle mitochondria of subjects with type 2 diabetes and obesity are smaller than those of fasted and lean volunteers, and the bioenergetic function of their mitochondria is impaired(Reference Kelley, He and Menshikova40). In our study, three models, diet-induced obese mice (HFD mice), normal mice (WT mice) and genetically obese mice (ob/ob mice), were subjected to TEM to investigate the effects of IF on the morphology of mitochondria in adipose tissue. As expected, IF significantly increased the mitochondrial AR in HFD mice and promoted mitochondrial fusion, while the fusion of the other two models only slightly increased. Previous studies have performed IF on ob/ob mice and did not demonstrate significant weight gain or fat loss, while they showed higher glucose tolerance and postprandial insulin(Reference Kim, Lee and Yeung41), indicating that IF may not be an effective way to improve metabolism in ob/ob mice, which is also consistent with our research. In addition, IF significantly upregulated the mitochondrial fusion genes Opa1 and Mfn2 and downregulated the fission genes Fis1 and Drp1. At the protein level, the fusion protein OPA1 is significantly upregulated, while the fission proteins FIS1 and MFF are downregulated. These results suggest that IF significantly improves mitochondrial morphology in HFD mice.
Adipose tissue is a key regulator of energy metabolism, time-restricted feeding directly improves energy metabolism in mouse iWAT(Reference Hepler, Weidemann and Waldeck27), and alterations in energy metabolism are accompanied by changes in mitochondrial morphology and function(Reference Wu, Chou and Huang42,Reference Lee, Park and Oh43) . In obese mice, mitochondrial dysfunction and decreased ATP production as well as a reduction in the necessary metabolic cofactor NAD+ were found(Reference Uddin, Youngson and Doyle44). Therefore, maintaining mitochondrial function is vital to mammals. However, there are few discussions on the mitochondrial function of adipose tissue with IF. We further explored the alteration of mitochondrial function and iWAT energy metabolism in three models after IF. In HFD mice, IF significantly improved the membrane potential and increased ATP synthesis and mtDNA copy number. More importantly, IF upregulated the expression of mitochondrial function-related genes in HFD mice, including mitochondrial transcription factor A (TFAM), which regulates mtDNA replication and transcription, a marker of the mitochondrial oxidative phosphorylation complex, Ubiquinol-cytochrome c reductase core protein (Uqcrc), ATP synthase α-subunit (Atp5a1), cytochrome c oxidase subunit 4 isoform 1 (Cox4i1) and succinate dehydrogenase subunit B (Sdhb). IF improved mitochondrial function, and interestingly, this phenomenon was most obvious in HFD mice, which provides evidence for our further study on HFD mice. In addition, we measured serum concentrations of the major metabolites in mice. After IF, serum LDL, TC and TG levels were decreased, and HDL levels were increased. Moreover, we found that IF improved glucose tolerance in HFD mice by glucose tolerance test and insulin tolerance test, which is consistent with other studies to date(Reference Santos and Macedo45). It is noted that HDL concentrations differed depending on the time of fasting, inactive (light) or active (dark), and HDL levels appeared to be lower when fasting during active periods(Reference Hanjani, Zamaninour and Najibi46). Moreover, it has even been shown that inappropriate fasting times directly modulate the energy homeostasis of adipose tissue(Reference Hepler, Weidemann and Waldeck27). This suggests that the duration of fasting directly links to the degree of metabolic improvement and that the fasting program is critical to improving metabolism. However, HDL is higher during both inactive and active periods compared with ad libitum, and IF also improves HFD-induced obesity, which is also consistent with our findings. In conclusion, our study proves that IF enhances mitochondrial function and improves the metabolic health of HFD mice.
Sirtuins are NAD(+)-dependent protein deacetylases that function in response to stress(Reference Zhang, Wen and Luo19), which includes calorie restriction (IF) and other metabolic stresses. For example, IF activates SIRT1 expression in diabetic model mice (ob/ob) and alleviates diabetes-induced visual impairment and inflammatory responses in the bone marrow(Reference Hammer, Vieira and McFarland47), and Sirt3 mediates IF to reduce neuroinflammation(Reference Dai, Wei and Zhang48), SIRT3 regulates mitochondrial metabolism and fatty acid oxidation in brown adipose tissue and the liver through deacetylation of mitochondria-associated proteins(Reference Hirschey, Shimazu and Goetzman49). In our research, we found that IF is associated with an increase in protein deacetylation levels of HFD mice. Due to the effect of Sirt3 on regulating mitochondrial protein acetylation and the remarkable performance of IF in activating high expression of Sirt3, we speculate that Sirt3 regulates the acetylation of mitochondrial-related proteins during IF. The GO enrichment shows that the activity of NAD+ is increased, and IF significantly elevated SIRT3 protein expression without altering SIRT1 expression. Moreover, we found that the biological process of mitochondrial membrane composition varied significantly during IF. Therefore, we further explored the mechanism of SIRT3 action during IF.
Sirt3 is located in the mitochondrial matrix and is a member of the sirtuin family that relies on NAD+ for deacetylation(Reference Schwer, North and Frye50). Sirt3 is a deacetylase that regulates the acetylation of most lysines inside mitochondria and mitochondrial function(Reference Peng, Lu and Xie51–Reference Sun, Liu and Chen53). Overexpression of Sirt3 alleviated mitochondrial disorders by enhancing mitochondrial fusion triggered by OPA1(Reference Wang, Xu and Li54) and reduces mitochondrial damage, thereby maintaining mitochondrial morphology and protecting mitochondrial function(Reference Wu, Luo and Liu55). The increase in Sirt3 protein may increase mitochondrial fusion signals, improve mitochondrial morphology and reduce oxidative stress(Reference Zhao, Sun and Tan56). However, the effect of Sirt3 on mitochondrial fusion and mitochondrial function of adipocytes is still unclear. Thus, we constructed SIRT3 overexpression and interference vectors to confirm the mechanism by which Sirt3 improves adipocyte metabolism. As expected, Sirt3 overexpression significantly promoted mitochondrial fusion and improved mitochondrial function in adipocytes, whereas Sirt3 knockdown had the opposite inhibitory effect.
Meanwhile, according to our heatmap of the corresponding protein at the differentially modified sites, MDH2 is a key enzyme in the TCA cycle that provides a target for elucidating the deacetylation effect of Sirt3 on mitochondrial metabolism-related proteins. Rardin et al.(Reference Rardin, Newman and Held57) used a rigorous label-free quantitative MS method to analyse changes in lysine acetylation in mouse liver mitochondria without Sirt3, and sequencing indicated that Sirt3 regulates protein acetylation in a variety of metabolic pathways. In addition, Sirt3 could directly change the acetylation level of MDH2. MDH are a group of NAD-dependent dehydrogenases that catalyse the conversion of substrates between NAD and NADH(Reference Minárik, Tomásková and Kollárová58). This process is an important step in the mitochondrial TCA cycle. Recent research has identified that the acetylation level of Mdh2 is significantly increased during adipogenesis(Reference Kim, Han and Kim59). These studies indicate that the acetylation level of Mdh2 is affected by the energy state of cells. Here, we demonstrate that Sirt3 significantly inhibits the level of cellular acetylation. Through sequencing, we screened MDH2 as a target for deacetylation by SIRT3, and in combination with IP experiments, we demonstrated that Sirt3 directly deacetylates MDH2. Hence, SIRT3 is able to directly communicate and alter the acetylation level of MDH2(Reference Yang, Zhou and Shi60,Reference Guo, Jiang and Chen61) . Our research confirms this conclusion.
Previous studies have demonstrated that specific knockdown of Sirt3 upregulates the expression of the JNK pathway(Reference Liang, Benavides and Vassilopoulos62) and that Sirt3 upregulation reduces endoplasmic reticulum stress and blocks the proapoptotic JNK pathway(Reference Yang, Gong and Wang63). Here, our experiments with adipocytes treated with the JNK inhibitor SP or activator Ani highlight and confirm this direct link between Sirt3 and the JNK pathway. Sirt3 amplifies the inhibitory effect of SP and attenuates the activation effect of Ani. In addition, studies have demonstrated that the JNK-FIS1 pathway is associated with improved mitochondrial dysfunction(Reference Ravi and Subramaniam Rajesh64,Reference Naia, Carmo and Campesan65) . However, whether Sirt3 connects to MDH2 to communicate with the JNK-FIS1 pathway has not been investigated. Thus, we constructed a CAS9-Mdh2 vector to knock down Mdh2 and then overexpressed or interfered with Sirt3, and the results showed that the inhibition of p-JNK and FIS1 by SIRT3 was significantly reduced after MDH2 knockdown. Suggesting that Sirt3 inhibition of the JNK-FIS1 pathway is achieved through deacetylation of MDH2, our study provides a more in-depth theoretical study of Sirt3 regulation of mitochondrial fusion division kinetics.
In general, our research reveals a regulatory mechanism by which energy restriction controls mitochondrial energy homeostasis through animal adipocyte protein acetylation levels. In addition, this research provides theoretical support for the study of energy limitation and animal energy metabolism.
Limitations of study
There are still some limitations to our current study. Our results show that IF improves mitochondrial fusion and mitochondrial function in WT mice fed a normal diet and in ob/ob mice, although the effects are not as pronounced as in HFD mice. Further research may focus on different animal models. In addition, the inhibitory effect of Sirt3 on the JNK-FIS1 pathway was only weakened after MDH2 knockdown, but did not completely disappear, suggesting that the pathway through which Sirt3 regulates mitochondrial fusion dynamics is a much more complex process and still needs to be studied in more depth.
Acknowledgements
We would like to thank the following funds for our work. This work was supported by National Key Research and Development Program of China (2021YFF1000602), the Major National Scientific Research Projects (2015CB943102) and the Key Research and Development Projects in Shaanxi Province (2021NY-020).
Y. L.: Conceptualisation, methodology. J. L.: Validation, Formal analysis. X. T.: Writing-original draft. Q. C.: Writing – Review and Editing. L. Z.: Formal analysis and visualisation. H. W.: Data Curation, Investigation. Z. L.: Visualisation and investigation. X. D.: Investigation. C. B.: Investigation. C. S.: Conceptualisation, resources, project administration and funding acquisition.
We declare that we have no conflict of interest.
Supplementary material
For supplementary material/s referred to in this article, please visit https://doi.org/10.1017/S000711452300048X


