


Large yellow croaker Larimichthys crocea is popularly farmed in southern China. It has become the most large-scale mariculture fish species in China with a production of more than 148 616 metric tons in 2015( 1 ). Along with the increasing production, quality of the farmed large yellow croaker is also receiving increasing concerns, such as skin colour and muscle texture.
Hydroxyproline (Hyp) is a substrate for the synthesis of glycine, pyruvate and glucose, as well as scavenging oxidants and regulating redox state of cells( Reference Wu, Bazer and Burghardt 2 – Reference Takayama, Fujita and Suzuki 4 ). It is a conditionally essential amino acid in aquatic animals( Reference Li, Mai and Trushenski 5 ). Meanwhile, 4-hydroxyproline is essential for intramolecular hydrogen bonds, thus contributing to the thermal stability of the triple helical domain, the integrity of the monomer and collagen fibril( Reference Gelse, Poschl and Aigner 6 ). In connective tissue of fresh fish muscle, collagen plays a vital role in maintaining fillet integrity and muscle cohesiveness( Reference Aussanasuwannakul, Slider and Salem 7 ). Collagen content in muscle could be elevated when fish are fed dietary Hyp supplementation( Reference Zhang, Ai and Mai 8 , Reference Liu, He and Wang 9 ). Moreover, dietary Hyp could significantly enhance fish flesh quality in turbot Scophthalmus maximus L.( Reference Liu, He and Wang 9 ) and salmon Salmo salar L.( Reference Albrektsen, Sirnes and Aksnes 10 ). However, it is unclear regarding the underlying molecular mechanism and metabolism variation in vivo of fish flesh quality caused by Hyp supplementation in the diet.
Transcriptomics can enable high-throughput screening of thousands of expressed genes in a given tissue, which is highly efficient and in-depth to study the development of complex phenotypic traits affected by genes( Reference Damon, Denieul and Vincent 11 ). Larsson et al.( Reference Larsson, Morkore and Kolstad 12 , Reference Larsson, Koppang and Espe 13 ) used transcriptomics analysis to observe a variety of potential causes of fillet firmness, and revealed a strong positive correlation between firmness and the gene expression of Atlantic salmon (Salmo salar L.). Meanwhile, metabolomics is derived from the profiling study of metabolites, which are not merely end products of gene expression but also forming part of the regulatory system in an integrated manner( Reference Rochfort 14 ). Metabolomics is a powerful tool to detect the changes in metabolite content of fish treated under different conditions in quality assessment via the multivariate analysis of metabolic profiles by 1H-NMR spectra( Reference Picone, Balling Engelsen and Savorani 15 ). The combination of transcriptomics and metabolomics profiling technologies has been successfully used in analyses for drug development( Reference Sun, Ando and Ahlbory-Dieker 16 ), disease diagnosis( Reference Shi, Shen and Zhao 17 , Reference Zhou, Wang and Zhao 18 ) and nutrition health( Reference Sun, Yu and Zhou 19 , Reference Li, Xie and Lin 20 ). Multi-omics technology was used to assess diverse data sets at different biological levels to exploit the full potential of such information for a holistic improvement of production performance, disease resistance and welfare in animals( Reference Suravajhala, Kogelman and Kadarmideen 21 ). Also, the multi-omics method was used to explore the molecular mechanism and metabolism associated with phenotypic characteristics in fish muscle quality.
A previous study found that dietary Hyp significantly improved flesh quality of large yellow croaker( Reference Wei, Ma and Pan 22 ). On the basis of the total Hyp content in muscle, the optimal dietary Hyp content for large yellow croaker was estimated to be 0·61 %. To elucidate the underlying molecular mechanism of flesh quality improvement by dietary Hyp, in the present study the comprehensive analysis of gene expression with RNA sequence and metabolomics profile with 1H-NMR was used in muscle of large yellow croaker.
Methods
Feeding trial and sampling
The basal diet (B-D) was formulated to contain a combination of fish meal, maize gluten meal, soyabean meal and beer yeast as the intact protein sources. On the basis of the B-D, the Hyp supplementation diet (H-D) was made by adding 0·6 % Hyp to the diet. The formula and the proximate compositions of the two experimental diets are listed in Table 1.
Table 1 Formulation of the experimental diets (%DM)
Hyp, hydroxyproline; B-D, basal diet; H-D, Hyp supplementation diet.
* All of these ingredients were supplied by Qingdao Great Seven Biotechnology Co., Ltd. Fish meal, crude protein: 74·31 %, crude lipid: 8·98 %; soyabean meal, crude protein: 57·40 %, crude lipid: 1·70 %; wheat meal, crude protein: 17·39 %, crude lipid: 1·47 %.
† Mineral premix (mg/kg diet): Na2SeO3 (1 %), 20, Ca(IO3)2.6H2O (1 %), 60; CoCl2.6H2O (1 %), 50; CuSO4.5H2O, 10; FeSO4.H2O, 80; ZnSO4.H2O, 50; MnSO4.H2O, 45; MgSO4.7H2O, 1200; Ca(H2PO4)2.H2O, 10 000; microcrystalline cellulose, 8485.
‡ Vitamin premix (mg/kg diet): thiamine, 25 g; riboflavin, 45; pyridoxine HCl, 20; vitamin B12, 10; vitamin K3, 10; inositol, 800; pantothenic acid, 60; niacin acid, 200; folic acid, 20; biotin, Ca(IO3)2, 60; retinyl acetate, 32; cholecalciferol, 5; α-tocopherol, 240; ascorbic acid, 2000; wheat middlings, 16 473.
§ Glycine:betaine=1:2.
|| 50 % calcium propionic acid and 50 % fumaric acid.
¶ Lysine-H2SO4, dl-methionine, l-threonine, l-arginine, l-isoleucine, l-leucine, l-valine and l-phenylalanine.
Large yellow croaker juveniles were obtained from a commercial farm in Ningbo, China. Before the start of the feeding trial, juveniles were reared in floating sea cages (3·0×3·0×3·0 m) for 2 weeks to acclimatise to the experimental diets and conditions. After that, fish of similar sizes (initial body weight: 189·87 (sem 0·89) g) were randomly distributed into six sea cages (1·5×1·5×2·0 m) for two groups, and each cage was stocked with thirty-eight fish. Each group was assigned to triplicate cages, and fed one of the two experimental diets. The feeding trial lasted for 82 d in the sea of Xiangshan Harbour of Ningbo, Zhejiang Province, China. All the procedures were strictly carried out in accordance with the Regulations of the Experimental Animal Ethics Committee of Ocean University of China and in compliance with regulations by Institutional Animal Care and Use Committee.
Sample collection
At the end of the feeding trial, fish were fasted for 24 h and anaesthetised with tricaine methanesulphonate (MS-222, 1:10 000) (purity 99 %, Shanghai Reagent) before sampling. In total, six fish per cage were sampled; three of them were mixed and considered as one replicated. One side of the dorsal fillet, which is above the lateral line and anterior to the dorsal fin, was collected into sterile tubes and frozen in liquid N2, and then stored at −80°C. Samples in liquid N2 were ground into a powder with liquid N2. The powder was sampled into a sterile tube and freeze-dried and used for 1H-NMR analysis. The sample power was also used for transcriptomic assay and gene expression validation.
Transcriptomic assay
Total RNA from muscle samples was isolated by Trizol® Reagent. The quality and integrity of RNA were examined by agarose gel electrophoresis and 2100 Bioanalyzer. The qualified RNA was treated with DNase (5 U/μl) (Takara) at 37°C for 30 min. The DNase-treated RNA was purified by Dynabeads® Oligo (dT) 25 (Life Technologies): RNA solution is diluted to 100 μl and mixed with 100 μl of binding buffer. The mixture was incubated at 65°C for 2 min, and then cooling on the ice rapidly. After cooling, 100 μl of pre-washed beads were added and mixed at room temperature for 5 min, and then placed on the Magnetic Grate (Life Technologies) for separation for 1–2 min. The supernatant was washed twice with 200 μl of Washing Buffer B followed by the addition of 15 μl of cooled 10 mm Tris-HCl resuspended beads, and incubated at 75–80°C for 2 min, and then placed on the Magnetic Grate for 1–2 min, immediately. The supernatants were collected to obtain the purified mRNA. The library was prepared by NEBNext® UltraTM RNA Library Prep Kit for Illumina (NEB, American) according to the manufacturer’s instructions. Random Primers and First Strand Synthesis Reaction Buffer (5×) were added to 100 ng of purified mRNA. The mix was incubated at 94°C for 15 min and then immediately placed in ice to break in the mRNA. Murine RNase Inhibitor and ProtoScript II RT were added for the first-strand synthesis, and the reaction procedure was listed as 25°C for 10 min, 42°C for 50 min and 70°C for 15 min. Second-Strand Synthesis Reaction Buffer (10×) and Second-Strand Synthesis Enzyme Mix were added and incubated at 16°C for 1 h to synthesise the second strand. After adding 1·8 times volume AMPure XP Beads (Agencourt) to purify the reagent obtained from the last step, the End Repair Reaction Buffer (10×) and End Prep Enzyme Mix were added and incubated at 20°C for 30 min, and then 65°C for 30 min for end repairing. NEBNext Adaptor and Blunt/TA Ligase Master Mix were added and incubated at 20°C for 15 min for adaptor linkage, followed by the addition of USER Enzyme at 37°C for 15 min to excise U in adaptor. After adding and mixing 0·6 times volume of AMPure XP Beads, the mixture was placed on the Magnetic Grate for 5 min after allowing it to stand for 5 min. The supernatant was collected, and then 0·25 times volume of AMPure XP Beads was added for purification. The 300–500-bp-length ligated cDNA was made. Universal PCR Primer and Index (X) Primer were used for PCR amplification. After preheating at 98°C for 10 s, 12–15 cycles of amplification were performed using a cycle profile as denaturation at 98°C for 10 s, annealing at 65°C for 30 s and extension at 72°C for 30 s. The reagent was purified by one times volume AMPure XP Beads and the library for sequencing was obtained. The 2 % agarose gel electrophoresis, Qubit quantification and High-sensitivity DNA chip were used to obtain qualified cDNA library. The sequencing of cDNA in the library was performed on Illumina HiseqTM 2500 after using TruSeq PE Cluster Kit (Illumina) performing cluster generation on cBot.
Gene expression validation
Genes obtained from the transcriptomic assay were validated and quantified by quantitative real-time PCR (qRT-PCR). The primers used for qRT-PCR are listed in Table 2. Total RNA used in RT-PCR analysis was isolated with Trizol reagent (Invitrogen) from the same samples as that in transcriptomic assay. The qRT-PCR was performed using SYBR Green as the fluorescent dye according to the manufacturer’s protocol (Takara). Each sample was run in triplicate. The mRNA expression levels were normalised by the reference gens and calculated using the comparative cycle threshold (C
t
) values expressed as
 $$2^{{{\minus}\Delta \Delta C_{t} }} $$
. GraphPad Prism 7.0 was used for the interpretation and analysis of data.
$$2^{{{\minus}\Delta \Delta C_{t} }} $$
. GraphPad Prism 7.0 was used for the interpretation and analysis of data.
Table 2 Primers for relative quantitative real-time PCR
1H-NMR analysis
Sample preparation for 1H-NMR analysis
In brief, lyophilised muscle powder (50 mg) was weighed into a centrifuge tube and suspended in 1 ml of purified water. The tube was then sonicated (VCX-130; Sonics & Materials, Inc.) on ice. The ultrasonic extraction was repeated eight times for 4 and 3-s intervals with the cycling programme. Samples were centrifuged (Eppendorf Centrifuge 5415R) at 13 000 rpm for 15 min at 4°C. The aqueous layer was collected and filtered by amicon Ultra 0·5-ml centrifugal filters with 3-kDa cut-off (Millipore). The filtrate was centrifuged at 13 000 rpm for 30 min at 4°C. The top 450-μl aqueous layer was collected and transferred to a clean 2-ml centrifuge tube. A 50-μl 2,2-dimethyl-2-silapentane-5-sulphonate standard solution (Anachro) was added in the tube. Samples were vortex-shocked well for 10 s and centrifuged at 13 000 rpm for 2 min at 4°C. The 480 µl of supernatant was transferred to 1H-NMR tube for analysis.
1H-NMR spectroscopy
Spectra were collected using a Bruker AV III 600 MHz spectrometer equipped with an inverse cryoprobe operating at a proton NMR frequency of 600·13 MHz. The first increment of a 2D-1H, 1H-NOESY pulse sequence was used for the acquisition of 1H-NMR data and for suppressing the solvent signal. Spectra were collected at 25°C, with a total of 180 scans over a period of about 20 min.
Quantification of the metabolites
The collected free induction decay signal was automatically zero-filled and fourier-transformed in processing module in Chenomx NMR Suite 7.7 (Chenomx Inc.). The data were then carefully phased and corrected to baseline in the Chenomx Processor. All the spectra were referenced for the quantification to the internal standard. The quantification was performed by comparing the integral of a known reference signal (DSS-d6) with the signals derived from a library of compounds containing chemical shifts. The identifiable metabolites were chosen for quantification by matching to the Chenomx Library. All concentrations of metabolites were collected and normalised by weight across all parallel samples before being used in the later multivariable analysis.
Data analysis
The chemometric analysis for metabolites was performed in the R software environment using the PLS package( Reference Mevik and Wehrens 23 ). Plots were made using the ggplot2 package( Reference Wickham 24 ). The variable importance in the projection (VIP) values and corresponding loadings for partial least squares (PLS) models were applied to identify the variable. If VIP is greater than 1, this variable was considered a very important variable for the model and selected as candidate biomarker variables( Reference Zhang, Li and Tang 25 ). It was also considered to be significant.
For gene expression determination, reads per kilobase of gene per million mapped reads (RPKM) was performed as a standard calculation, which quantifies gene expression from RNA sequencing data by normalising for total read length and the number of sequencing reads( Reference Mortazavi, Williams and McCue 26 ). The gene expression abundance between the two samples was calculated using the MA-plot-based method with the random sampling model in the DEGseq package( Reference Wang, Feng and Wang 27 ). The false discovery rate (FDR) was used to determine the P value threshold. We have used stringent criteria to identify differentially expressed genes (DEG) at FDR<0·001, ∣log2 fold change∣>1, q value (P value was adjusted using Benjamini)<0·001 and RPKM>20 for at least one sample. A search for enriched gene ontology (GO) classes and KEGG pathways of DEG was performed. An enrichment score threshold of q value<0·05 was selected for statistical significance.
Results
Gene expression profiling by RNA sequence
According to the screening criteria (q<0·001, RPKM>20, log2 (fold change)>1), a total of 334 genes were identified as DEG, of which 112 genes were not annotated in the B-D group and H-D group. Meanwhile, 298 genes and thirty-six of these DEG were significantly up-regulated and down-regulated, respectively, in the H-D group. The results of gene expression validation from qRT-PCR are shown in Fig. 1. The expression levels of ten genes selected were up-regulated in the B-D diet compared with the H-D diet, which showed a high consistent trend from the results of transcriptomic assay.
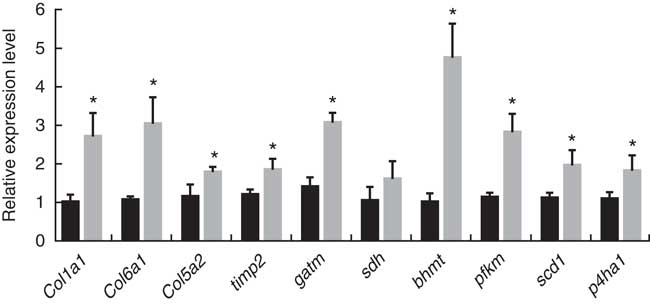
Fig. 1 Quantitative real-time PCR of selected genes from the transcriptomic profile. The gene expression level is the relative average 2−ΔΔCt
as normalised to the housekeeping gene β-actin. Values are means with standard errors represented by vertical bars, and statistical analysis was done by unpaired t test (*P<0·05). (![]() ) B-D, basal diet; (
) B-D, basal diet; (![]() ) H-D, Hyp supplementation diet.
) H-D, Hyp supplementation diet.
The GO and KEGG classified analysis of DEG is shown in Table 3. These genes participate in the pathway of antigen processing and presentation, PPAR signalling pathway, protein digestion and absorption. Meanwhile, enrichment of DEG was observed in extracellular matrix–receptor interaction, extracellular region part, extracellular region, macromolecular complex, organelle part and structural molecule activity. Genes in the group that was supplemented with Hyp showed sizeable and mainly increased expression. Examples are given in Table 4. A log2 (fold change) value greater than 1 indicated an up-regulation in the H-D group compared with the B-D group, and the ones less than −1 indicated a down-regulation in the H-D group compared with the B-D group. In comparison with the B-D group, gene expression of betaine-homocysteine S-methyltransferase (bhmt) involved in glycine, serine and threonine metabolism, cysteine and methionine metabolism in the H-D group was up-regulated. Other up-regulation of genes involved in amino acid metabolism including glycine amidinotransferase (gatm), glycyl-tRNA synthetase (gars) and aminoacylase 1 (acy1) were observed in the H-D group. Expression levels of aconitate hydratase (aco), ATP-dependent 6-phosphofructokinase, muscle type-like (pfkm), fructose-bisphosphate aldolase A (aldoa), glyceraldehyde-3-phosphate dehydrogenase (gapdh) and succinate dehydrogenase (sdh) involved in glucose degradation of carbohydrate catabolism were increased in the H-D group. Several other genes, which were involved in collagen gene expression, biosynthesis and degradation, were up-regulated in the H-D group. These genes included collagen α-1(I) chain-like (col1a1), collagen α-2(V) chain-like (col5a2), collagen, type VI, α (col6a), protein disulphide-isomerase A1 (pidia1), prolyl 4-hydroxylase subunit α-1 isoform X2 (p4ha1), lysyl oxidase (lox) and tissue inhibitor of metalloproteinase 2 (timp2). The gene expression of col1a1 showed the greatest up-regulation (log2 (fold change)=5·18). Up-regulated genes involved in lipid metabolism included binding protein (fabp3), fatty acid-binding protein 2a (fabp2), stearoyl-CoA desaturase (Δ-9 desaturase) (scd1), lipoprotein lipase (lpl), diacylglycerol O-acyltransferase 2 (dgat) and long-chain fatty acid transport protein 1-like (fatp1). These genes also participated in the PPAR signalling pathway. The genes involved in energy metabolism and immune system were observed. Muscle fibre-related genes including in myosin heavy chain (mhy), myosin light polypeptide 6 (myl6) and calpain-3 (capn3) were up-regulated.
Table 3 Enrichment terms of gene ontology (GO) and the KEGG pathway of differentially expressed genes in muscle of large yellow croaker fed dietary hydroxyproline supplementation
Table 4 Differentially expressed genes in muscle of larger yellow croaker fed dietary hydroxyproline supplementation

B-D, basal diet; H-D, Hyp supplementation diet.
Metabolite profiling by 1H-NMR spectroscopy
A typical 1H-NMR spectrum in the present study is shown in Fig. 2. A total of sixty-two metabolites were identified in the spectra for the muscle samples of large yellow croaker. Amino acids and their derivatives, organic acids, sugars and nucleic acid components were detected. A partial least squares discriminant analysis (PLS-DA) classification model was constructed to evaluate the metabolic differences of muscle tissues between the two groups (Fig. 3). The score plot (Fig. 3(a)) shows that the B-D group and the H-D group are clearly distinct from each other. The corresponding loading plot (Fig. 3(b)) helps the visual selection of biomarkers. It indicates that the further the metabolites get away from the core, the more the contributions can be distinguished from the two groups. The metabolites with VIP above 1 (Table 5) are significant variables that contribute to distinguishing the two groups. The concentration of metabolites in the B-D diet including trans-4-hydroxy-l-proline, glucose-6-phosphate, trimethylamine N-oxide (TMAO), taurine and inosinic acid (inosine monophosphate (IMP)) were up-regulated compared with those in the group of H-D, whereas the metabolites including betaine, lactate, creatine, histamine and serine were down-regulated. These biomarker metabolites were mainly related to the pathways of collagen metabolism, amino acid metabolism, glucose metabolism and fish muscle flavour.
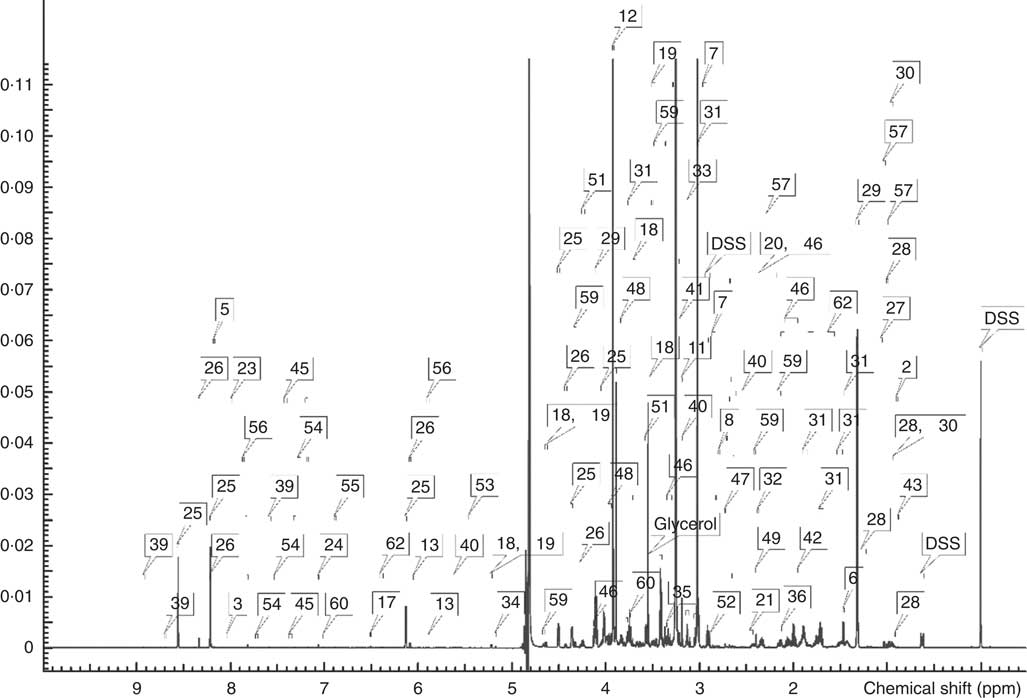
Fig. 2 A typical 1H-NMR spectrum obtained from muscle samples of large yellow croaker fed diet with hydroxyproline supplementation. 1, 2-aminobutyrate; 2, 2-hydroxybutyrate; 3, 3-methylxanthine; 4, acetate; 5, adenine; 6, alanine; 7, asparagine; 8, aspartate; 9, betaine; 10, carnitine; 11, choline; 12, creatine; 13, cytidine; 14, dimethylamine; 15, ethanol; 16, formate; 17, fumarate; 18, glucose; 19, glucose-6-phosphate; 20, glutamate; 21, glutamine; 22, glycine; 23, guanosine; 24, histamine; 25, inosine monophosphate; 26, inosine; 27, isobutyrate; 28, isoleucine; 29, lactate; 30, leucine; 31, lysine; 32, malate; 33, malonate; 34, mannose; 35, methanol; 36, methionine; 37, N,N-dimethylglycine; 38, N-methylhydantoin; 39, niacinamide; 40, O-acetylcarnitine; 41, O-phosphocholine; 42, ornithine; 43, pantothenate; 44, trimethylamine N-oxide; 45, phenylalanine; 46, proline; 47, sarcosine; 48, serine; 49, succinate; 50, taurine; 51, threonine; 52, trimethylamine; 53, glucose-1-phosphate; 54, tryptophan; 55, tyrosine; 56, uridine; 57, valine; 58, sn-glycero-3-phosphocholine; 59, trans-4-hydroxy-l-proline; 60, π-methylhistidine; 61, 3-aminoisobutyrate; 62, citrulline; ppm, Parts per million.
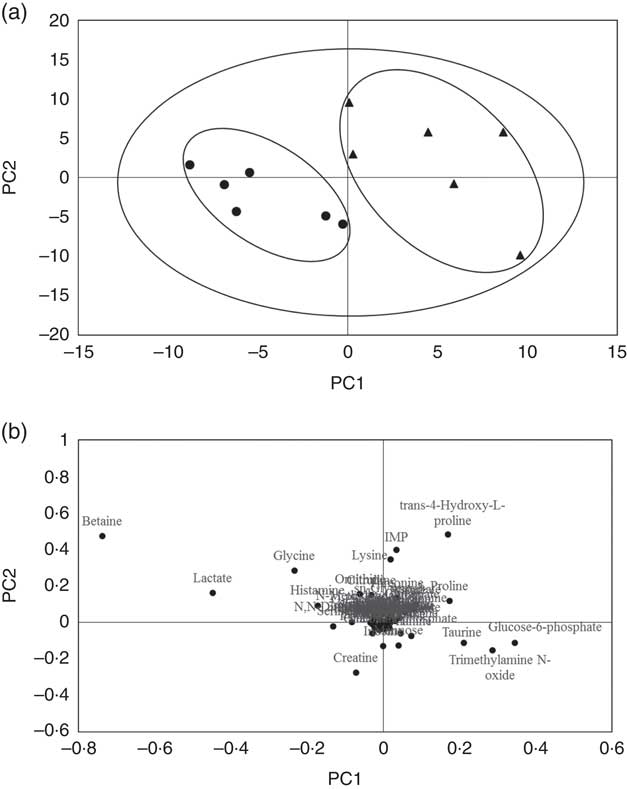
Fig. 3 The partial least squares discriminant analysis (PLS-DA) model in muscle of large yellow croaker fed dietary hydroxyproline supplementation. The components score plot in muscle of large yellow croaker fed a diet with no Hyp supplementation compared with those fed a diet with Hyp supplementation, the ellipses indicate clusters of the treatment groups in the experiment (a). Loading plot that explained the further the metabolites get away from the core, the more the contributions distinguishing two groups (b). (![]() ) B-D, basal diet; (
) B-D, basal diet; (![]() ) H-D, Hyp supplementation diet.
) H-D, Hyp supplementation diet.
Table 5 Variable importance in projection (VIP) scores of muscle metabolites of large yellow croaker fed dietary hydroxyproline supplementationFootnote *
B-D, basal diet; H-D, Hyp supplementation diet; IMP, inosine monophosphate.
* It shows the VIP>1 metabolites, which contributed to a distinction between control group and Hyp supplementation group.
Discussion
In the previous study, Hyp supplementation of 0·6 % in diet increased the muscle texture parameters (hardness, adhesiveness, springiness and chewiness), pH and lipid-holding capacity compared with the control group, which indicated an improvement of flesh quality( Reference Wei, Ma and Pan 22 ). The present study explores the possible underlying mechanism.
Higher collagen content is closely related to firmer fillet and higher muscle pH in sea bass, Dicentrarchus labrax L.( Reference Periago, Ayala and López-Albors 28 ). A previous study on large yellow croaker also found that dietary supplementation of Hyp significantly increased collagen content in muscle( Reference Wei, Ma and Pan 22 ). In the present study, the expression of three collagen genes (col1a1, col5a2 and col6a) observed from the transcriptomics was up-regulated in the H-D group. Five types of collagen (types I, III, IV, V and VI) were found in the muscle of Gadus morhua ( Reference Brüggemann and Lawson 29 ). Type I collagen is the most abundant and studied collagen, whereas the content of type V collagen is relatively less, but more reported in fish connective tissue related with flesh quality( Reference Sato, Ando and Kubota 30 ). A coordinated significant variation of expression was observed in genes involved in the metabolism of collagen. Four collagen biosynthesis-related genes including pidia1, pcolce2, p4ha1 and lox observed from the transcriptomics was up-regulated in the Hyp supplementation group. The p4ha1 plays a central role in collagen synthesis. It catalyses the formation of 4-Hyp in collagens and other proteins with collagen-like sequences by the hydroxylation of proline residues in peptide linkages( Reference Kivirikko, Helaakoski and Tasanen 31 ). The lox is essential to promote cross-linking and plays a critical role in the biogenesis of connective tissue matrices, which catalyse the oxidative deamination of the ε-amino group of lysines and hydroxylysines in collagen and elastin( Reference Smith-Mungo and Kagan 32 ). Additionally, the gene of tissue inhibitor of metalloproteinase has the ability to inhibit matrix metalloproteinases (MMP)( Reference Murphy 33 ). In the present study, the gene expression of the timp2 observed from the transcriptomics was significantly up-regulated by the supplementation of Hyp in diet. It is hypothesised that the MMP play important roles in the degradation of collagens, thus causing the postmortem softening of fish muscle. For example, MMP-2 is a major proteinase responsible for the degradation of type I and V collagens in common carp (C. carpio), thus resulting in the softening of fish muscle during chilled storage( Reference Xu, Wang and Cai 34 ). The results of the present study suggest that dietary Hyp regulated collagen turnover in muscle partly through increasing the ability of collagen biosynthesis and suppressing the degradation of collagen in the muscle of large yellow croaker, which is in agreement with the previous study( Reference Wei, Ma and Pan 22 ). A similar study was observed in rat, where an oral intake of l-hydroxyproline had a stimulatory effect on collagen metabolism and turnover( Reference Aoki, Suto and Komatsu 35 ).
Apart from collagen metabolism, dietary Hyp could play a role in taurine-related amino acid metabolism. The intake of certain nutrients can affect gene expression of bhmt in salmonid, such as methionine( Reference Kwasek, Terova and Lee 36 ). In the present study, the expression of bhmt observed from the transcriptomics showed up-regulation by dietary Hyp supplementation. The bhmt is a cytosolic enzyme that catalyses the conversion of betaine and homocysteine to dimethylglycine and methionine, respectively( Reference Garrow 37 ). Methionine is a precursor for taurine biosynthesis; its degradation leads to the synthesis of taurine( Reference Fukada, Shimada and Morita 38 ). This mechanism is consolidated by the increased concentration of taurine observed from the metabolomics. It suggests that Hyp supplementation in fish diet could affect taurine metabolism leading to the increased concentration of taurine. Taurine plays an important role in multiple physiological processes such as the regulation of antioxidation( Reference Jong, Azuma and Schaffer 39 ) and acting as a pH buffer for regulation of mitochondrial metabolism( Reference Hansen, Birkedal and Wibrand 40 ). It was also reported in mammals that taurine was involved in the control of glucose homoeostasis by regulating the expression of genes that are required for glucose-stimulated insulin secretion and that it enhances peripheral insulin sensitivity( Reference Carneiro, Latorraca and Araujo 41 ). The present study showed that an increased concentration of glucose-6-phosphate observed from the metabolomics coincided with an up-regulated gene expression of glycolysis-related genes including pfkm, aldoa and gapdh observed from the transcriptomics in the Hyp-supplemented group, which indicated a better utilisation of carbohydrates. It is well known that teleost fish show persistent hyperglycaemia and are generally considered to be glucose intolerant( Reference Moon 42 ). The results suggest a tendency towards better utilisation of glucose when fish are fed dietary Hyp, and provide evidence that the regulation of glucose by Hyp supplementation could be partly due to the increased taurine content. The enhancement of glycolysis involved in the aerobic metabolism correlates with a firm fillet. A previous study observed that fish fed dietary Hyp supplementation had a firmer fillet( Reference Wei, Ma and Pan 22 ). The present study showed that several gene expression increased observed from the trancriptomics, such as sdh (a citric acid cycle enzyme) and aco. These genes are vital regulators of energy metabolism regarding mitochondrial functions. This agrees with the study of Atlantic salmon that showed a higher mitochondrial metabolism with firmer fillets( Reference Larsson, Morkore and Kolstad 12 , Reference Larsson, Koppang and Espe 13 ). In the present study, the increased carbohydrate metabolism together with mitochondrial processes indicated an enhanced cellular aerobic respiration in the Hyp supplementation group, which could be attributed to a good energy utilisation with a firmer fillet.
The PPAR signal pathway, which is related with the lipid metabolism, was significantly enriched as observed from the transcriptomics in the present study. In this pathway, lpl was up-regulated. The lpl is a key enzyme in lipid metabolism that hydrolyses TAG to provide free fatty acids for cells and affects the maturation of circulating lipoproteins( Reference Wion, Kirchgessner and Lusis 43 ). It is also known as an activator (and/or ligands) of the various PPAR( Reference Schoonjans, Peinado-Onsurbe and Lefebvre 44 ). The fabp3 is known to function as a transport protein for mitochondrial β-oxidation in muscle tissues( Reference Haunerland and Spener 45 ). It increased in the H-D group in the present study. The fatp1 and acyl-CoA acsl1 were also improved in the H-D group and, respectively, facilitated the transport of fatty acids across the cell membrane. Meanwhile, their esterification prevented their efflux and facilitated fatty acid uptake( Reference Martin, Schoonjans and Lefebvre 46 ). In addition, scd1, which plays an important role in lipogenesis, was also up-regulated. It is the rate-limiting enzyme that catalysed the conversion of saturated long-chain fatty acids into MUFA( Reference Dobrzyn and Ntambi 47 ). The results indicated that fish fed dietary Hyp supplementation enhanced the lipid metabolism. The up-regulated gene of lipid metabolism owing to Hyp supplementation indicates that the consumption of fat as fuel provided cellular energy, which was verified by the expression of genes involved in energy metabolism. Positive correlations with firmness were shown for genes involved in different aspects of lipid metabolism( Reference Larsson, Morkore and Kolstad 12 ). This was further confirmed with the firmer muscle texture in Hyp supplementation group in the previous study( Reference Wei, Ma and Pan 22 ).
IMP is a breakdown/degradation product of ATP. It is an important taste enhancer and used as an index of freshness quality in a wide variety of fish( Reference Hong, Lee and Kim 48 , Reference Hong, Regenstein and Luo 49 ). Several researches have also reported that the decrease or disappearance of IMP is correlated with the loss of fresh fish flavour in most species( Reference Alasalvar, Taylor and Öksüz 50 , Reference Lakshmanan, Antony and Gopakumar 51 ). The high level of IMP in the H-D group observed from the metabolomics in the present study indicated a good flesh freshness in muscle of large yellow croaker. The level of trimethylamine (TMA) is strongly correlated to the sensory quality of cod( Reference Gill 52 ), and can be also used as an objective index to predict the fish quality in freshness( Reference Heising, Van Boekel and Dekker 53 ). Its concentration increases with the decrease of the fish freshness( Reference Zhao, Pan and Ma 54 ). The TMA is secreted by the decomposition of TMAO, and its concentration increased after the fish died( Reference Hamada-Sato, Usui and Kobayashi 55 ). An inhibition of conversion from TMAO to TMA will have a better fish freshness. In the present study, although no change was found for TMA, the concentration of TMAO observed from the metabolomics increased. It suggests a tendency towards a good flesh freshness when fish is fed a diet with supplementation of Hyp.
In conclusion, combining analysis of transcriptomics and metabolomics revealed that the increased collagen content in muscle of large yellow croaker fed a diet with supplementation of Hyp was partly due to the enhancement of synthesis and the diminished degradation of collagen. The up-regulation of glycolysis coinciding with the mitochondrial processes suggests better utilisation of carbohydrates and an enhanced cellular aerobic respiration in the Hyp supplementation group. This could lead to a good energy utilisation with a firm fillet of large yellow croaker. The enhancement PPAR signalling pathway was significantly enriched by Hyp supplementation and it had stimulatory effects on improving flesh quality of large yellow croaker. Meanwhile, dietary Hyp could improve fish freshness by inhibiting conversion from TMAO to TMA.
Acknowledgements
The authors thank the participants who contributed to this trial.
This work was financially supported by the National Natural Science Foundation of China (grant no. 31372542), and the Fundamental Research Funds for the Central Universities of Ocean University of China (grant no. 201562017).
Z. W. completed the experiment and prepared the manuscript. H. Z. and Y. Z. analysed the samples. W. Z. designed the experiment and revised the manuscript. K. M. designed the experiment.
The authors declare that there are no conflicts of interest.


