


Obesity, which is a major public health problem worldwide( Reference Kelly, Yang and Chen 1 ), is an important factor for the development and progression of several lifestyle-associated diseases such as hypertension( Reference Gelber, Gaziano and Manson 2 ), type 2 diabetes( Reference Chan, Rimm and Colditz 3 , Reference Colditz, Willett and Rotnitzky 4 ) and CVD( Reference Hubert, Feinleib and McNamara 5 ). In addition, it has been shown that obesity is associated with the prevalence and progression of chronic kidney disease (CKD)( Reference Kramer, Luke and Bidani 6 – Reference Iseki, Ikemiya and Kinjo 8 ).
Dietary treatments are effective for weight loss( Reference Knowler, Barrett-Connor and Fowler 9 ); however, there is currently no consensus on the optimal dietary therapy for weight loss and the prevention of further events. Recently, low-carbohydrate diet (LCD) has been recognised as a weight-loss strategy. Several studies have investigated the effectiveness of LCD for weight loss( Reference Hession, Rolland and Kulkarni 10 – Reference Samaha, Iqbal and Seshadri 12 ). Furthermore, a high-protein diet corresponding with LCD promotes weight loss, maintains lean body mass and improves lipid and glycaemic metabolism in obese individuals( Reference Layman, Evans and Baum 13 , Reference Due, Toubro and Skov 14 ).
Meanwhile, there is concern about the safety of LCD and corresponding high protein intake on renal function. Previous studies have revealed that high-protein diets are associated with the development and progression of CKD in obese individuals( Reference Friedman 15 ). In addition, it has been reported that individuals who reduced protein intake inhibit renal death, compared with those with higher or unrestricted protein intakes( Reference Mandayam and Mitch 16 ). Furthermore, it has been reported that dietary protein restriction slows the progression of renal dysfunction among individuals with CKD( 17 ), and that a protein limit of 0·8 g/kg for patients with renal dysfunction has been recommended in the KDOQI guidelines( 18 ). Thus, there is a possibility that LCD has adverse effects on renal function; however, it remains to be elucidated the impact of LCD on renal function in obese individuals. Therefore, we aimed to investigate the effect of LCD on renal function, defined as estimated glomerular filtration rate (eGFR) or creatinine clearance (CCR), among overweight and obese individuals without CKD in this meta-analysis.
Methods
Data sources and searches
Literature search was performed using EMBASE, MEDLINE and Cochrane Library. We selected articles that reported human studies from their inception until December 2015 in English using the following searching terms: ‘Low carbohydrate diet’ AND (‘Clinical trial’ OR ‘Clinical study’ OR ‘Clinical investigation’ OR ‘Observational study’ OR ‘Cohort study’).
Study selection
Inclusion criteria were as follows: (1) the articles should be original, (2) the abstracts of articles should include the term or abbreviations of ‘low carbohydrate diet’, (3) the study should include overweight, 25≤BMI<29·9 kg/m2 (23≤BMI<24·9 kg/m2 if Asian), and obese, BMI≥30 kg/m2 (BMI≥25 kg/m2 if Asian) individuals( 19 ) and (4) duration ≥6 months. Exclusion criteria included (1) duplicated article in three websites, (2) no original raw data for creatinine, eGFR or CCR, (3) no data on standard deviation for assessed data or (4) no data on the control group. For this meta-analysis, trials were required to use a randomised-controlled design comparing the effects of LCD diet, defined as allowing a maximum intake of 45 % of energy from carbohydrates, with control diet( Reference Hu, Mills and Yao 20 ).
Data extraction
We extracted the following data from all assessed articles: authors, study title, country, year of publication, study design, study length, sex distribution, age, sample size, dropout rate, intervention for diets and outcomes.
In this meta-analysis, we considered CCR as eGFR( Reference Pan, Guo and Jin 21 ). In the study by Krebs et al.( Reference Krebs, Elley and Parry-Strong 22 ) and Stern et al.( Reference Stern, Iqbal and Seshadri 23 ), not eGFR but serum creatinine at the end point was described. Thus, we calculated eGFR from the following equation: eGFR=175×age−0·203×serum creatinine−1·154 (×0·742 if female)( Reference Levey, Coresh and Greene 24 ). The mean change in eGFR during the courses of the studies was set as the primary outcome of interest in this meta-analysis.
In some studies, we found only the average and standard deviations of eGFR at baseline and at the end point. In these cases, we estimated the mean change in eGFR as follows: eGFR at the end point − eGFR at baseline. In the same way, we calculated sd of change in eGFR as follows: sd of change in eGFR=the square root of (the square (sd of eGFR at the end point)+the square (eGFR at baseline)).
Validity and quality assessment
For the analysis, two reviewers independently checked and selected all references, respectively. We assessed quality of evidence for each study by using the Grading of Evidence, Assessment, Development and Evaluation approach( Reference Oxman, Schünemann and Fretheim 25 ). We validated and performed quality assessment of our systematic review using the Assessment of Multiple Systematic Reviews tool( Reference Schünemann, Fretheim and Oxman 26 ).
Quantitative data synthesis
We performed quantitative data synthesis based on Preferred Reporting Items for Systematic Reviews and Meta-Analyses (PRISMA) statement( Reference Moher, Liberati and Tetzlaff 27 ). We analysed the impact of LCD on renal function compared with that of the control diet among overweight and obese participants without CKD, defined as eGFR<60 ml/min per 1·73 m2 at baseline( Reference Tanaka, Fukui and Okada 28 ). As the study by Tirosh et al.( Reference Tirosh, Golan and Harman-Boehm 29 ) included ninety-nine participants with CKD, we excluded them from the analysis.
We performed a meta-analysis to provide quantitative summary estimates of mean change in eGFR of LCD compared with the control diet. Summary averages were calculated using fixed-effects model according to Mantel & Haenszel( Reference Mantel and Haenszel 30 ). Statistical significance was defined at P values <0·05. The I 2 statistic was calculated to assess statistical heterogeneity across studies: 0 % suggests no heterogeneity, 0–25 % very low heterogeneity, 25–50 % low heterogeneity, 50–75 % moderate heterogeneity and a value of 75 % high heterogeneity( Reference Higgins and Thompson 31 ).
A funnel plot was produced for intervention effects to compare each study. Asymmetry may indicate reporting bias, heterogeneity or may occur by chance. All analyses were conducted using R version 3.0.1 (R project for Statistical Computing).
Result
We collected 205 articles from EMBASE, MEDLINE and Cochrane Library. Among them, 194 articles did not report original data. Renal function was assessed in eleven articles( Reference Levey, Coresh and Greene 24 , Reference Tirosh, Golan and Harman-Boehm 29 , Reference Brinkworth, Noakes and Keogh 32 – Reference Goldstein, Kark and Berry 39 ); however, one of them was excluded because the control group was not assessed( Reference Wal, McBurney and Moellering 38 ), and another was excluded because it did not report data on mean values and standard deviations( Reference Goldstein, Kark and Berry 39 ). Finally, we evaluated nine randomised controlled trials (Fig. 1).
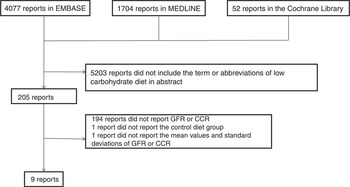
Fig. 1 Flow diagram of study selection. GFR, glomerular filtration rate; CCR, creatinine clearance.
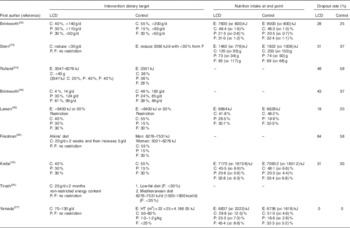
Characteristics of the nine randomised controlled trials are presented in Table 1. These studies included 1687 participants, 861 were in the LCD group and 826 in the control group; 46·2 % of them (779 of 1687) were male. The study duration ranged from 6 to 24 months. Among nine studies, four were conducted on patients with diabetes.
Table 1 Study characteristics (Mean values and standard deviations)

LCD, low-carbohydrate diet; IRI, immunoreactive insulin; CCR, creatinine clearance; eGFR, estimated glomerular filtration rate; CKD, chronic kidney disease.
Proportion of carbohydrate intake in the LCD group in these studies was significantly lower than that of the control group. On the other hand, the definition of LCD was not identical among selected studies, with carbohydrate consumption ranging from 4 to 45 % of total energy intake. Total energy and dietary macronutrient composition were not maintained during the follow-up period (Table 2). Even in the LCD group, we found an increasing trend in carbohydrate intakes during the follow-up periods. In addition, the dropout rate was high in most studies( Reference Krebs, Elley and Parry-Strong 22 , Reference Samaha, Iqbal and Seshadri 12 , Reference Brinkworth, Noakes and Keogh 32 – Reference Friedman, Ogden and Foster 36 ).
Table 2 Dietary target and nutrition intake (Mean values and standard deviations)
LCD, low-carbohydrate diet; C, carbohydrate; P, protein; F, fat; E, energy; HT, height.
We did not find asymmetry in the funnel plot (Fig. 2); thus, the risk of publication bias in this meta-analysis was thought to be low. On the basis of the quality assessment, the quality of each study was at medium level, although all studies were not of high level.

Fig. 2 Funnel plot of nine randomised controlled trials in overweight and obese individuals without chronic kidney disease.
To compare the effect of LCD on renal function, the participants who dropped out were excluded from the analysis. Therefore, the meta-analysis encompassed a total of 972 participants, with 452 in the LCD group and 520 in the control group. All studies were combined with the fixed-effects model, and the mean change in eGFR in the LCD group was evaluated in comparison with that in the control group. The mean change in eGFR in the LCD group was−4·7 to 24·0 ml/min per 1·73 m2 and that in the control group was −4·1 to 10·8 ml/min per 1·73 m2. The mean change in eGFR in the LCD group was greater than that in the control group (0·13 ml/min per 1·73 m2; 95 % CI 0·00, 0·26) (Fig. 3).

Fig. 3 Forest plot for change in estimated glomerular filtration rate associated with low-carbohydrate diet (LCD) among individuals without chronic kidney disease. The size of the boxes corresponds to each study’s weight. MD, mean difference, W, weight.
Discussion
In this present meta-analysis of randomised controlled trials comparing LCD with control diets, we identified that the increase in eGFR in LCD was greater than that in the control group among overweight and obese individuals without CKD.
Obesity is associated with the prevalence and progression of CKD( Reference Kramer, Luke and Bidani 6 – Reference Iseki, Ikemiya and Kinjo 8 ), and lifestyle interventions including dietary treatment improve body weight in obese individuals( Reference Wadden, Webb and Moran 40 ). LCD and corresponding high-protein diets have been recognised as the effective treatment to control body weight( Reference Hession, Rolland and Kulkarni 10 – Reference Samaha, Iqbal and Seshadri 12 ). In addition, it has been reported that LCD improved CVD risk factors at short term( Reference Foster, Wyatt and Hill 41 ). In contrast, it has been reported that LCD is a potential risk for renal dysfunction, because LCD is associated with high protein intake. A recent study showed that LCD does not negatively affect eGFR compared with a low-fat diet among obese individuals( Reference Friedman, Ogden and Foster 36 ). We ensured that LCD did not negatively affect eGFR in overweight and obese individuals without CKD in this meta-analysis.
The possible reasons why LCD is effective for renal function are as follows. Obesity is related to the prevalence and the progression of CKD( Reference Kramer, Luke and Bidani 6 – Reference Iseki, Ikemiya and Kinjo 8 ); therefore, weight loss by LCD might lead to improvement in renal function. In fact, some studies have revealed that LCD was effective for weight loss( Reference Nordmann, Nordmann and Briel 42 , Reference Naude, Schoonees and Senekal 43 ). In this meta-analysis, body weight decreased significantly from baseline in both LCD and control diet groups; however, there was no significant difference between the LCD and control diet groups with regard to change in body weight (data not shown). On the other hand, there is also a possibility that the increase in eGFR did not reflect improvement of renal function. As creatinine generation is determined by muscle mass and creatinine consumption, LCD and corresponding high-protein diets lead to glomerular hyperfiltration, glomerular hypertrophy and increased glomerular pressure, which might be both a cause and a consequence of renal injury( Reference Dansinger, Gleason and Griffith 44 ). Glomerular hyperfiltration could be caused by afferent arteriolar vasodilation as seen in patients with diabetes or after a high-protein diet, and/or by efferent arteriolar vasoconstriction owing to activation of the renin–angiotensin–aldosterone system( Reference Dansinger, Gleason and Griffith 44 ). According to a systematic review of glomerular hyperfiltration assessment, however, the definition of glomerular hyperfiltration threshold ranged from 90·7 to 175 ml/min per 1·73 m2 ( Reference Cachat, Combescure and Cauderay 45 ). In this meta-analysis, the mean eGFR values at the end point were 69·4–124·2 ml/min per 1·73 m2 in the LCD group and 65·0–112·6 ml/min per 1·73 m2 in the control group.
In this study, although the mean change in eGFR in the LCD group was greater than that in the control group, the difference was very low. Therefore, the clinical significance of LCD on renal function might not be great. However, this meta-analysis showed that LCD and the corresponding high-protein diet was not harmful for renal function in overweight and obese individuals without renal dysfunction.
A previous study showed that the adverse effect of high-protein diets on renal function occurred only after long-term follow-up, such as 3 or more years( Reference Helal, Fick-Brosnahan and Reed-Gitomer 46 ). There is a possibility that the adverse effect of LCD on renal function might not have appeared yet. Thus, we cannot deny the possibility that observational periods might not be enough, and further long-term studies are needed.
The present study has several limitations. First, the definition of LCD was inconsistent and extreme carbohydrate restrictions such as under 40 g/d and 4 % of total energy content( Reference Rolland, Hession and Murray 33 , Reference Brinkworth, Buckley and Noakes 34 ) were included among these studies. Second, the dropout rate was relatively high in most studies( Reference Krebs, Elley and Parry-Strong 22 , Reference Stern, Iqbal and Seshadri 23 , Reference Brinkworth, Noakes and Keogh 32 – Reference Friedman, Ogden and Foster 36 ). In this meta-analysis, the dropout rate of six studies( Reference Krebs, Elley and Parry-Strong 22 , Reference Stern, Iqbal and Seshadri 23 , Reference Brinkworth, Noakes and Keogh 32 – Reference Brinkworth, Buckley and Noakes 34 , Reference Friedman, Ogden and Foster 36 ) were over 20 %. In addition, poor adherence of study participants is also a limitation. Most of the participants in this study were not able to achieve and maintain target diet macronutrient compositions. In fact, the macronutrient composition tended to be restored to baseline proportions in these study participants, indicating that it is difficult to change the habitual dietary patterns to another dietary pattern. The motivation of participants was also important and this affected retention rates. In fact, several studies revealed that adherence to the diet was greatly diminished after the first few months( Reference Yancy, Olsen and Guyton 47 ). Participants who completed the study may have represented a group of motivated participants, and this could have potentially biased the observed effects and might limit the generalisability of the findings. Thus, not randomised controlled trials but observational studies might be suitable for evaluating the effect of diet treatment( Reference Hession, Rolland and Kulkarni 10 ). Third, the sample size was relatively small and the study duration was short to provide clear effects of LCD on renal function. Further studies with larger sample sizes and long-term duration are required in order to elucidate the long-term safety and efficacy of this dietary strategy on renal function. Fourth, eGFR was not directly measured, although our findings are consistent with previously reported effects on eGFR( Reference Helal, Fick-Brosnahan and Reed-Gitomer 46 ). Fifth, there is a possibility that participants who develop renal issues would not continue with the trial and would likely withdraw, and it is possible that such an effect could have been missed in this meta-analysis. Sixth, the changes in proteinuria, microalbuminuria and macroalbuminuria could be more important than that of eGFR. We have also searched for changes in proteinuria, microalbuminuria and macroalbuminuria; six studies( Reference Krebs, Elley and Parry-Strong 22 , Reference Larsen, Mann and Maclean 35 – Reference Yamada, Uchida and Izumi 37 , Reference Goldstein, Kark and Berry 39 , Reference Tay, Thompson and Luscombe-Marsh 48 ) have reported data on microalbuminuria. However, four studies( Reference Krebs, Elley and Parry-Strong 22 , Reference Larsen, Mann and Maclean 35 , Reference Friedman, Ogden and Foster 36 , Reference Goldstein, Kark and Berry 39 ) did not show data on mean values and standard deviations. Therefore, we could not perform a meta-analysis. Further studies are needed to determine the effects of LCD on proteinuria, microalbuminuria and macroalbuminuria. Finally, we did not provide any assessment of physical activity or other lifestyle habits except the diet therapy.
In conclusion, this meta-analysis revealed that the increase in eGFR in the LCD group was greater than that in the control group in overweight and obese individuals without CKD in at least 6 to 24 months.
Acknowledgements
M. A., M. Y. and M. F. have received grants, honoraria and research supports from AstraZeneca plc., Astellas Pharma Inc., Nippon Boehringer Ingelheim Co., Ltd, Daiichi Sankyo Co., Ltd, Eli Lilly Japan K.K., Kyowa Hakko Kirin Company Ltd, Kissei Pharmaceutical Co., Ltd, MSD K.K, Mitsubishi Tanabe Pharma Corporation, Novo Nordisk Pharma Ltd. Sanwa Kagaku Kenkyusho Co., Ltd, Sanofi K.K., Ono Pharmaceutical Co., Ltd and Takeda Pharmaceutical Co., Ltd. The sponsors were not involved in the study design; in the collection, analysis, interpretation of data; in the writing of this manuscript; or in the decision to submit the article for publication.
C. O., Y. H., T. F., M. T., M. A., M. Y. and M. F. analysed the data; C. O. and Y. H. reviewed the articles; C. O. wrote the manuscript; Y. H., T. F., M. T., M. A. and M. Y. contributed to the discussion; and M. F.: reviewed/edited the manuscript.
M. A., M. Y. and M. F., their immediate families and any research foundations with which they are affiliated have not received any financial payments or other benefits from any commercial entity related to the subject of this article. The authors declare that, although they are affiliated with a department that is supported financially by a pharmaceutical company, the authors received no current funding for this study and this does not alter their adherence to all the journal policies on sharing data and materials. C. O., Y. H., T. F. and M. T. have nothing to disclose.


