


There is increasing interest in the role of dietary protein and specific types of protein (e.g. from animal or plant sources) in health and disease(Reference Westerterp-Plantenga, Nieuwenhuizen and Tomé1–Reference Surdykowski, Kenny and Insogna4). Observational epidemiological studies in this field often rely on FFQ or dietary recalls to estimate habitual intake of (types of) protein. Such memory-based methods, however, are prone to errors, which can lead to misclassification of participants and could weaken the associations between intake of protein types and health outcomes(Reference Thompson, Subar, Coulston and Boushey5, Reference Kipnis, Subar and Midthune6). Therefore, markers of intake for these protein types in biological tissues or fluids could provide more objective indices of true intake. Several metabolic compounds, i.e. urinary carnosine(Reference Dragsted7), 1-methylhistidine (1-MH)(Reference Sjölin, Hjort and Friman8), 3-methylhistidine (3-MH)(Reference Dragsted7, Reference Sjölin, Hjort and Friman8), taurine(Reference Brosnan and Brosnan9, Reference Evered, Harvey and Luck10), sulphate(Reference Dragsted7), creatinine(Reference Dragsted7) and serum creatine(Reference Dragsted7, Reference Delanghe, De Slypere and De Buyzere11), have been proposed as biomarkers for meat protein intake (Table 1). Furthermore, the ratio between natural stable isotopes of N (14N:15N) may be an indicator for the ratio between plant and animal protein intake(Reference DeNiro and Epstein12, Reference Sponheimer, Robinson and Ayliffe13). However, none of these potential biomarkers has sufficiently been validated. Biomarkers for other major protein types, i.e. meat, dairy and grain protein, are lacking.
Table 1 Overview of postulated biomarkers

1-MH, 1-methylhistidine; 3-MH, 3-methylhistidine.
We conducted a controlled dietary intervention study to identify potential biomarkers for intake of dairy protein, meat protein and grain protein, which could be useful for further epidemiological studies. We focused on these types of protein because these are the main sources of protein in the Dutch population, with approximately 26 % of total protein intake originating from dairy products, 25 % from meat and 18 % from grain(Reference Halkjær, Olsen and Bjerregaard14). The proteins were provided to the participants in a food-based setting in order to mimic a real-life situation.
Materials and methods
Study population
Participants were recruited within a 10-km radius from the university campus. Men and women aged between 18 and 40 years, with a BMI between 18·5 and 30 kg/m2, were invited to participate. We used questionnaires to collect information about the general characteristics and the medical status. Individuals suffering from chronic disease(s) or using prescribed medication were excluded. We also excluded women who were pregnant, lactating or not using oral contraceptives. Liver and kidney function markers were checked for abnormalities in a fasted blood sample before the start of the study.
Study design
The Biomarker Study was a controlled, randomised, multiple cross-over dietary intervention study, which was conducted between 21 March and 20 April 2011 at the Wageningen University, The Netherlands. We aimed to explore whether new biomarkers for protein from dairy products, meat and grain could be identified, and whether postulated biomarkers for these types of protein could be confirmed. Because the expected standard deviation of potential new biomarkers was not known, we estimated the necessary study size from the study size of comparable studies (n 24(Reference Bertram, Hoppe and Petersen15) and n 12(Reference Stella, Beckwith-Hall and Cloarec16)). Furthermore, we conducted a power calculation based on 3-MH, one of the postulated biomarkers. In a study carried out on thirty-two participants, urinary 3-MH excretion increased with 1·34 μmol/g of dietary protein (mainly from meat) after 1 d of altered intake(Reference Marliss, Wei and Dietrich17). With a difference in meat protein intake of 10 g and a standard deviation of 21 μmol 3-MH, we expected twenty-one participants to be needed (power 80 %, P= 0·05, n 7·9 × (sd/D)2). To allow for drop out and uncertainty with regard to the new biomarkers, we included a total of thirty participants in the present study.
An overview of the study design is given in Fig. 1. The study lasted for 30 d and consisted of four dietary periods: a run-in period of 9 d and three subsequent intervention periods of 7 d each that were applied in random order. The participants were allocated to one of the six diet orders by block randomisation, with a block size of five and with stratification for sex. On the last day of each treatment period, urine was collected for 24 h and a fasting blood sample was taken. The present study was conducted according to the guidelines laid down in the Declaration of Helsinki, and all procedures involving human participants were approved by the medical ethics committee of the Wageningen University. Written informed consent was obtained from all the participants. The design and aim of the study was registered in the NIH clinical trial database (ClinicalTrials.gov number. NCT01314 040).

Fig. 1 Flow diagram of participants in the Biomarker Study. After 9 d run-in, participants were randomised in one of six diet orders. Each intervention diet was consumed for 7 d. The run-in diet was aimed at approximately 15 % of energy (en%) protein, whereas the intervention diets were aimed at approximately 18 en% protein, of which approximately 14 en% originated from the source of interest. After each dietary period, 24 h urine and blood were collected. * Urine data of the run-in period of one participant were excluded because he reported incomplete urine collection. † Two participants (a man and a woman) discontinued the intervention because of difficulties with the fact that they were not allowed to choose their own food. ‡ The data of the dairy protein period of one participant were excluded from analysis because of a 130 % higher nitrogen excretion than expected, based on chemical analysis of the diet. § The data of the grain protein period of one participant were excluded because of knee surgery on the day before collection. ∥ The urine data of the dairy protein period of one participant were excluded because of a mistake in urine handling.
Dietary intervention
Menus were designed for ten levels of energy intake, ranging from 7 to 16 MJ/d. The participants were allocated to an energy intake level close to their habitual energy intake, which was estimated before the start of the study using an FFQ(Reference Siebelink, Geelen and De Vries18). From Monday to Friday, participants consumed their hot meal at lunchtime at the Wageningen University, supervised by dietitians who ensured that the complete meal was consumed. Breakfast, bread meals, snacks, beverages and all meals for Saturdays and Sundays were provided in take-home packages. Participants were carefully instructed on how to prepare the hot meals during the weekends. When participants had incidentally increased energy requirements, e.g. because of sports, a bread bun (500 kJ/bun) was provided with the same relative macronutrient composition as the intervention diet of the participant. During the whole study, we supplied 90 % of daily energy intake to the participants. To cover the remaining 10 % of daily energy needs, participants were obliged to choose foods that were low in protein content ( < 0·6 g protein per portion) from a restricted list. They recorded these foods in a diary in which they also noted any deviations from the study protocol. Body weight was measured twice every week with indoor clothing, without shoes and with empty pockets on a digital balance accurate to 0·1 kg (Seck Bascule, MT). If necessary, energy intake was adjusted to limit changes in weight to less than 0·2 kg.
Diet composition and chemical analyses of duplicate portions
The total protein content of the run-in diet was aimed at 15 % of energy (en%). The intervention diets had a protein content aimed at approximately 18 en%, with approximately 14 en% coming from either dairy products, meat or grain. During the dairy protein-based diet, the main sources of protein were milk and milk products, yoghurt and cheese. In addition, a whey protein isolate was added to the dessert (approximately 4 en%; Nectar, Syntrax). In the meat protein-based diet, the main protein sources were pork, beef and chicken. The main protein sources in the grain protein-based diet were wheat, bran, rice and maize. Additionally, the diet contained legumes (chickpeas, lentils), contributing 3·6 en% of protein. A wheat protein isolate was added to the dessert, the dressing and the drink (approximately 7 en%; Ultimate Nutrition, Inc.).
Duplicate portions of each intervention diet, with an energy level of 11 MJ, were collected daily and analysed for energy, fat, DM, ash and dietary fibre, according to the official methods of analysis (Association of Official Analytical Chemists)(19). Furthermore, N was determined by the Kjeldahl method (Kjeltec 2300; Foss), and the amount of protein was calculated using a conversion factor of 6·25. Carbohydrate content of the diets was calculated by difference.
Amino acid (AA) composition was measured using ion-exchange chromatography and derivatised post-column (TRIS/AZA, JEOL AminoTac JLC/500-V; Jeol), after hydrolysis of the samples with HCl (6 mol/l) using norvaline as internal standard. Detection was performed at 570 nm (proline at 440 nm). For the determination of cystine and methionine, hydrolysis was preceded by oxidation with performic acid. For analysis of tryptophan, samples were hydrolysed by heating at 119°C in a N2 atmosphere with barium hydroxide solution using 5-methyl tryptophan as internal standard. Samples were analysed by HPLC (HPLC-pump: Waters 616, autosampler Waters 717; Waters Corporation) with fluorescence detection, excitation at 300 nm and emission at 330 nm (fluorescence detector: Jasco FP-1520; Jasco Benelux b.v.; column: Nucleosil C18, PN 89 161; Grace Davison Discovery Science). The nutrients in the free-choice items were calculated (NEVO, 2006(20)) and added to the analysed values (Table 2).
Table 2 Mean daily intakes* of energy, macronutrients and amino acids by thirty participants during the Biomarker Study

en%, Percentage of energy; protein %, percentage of total protein intake.
* Mean nutrient intakes were calculated from chemically analysed values of duplicate portions of each diet with an energy level of 11 MJ. The nutrients of the free-choice low-protein items were calculated (NEVO, 2006(20)) and added to the analysed values.
† Mean nutrient intake was only based on the calculated nutrient content of foods because types of protein cannot be distinguished in chemical analysis.
‡ 3·6 en% of protein came from chickpeas and lentils (food based).
Because the actual intake of total protein did not exactly meet the target intake, leading to differences across the diet periods, we adjusted all our analyses for N excretion, so that biomarkers for protein types could be identified independent of protein quantity of the diets.
Urine sampling and analysis
Urine was collected during 24 h at the final day of the run-in period and each intervention period. Before collection, 3 ml of chlorhexidine digluconate (19–21 % m/V) was added to each 2 litre urine container as a preservative. Participants were instructed to discard the first voiding in the morning after waking up and to note the time. Subsequently, they collected all the urine up to and including the voiding on the same time the next day. Urine was kept cool in a cooling bag with a cooling element during the 24 h collection. Subsequently, urine samples were stored at − 80°C until analyses. Total N was analysed by the Kjeldahl method (Kjeltec 2300; Foss) and used as a marker of dietary compliance. Expected 24 h N excretion was calculated as total daily protein intake (as obtained from chemical analyses of duplicate portions) divided by 6·25. Because urinary N reflects approximately 80 % of protein intake(Reference Bingham21), the resulting number was multiplied by 1·25. Participants with 50 % higher or lower N excretion than expected were considered to be non-compliant and excluded from the analysis.
Urinary creatinine was analysed by the Jaffé reaction using reagents from Roche Diagnostics on a Roche-Hitachi Modular P device (Roche). Furthermore, the levels of urinary AA were analysed by a triple-quadrupole mass spectrometer (type API 4000; AB SCIEX) after separation of AA by isocratic HPLC (Agilent 1100LC; Agilent Technologies Deutschland GmbH). Isotope analysis (14N/15N) was conducted by Europe 20/20 Stable Isotope Analyser coupled with a 15N sample combustion unit (Europa Scientific Limited).
Blood sampling and analysis
At the final morning of each study period, a fasting blood sample was obtained from the antecubital vein of the forearm. From 22.00 hours the evening before, participants were not allowed to consume foods or drinks except for water. Blood was sampled in vacutainer tubes (BD Vacutainer) containing clot activator for serum and in tubes containing potassium ethylene diamine tetra acid for plasma. Potassium ethylene diamine tetra acid plasma tubes were ice-chilled and centrifuged for 10 min at 1190 g at 4°C, within 60 min after venepuncture. Serum tubes were stored in the dark for approximately 1·5 h and then centrifuged for 10 min at 1550 g at 20°C. Plasma and urine samples were stored at − 80°C until analysis.
Creatine in the serum was analysed using the Barrit reaction after addition of 1-naphthol and photometrically quantified at 546 nm (Hitachi U-1800 spectrophotometer; Hitachi High-Technologies Europe GmbH). Finally, AA profile in plasma was analysed by a triple-quadrupole mass spectrometer (type API 4000; AB SCIEX) after separation of AA by isocratic HPLC (Agilent 1100LC; Agilent Technologies Deutschland GmbH).
Statistical analysis
To identify biomarkers that may be useful to estimate the intake of protein types, we used a two-step approach. With principal component discriminant analysis (PCDA), we identified AA from the urinary and plasma AA profiles that were distinctive between the diets. For individual biomarkers that did not belong to the AA profile (i.e. urinary creatinine, sulphate, ‰15N and serum creatine), we investigated whether there were differences between intervention diets using ANCOVA. As a second step, we applied mixed models after pooling total study data to estimate the predictive value of selected AA and individual biomarkers for intake of protein types.
PCDA were performed in the Matlab environment (R2008b, 1984-8; The Mathworks, Inc.) using the PLS toolbox for Matlab version 5.0.3 (r 6466, 1995-8; Eigenvector Research, Inc.). We performed ANCOVA and mixed models using the SAS statistical software package (SAS version 9.2; SAS Institute).
Preparation of data
Urinary excretion data of AA and sulphate were adjusted for creatinine excretion to account for potential incompleteness of the 24 h urine collections. Furthermore, these data were adjusted for total N excretion to take into account the unintended differences in protein content of intervention diets that were revealed by chemical analysis of the duplicate portions. Plasma AA levels and serum creatine were not correlated to total protein intake and were, therefore, not adjusted for differences in the protein content of the diets. Missing data due to levels below the detection limit were replaced by detection limit divided by two. For PCDA of AA profiles, levels of AA were calculated relative to the run-in period ((diet-run-in)/run-in × 100) and data were mean-centred per person to remove the between-subject variation. Furthermore, auto-scaling of all AA was performed by dividing the values by their own standard deviation.
Identification of amino acids that are distinctive between diets
Principal component analysis(Reference Joliffe22) was used to screen all data sets in order to detect outliers or patterns present in the data. PCDA classification was applied to investigate diet differences. The validity of the PCDA model was tested using a ten-fold Venetian blind cross-validation. This resulted in a percentage of samples that could be classified in the right diet based on the urinary or plasma AA profiles.
In PCDA, loadings of the discriminant (a linear combination of all AA from the profile) reflect the influence of the original variables on differences between diets, which allowed us to identify specific AA that might be distinctive for intake of one of the protein types of interest(Reference van der Werf, Pieterse and van Luijk23, Reference Hoogerbrugge, Willig and Kistemaker24). We considered loadings >4 for further analysis.
Identification of individual biomarkers that are different between diets
For individual biomarkers that did not belong to the AA profile (i.e. urinary creatinine, sulphate, ‰15N and serum creatine), we investigated whether there were differences between intervention diets using ANCOVA. Because of non-normality, data were log-transformed. In case a significant diet effect was found, partial tests, corrected for multiple comparisons using Tukey–Kramer, were used to identify the differences. We considered a two-sided P value < 0·05 as statistically significant.
Predictive value of selected amino acids and individual markers
To explore whether AA with a loading >4 or individual compounds that were significantly different between diets would be interesting as biomarkers, we evaluated their predictive value for the intake of one of the protein types. We modelled the compounds of interest against intake of protein types using mixed model analysis with participant number as a random factor and data of all diets in one model. Subsequently, we calculated the amount of explained variation in intake using the method of Snijders & Bosker(Reference Snijders and Bosker25).
Results
The study involved thirteen men and seventeen women, with a mean age of 22 (sd 4) years and a BMI of 21·6 (sd 2·2) kg/m2 (Fig. 1). Kidney and liver functions were normal, with mean serum creatinine being 73·3 (sd 9·8) μmol/l, aspartate aminotransferase (ASAT) 29·4 (sd 5·7) μ/l, alanine aminotransferase (ALAT) 18·8 (sd 9·3) μ/l and γ-glutamyltransferase (γ-GT) 20·5 (sd 11·6) μ/l. After the first intervention period, one male and one female participant withdrew, because they could no longer adhere to the prescribed diet. Furthermore, for one participant, urine data of the run-in period were excluded from the analysis because he reported incomplete urine collection. For another participant, data of the grain protein period were excluded because of a knee surgery on the day before collection and the data of the dairy protein period of a third participant were excluded because of a 130 % higher N excretion than expected, based on the chemical analysis of the diet. Finally, for one participant, urine data of the dairy protein period were excluded because of a mistake in urine handling.
In Table 3, AA intake and AA levels in plasma and in urine are shown after adjustment for total protein intake (AA intake) or total N and creatinine excretion (levels in urine). Baseline values without adjustment are given in supplementary Table S1 (available online). Principal component analysis revealed no sex differences or other patterns that were not due to diet differences.
Table 3 Overview of mean amino acid intake (adjusted for total protein intake), plasma levels and urinary excretion (adjusted for total nitrogen excretion and creatinine excretion) of thirty participants in the Biomarker Study (Mean values with their standard errors)

Pea, phosphoethanolamine; 1-MH, 1-Methylhistidine; 3-MH, 3-Methylhistidine.
* Adjusted for total protein intake by means of ANCOVA.
† Adjusted for total N and creatinine excretion by means of ANCOVA.
Identification of urinary amino acids that are distinctive between diets
The results from PCDA of urinary AA profiles are depicted in Fig. 2. In cross-validation of the PCDA model, 70 % of the participants were correctly classified in the dairy protein-based diet, 93 % in the meat protein-based diet and 80 % in the grain protein-based diet. The differences between the meat protein-based diet and the other two diets were mainly observed in the values of discriminant 1. Several of the AA that have been suggested as biomarkers for meat protein had an absolute loading >4 in the direction of the meat protein-based diet (i.e. 1-MH, 3-MH and carnosine, Table 4). The AA that had an absolute loading >4 in the direction of the other two diets were proline and cysteine. Because in the values of discriminant 2 diets could not be separated, it was not possible to identify the potential biomarkers for the other two diets.

Fig. 2 Principal component discriminant analysis (PCDA) score plot for urinary amino acid profiles of twenty-seven participants in the Biomarker Study. Values of the two discriminant components from PCDA that explained most variation in urinary amino acid profiles. Each dot represents a linear combination of all urinary amino acid levels in one participant during one dietary period. Based on their urinary amino acid profiles, 93 % of participants were correctly classified in the meat protein-based diet, 70 % in the dairy protein-based diet and 80 % in the grain protein-based diet. D1, discriminant 1; D2, discriminant 2.
Table 4 Urinary amino acid excretion of twenty-seven participants in the Biomarker Study, relative to run-in: principal component discriminant analysis (PCDA) loadings of discriminant 1 (D1) of Fig. 2*
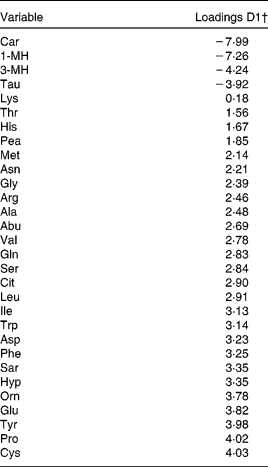
1-MH, 1-Methylhistidine; 3-MH, 3-Methylhistidine; Pea, phosphoethanolamine.
* In PCDA, loadings (or weights) of the discriminant (a linear combination of all amino acids from the profile) reflect the influence of the original variables on differences between diets.
† High negative values indicate a high influence of the amino acid on classification in the meat protein-based diet, whereas high positive values indicate a high influence on classification in one of the two other diets.
Identification of plasma amino acids that largely influence diet differences
For the plasma AA profiles, results are depicted in Fig. 3. The percentage of participants that was correctly classified was 86 % for the dairy protein-based diet, 88 % for the meat protein-based diet and 96 % for the grain protein-based diet. The differences between the grain protein based-diet and the other two diets were mainly observed in the values of discriminant 1, and AA that had an absolute loading >4 in the direction of the grain protein diet were proline, ornithine and arginine (Table 5). AA with an absolute loading in the direction of the other two diets were lysine, valine, threonine and α-aminobutyric acid. Because in the values of discriminant 2 diets could not be separated, it was not possible to identify potential biomarkers for the other two diets.

Fig. 3 Principal component discriminant analysis (PCDA) score plot for plasma amino acid profiles of twenty-eight participants in the Biomarker Study. Values of the two discriminant components from PCDA that explained most variation in plasma amino acid profiles. Each dot represents a linear combination of all plasma amino acid levels in one participant during one dietary period. Based on their plasma amino acid profiles, 96 % of participants were correctly classified in the grain protein-based diet, 88 % in the meat protein-based diet and 86 % in the dairy protein-based diet. D1, discriminant 1; D2, discriminant 2.
Table 5 Plasma amino acid levels of twenty-eight participants of the Biomarker Study, relative to run-in: principal component discriminant analysis (PCDA) loadings of discriminant 1 (D1) of Fig. 3*
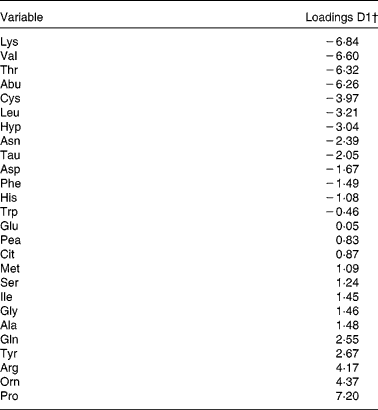
Pea, phosphoethanolamine.
* In PCDA, loadings (or weights) of the discriminant (a linear combination of all amino acids from the profile) reflect the influence of the original variables on differences between diets.
† High positive values indicate a high influence of the concerned amino acid on the classification in the grain protein-based diet, whereas high negative values indicate a high influence on classification in one of the two other diets.
Identification of individual biomarkers that are different between diets
In Table 6, the 24 h urinary excretion of N, sulphate and creatinine are shown. After adjustment for total N and creatinine excretion, 24 h urinary sulphate was 3·4–4·0 mmol lower during the meat protein-based diet compared with the other two diets (P< 0·01). Furthermore, urinary creatinine levels were 0·2–0·3 g lower in the dairy protein-based diet (P< 0·01), and the proportion of 15N was slightly lower in the grain protein-based diet compared with the other two diets (0·002–0·003 ‰), with a borderline significant diet effect (P= 0·06). The partial tests, however, did not show a significant difference (P= 0·08 for grain v. dairy protein, P= 0·11 for grain v. meat).
Table 6 Postulated biomarker levels in thirty participants of the Biomarker Study during each diet (Mean values with their standard errors)
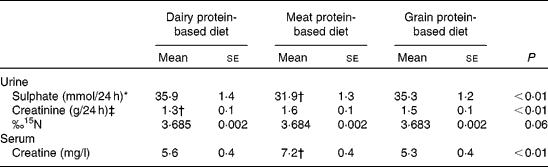
* Adjusted for creatinine excretion and N excretion.
† Diet different from the other two diets P< 0·01.
‡ Adjusted for N excretion.
The serum creatine levels during the different diets are shown in Table 6. During the meat protein diet, creatine levels were 1·6–1·9 mg/l higher than during the other two diets (P< 0·01).
Predictive value of selected amino acids and individual markers
A combination of the three urinary AA with absolute loadings >4 in the direction of the meat protein diet, i.e. 1-MH, 3-MH and carnosine, explained 98 % of variation in meat protein intake during the study (Table 7), which was more than that explained by each of these AA separately (69, 72 and 34 %, respectively). Adding proline and cystine to the model did not explain extra variation. For dietary grain protein, the combination of plasma concentrations of proline, arginine and ornithine, explained 24 % of variation in grain protein intake, whereas a combination of all seven AA with the highest loadings in PCDA (plasma proline, lysine, valine, threonine and α-aminobutyric acid, ornithine and arginine) explained 75 % of variation in intake. With regard to variation in dairy protein intake, urinary creatinine did not explain any variation in intake.
Table 7 Regression models of potentially interesting biomarkers from ANCOVA and principal component discriminant analysis (PCDA) with protein types, and explained variation in intake

AA, amino acids.
* Regression model containing AA with PCDA loadings >4 in the direction of the diet of interest.
† Regression model containing all AA with absolute PCDA loadings>4.
Discussion
In the present diet-controlled intervention study among thirty young healthy adults, a very good prediction could be made for the intake of meat protein by a regression model that included urinary carnosine, 1-MH and 3-MH (98 % of variation in intake explained). Furthermore, for dietary grain protein, a model that included seven AA (plasma lysine, valine, threonine, α-aminobutyric acid, proline, ornithine and arginine) made a good prediction (75 % of variation explained). We could not identify biomarkers for dairy protein intake.
Strengths of the present study were the strictly controlled diets, the low dropout rate (n 2) and good compliance to the diets, as indicated by N excretion. In addition, the multivariate analysis of AA profiles made it possible to study a wide range of biomarkers at the same time, taking correlations between these biomarkers into account. Because each protein type contains all AA in different proportions, it is not possible to identify a single AA or AA derivative that indicates whether or not a certain protein type is consumed. However, in the present study, we could identify combinations of AA that may be used to rank individuals according to intake of a protein type.
A limitation of the study, however, was the difference in total protein intake across the intervention periods. Because urinary AA excretion was strongly correlated to total protein intake (correlation coefficients ranging from 0·17 to 0·68, with sixteen out of thirty AA showing a correlation coefficient >0·5), we accounted for this difference by adjusting urinary data for total N excretion. N intake is considered to be a biomarker for total protein intake(Reference Bingham21). Consequently, biomarkers for protein intake could be identified independent of protein quantity of the diets. Furthermore, because of potential interference with laboratory analysis of urinary AA profiles, we could not use para-aminobenzoic acid as a marker of completeness of 24 h urine collection. Therefore, 24 h urine collection was carefully monitored by registration. Participants had to write down the time at the moment that they started with urine collection, and at the moment they stopped collection. Furthermore, they were instructed to write down a comment about whether they managed to collect all urine during the 24 h. In addition, we used creatinine as a crude marker of completeness. As creatinine is produced and excreted by the body in a constant rate, depending on the amount of muscle mass and kidney function, the individual 24 h urinary creatinine excretion is constant in healthy subjects in a steady state. Since the participants of the Biomarker Study were young, apparently healthy people in a steady state and were instructed to keep their physical activity constant during the study, we expect that creatinine excretion remained constant throughout the study, and as such could be used as a marker for urine collection. Although in earlier studies creatinine excretion has been associated with meat intake(Reference Dragsted7), we did not find an indication of such an association in the present study. We did observe a significantly lower creatinine excretion during the dairy protein-based diet, but urinary creatinine did not explain any variation in dairy protein intake in regression analysis. We therefore expected these differences between diets to be chance findings and considered it justified to adjust all urinary excretion data for creatinine excretion to account for the incompleteness of urine collection.
Meat protein intake was best predicted by a regression model that included urinary carnosine, 1-MH and 3-MH. In literature, urinary carnosine, 1-MH and 3-MH have been proposed as biomarkers for meat protein intake. In an exploratory study in one healthy man, urinary carnosine was increased after ingestion of muscle protein, although the increase was only a small proportion of carnosine ingested(Reference Abe, Okuma and Sekine26). In thirty-three non-diabetic obese participants, a linear relationship was found between meat protein intake and 3-MH excretion, with an increment of 1·34 μmol/g of ingested protein(Reference Marliss, Wei and Dietrich17); and in a Swedish study among five healthy adults, a strong linear relationship was found between meat intake (beef, pork, chicken and plaice) and 3-MH and 1-MH excretion(Reference Sjölin, Hjort and Friman8). In the present study, a combination of these three AA explained 98 % of variation in meat protein intake, which was more than the variation explained by each of these AA per se. The combination of the three AA may be a useful biomarker for intake of meat protein that warrants validation in controlled studies with different levels of meat protein intake.
It has been shown that after intake of 1-MH and 3-MH from meat, these AA are rapidly excreted in urine and fasting plasma levels are, therefore, very low(Reference Dragsted7, Reference Marliss, Wei and Dietrich17, Reference Abe, Okuma and Sekine26, Reference Long, Haverberg and Young27), which is why these plasma levels were not measured in the present study. This may partly explain why, in the plasma AA profile, the grain protein diet showed the best separation from the other diets, in contrast to the urinary profile, where the meat protein diet showed the best separation. A regression model with a combination of plasma concentrations of seven AA (lysine, valine, threonine, α-aminobutyric acid, proline, ornithine and arginine) explained 75 % of variation in grain protein intake. Compared with the other two diets, our grain protein diet had a lower content of the essential AA lysine, threonine, valine and methionine, which was reflected in lower plasma levels of the first three AA and in the level of plasma α-aminobutyric acid, which is derived primarily from methionine and serine(Reference Shaw and Lieber28). Furthermore, glutamic acid was relatively high in the grain protein diet, which was reflected in a higher excretion of proline, arginine and ornithine for which glutamic acid is a precursor(Reference Wu29). Nevertheless, we should be careful in interpreting these results. Because grains added much bulk to the diet, we replenished the grain protein-based diet with legumes (chickpeas, lentils; 3·6 en% legume protein) to reach 14 en% of plant protein. Additionally, this was the only diet that focused on protein of plant origin, and markers that we identified as potential biomarkers for grain protein may, in reality, reflect plant protein in general. These results need confirmation in other studies with a range in grain protein intake closer to the habitual intake, in which it is not necessary to add protein from other plant sources. Furthermore, plasma AA levels need to be compared between a grain protein-based diet and a diet that contains protein from other plant sources.
A potential marker for which data in human subjects up to date are scarce is the ratio of 14N:15N stable isotopes in urine as a biomarker for the proportion of plant and animal proteins in the diet. There is evidence that human hair and bones reflect the proportion of animal protein in the diet(Reference O'Connell and Hedges30), and in cattle urine, differences in 15N isotope levels have been found in response to a maize or a grass diet(Reference Knobbe, Vogl and Pritzkow31). In line with the hypothesis that the proportion of 15N increases with higher animal protein intake, we observed, in the present study, a tendency towards a lower percentage of urinary 15N during the grain protein-based diet compared with the other two diets. However, this difference was too small to be significant. Possibly, a dietary period of 1 week was too short to reach the maximum effect of diet on urinary stable isotope ratio. In cattle, the urinary 15N required 12 d to reach the new equilibrium after dietary changes(Reference Knobbe, Vogl and Pritzkow31). This potential biomarker needs to be investigated in a study with longer dietary periods.
In the present study, among thirty young healthy adults, we identified a combination of three AA in urine as potentially useful biomarkers for the intake of meat protein and a combination of seven AA in plasma as potentially useful biomarkers for the intake of grain protein. We did not find biomarkers for dairy protein intake. Further studies are needed to validate these findings and to investigate whether these biomarkers are also useful within lower ranges of intake, as observed in population-based studies.
Supplementary material
To view supplementary material for this article, please visit http://dx.doi.org/10.1017/S0007114512005788
Acknowledgements
We would like to thank all the participants, dietitians, students, kitchen- and laboratory personnel, Dr Carina Rubingh (TNO), Dr Suzan Wopereis (TNO) and other co-workers for their motivation, dedication and valuable contributions to the study. The Biomarker Study was funded by TI Food and Nutrition, public private partnership in food and nutrition research. The mission is to contribute to optimum human nutrition, food safety and sustainable food production and to increase the competiveness of the food industry. Partners are key players in the global food industry, leading research institutes, universities and medical centres. The funders had no role in study design, data collection and analysis, decision to publish or preparation of the manuscript. W. A.-v. d. K., E. J. B., E. S., P. v. V., D. T., S. J. L. B., M. A. B. and J. M. G. designed the research; W. A.-v. d. K., M. B. and E. S. conducted research; W. A.-v. d. K., S. B. and M. B. analysed data; W. A.-v. d. K., E. J. B., M. F. E. and J. M. G. wrote paper; W. A.-v. d. K. has the primary responsibility for the final content of the paper. All authors have read and approved the final manuscript. None of the authors had a conflict of interest.


