


The glycaemic index (GI) is a method of ranking foods on the basis of the incremental blood glucose response they produce for a given amount of available carbohydrate (ACHO) compared to the reference glucose solution or white bread(Reference Jenkins, Wolever and Taylor1). The glycaemic load (GL) (i.e. the GI multiplied by the ACHO amount of a portion consumed, divided by 100) has been interpreted as an indicator of a glucose response induced by the portion of food or, in the case involving the whole diet, by the total carbohydrate intake(Reference Salmeron, Ascherio and Rimm2, Reference Salmeron, Manson and Stampfer3).
A growing number of epidemiological studies have investigated associations between the diet GI and GL and disease, e.g. diabetes, obesity, CHD and several cancers, but findings suggesting a preventive role of a low-GI or low-GL diet have been controversial(Reference Feskens and Du4). A major difficulty in studying associations between the GI or GL and diseases has been the lack of GI and GL values for many foods, especially for national and local foods that may differ in ingredient composition and processing from foods tested elsewhere. Moreover, the quality of GI methodology varies. Thus far the descriptions of the compilation of only a few GI or GL databases have been published(Reference Flood, Subar and Hull5–Reference Schakel, Schauer and Himes8).
Knowledge of the effect of the GI and GL on diseases is important, because carbohydrates are commonly and globally used and recommended as the primary source of energy in the diet. Some characteristics of the typical Finnish diet (e.g. the consumption of potatoes, rye bread, berries and milk) differ from those of diets typical of the countries in which GI databases have been published previously. Thus, we describe the compilation of the GI database for the cohort studies within the Alpha-Tocopherol, Beta-Carotene Cancer Prevention (ATBC) Study and the main characteristics associating with diet GI and GL.
Materials and methods
The Alpha-Tocopherol, Beta-Carotene Cancer Prevention Study
The ATBC Study was a randomized, double-blind, placebo-controlled primary-prevention trial testing whether supplementation with α-tocopherol, β-carotene, or both would reduce the incidence of lung cancer and other cancers(9). A total of 29 133 Finnish male smokers were recruited between 1985 and 1988 from the total male population between 50 and 69 years of age in southwestern Finland (n 290 406). The study design, methods and primary trial results have been described in detail elsewhere(9, 10). Information on baseline characteristics (such as education and physical activity) was collected by a self-administered questionnaire. The ATBC Study was approved by the institutional review boards of the National Public Health Institute of Finland and the US National Cancer Institute. Each study participant provided his written informed consent at baseline. The baseline data collection of the trial and the register-based follow-up of diseases and mortality provide a feasible basis to study risk factors for many chronic diseases in a cohort setting.
Dietary assessment in the Alpha-Tocopherol, Beta-Carotene Cancer Prevention Study
Diet was assessed at baseline using a self-administered, modified diet history questionnaire(Reference Pietinen, Hartman and Haapa11). The questionnaire included 276 food items and mixed dishes. In addition to these, the subjects were allowed to add after each subgroup foods not listed in the questionnaire. The questionnaire was used with a picture booklet of 122 photographs of foods, each with three to five different portion sizes. The subjects were asked to report the frequency of consumption (per day, week or month) and the usual portion size of foods during the previous 12 months. During the first baseline visit, each subject received a questionnaire and picture booklet to be completed at home. During the second baseline visit 2 weeks later, the subject returned the questionnaire, and it was reviewed and completed with the help of a trained nurse. The questionnaire of 27 111 participants (93 %) was satisfactorily completed.
The dietary method was validated in a pilot study carried out among 168 men before the ATBC Study(Reference Pietinen, Hartman and Haapa11). The men completed the questionnaire twice: at the beginning and at the end of the pilot study. In the meantime, they kept food records for 24 d, spread over 6 months, thus providing the reference method. The energy-adjusted correlations between the dietary questionnaire and food records were 0·55 for total carbohydrates, 0·73 for starch, 0·50 for sucrose and 0·72 for dietary fibre.
Assigning glycaemic index values for foods of the dietary history questionnaire data
The foods reported by the subjects were encoded as the total number of 1097 foods. Thus, the subjects added 821 food items to the questionnaire in addition to the 276 structured foods already included. The GI values for foods were provided from the following sources: data from our own laboratory, publications reporting measured GI values, GI values from Sydney University published in the international table by Foster-Powell et al. (Reference Foster-Powell, Holt and Brand-Miller12), and GI values for some dairy products from a Finnish manufacturer (Valio Ltd, Helsinki, Finland) (see supplementary material).
The methodology of the GI analyses of our own laboratory followed the recommendations presented internationally(Reference Brouns, Björck and Frayn13, 14). The number of healthy subjects tested for each food was at least ten (except for carrot: the number of subjects was six for raw carrot and eight for cooked carrot). After overnight fasting, a finger-prick capillary blood sample was obtained followed by samples at 15, 30, 45, 60, 90 and 120 min after starting to eat the study food. Blood glucose was measured with a glucose meter(Reference Hätönen, Similä and Virtamo15). The incremental area under the curve was calculated with the trapezoidal method, ignoring the area beneath the fasting concentration(14). The reference glucose solution was tested at least twice for each subject(Reference Brouns, Björck and Frayn13, Reference Hätönen, Similä and Virtamo15). The ACHO content (sugars and available starch) of the foods was analysed with the exception of beer, where the ACHO content was based on information provided by the manufacturer (Oy Sinebrychoff Ab, Kerava, Finland).
Publications providing GI values were reviewed for the quality of the GI determinations. The minimum methodological criteria were set on the basis of internationally presented recommendations(Reference Brouns, Björck and Frayn13, 14). Adequate reporting on the methodology was required and the minimum criteria were as follows: (1) the reference food was glucose or white bread, (2) the amount of ACHO of the test and the reference foods was the same (50 or 25 g), (3) the subjects were not treated with insulin, and (4) the number of subjects was six or more. Description of studies utilized in assigning GI values is presented in the supplementary material.
Sydney University's method of GI measurement(Reference Foster-Powell, Holt and Brand-Miller12) has been described to be in line with the principles advocated by the FAO/WHO Expert Consultation(14). We obtained information from the manufacturer on the method used for the GI determination of the Finnish dairy products. The method was the same as presented by the Australian GI Symbol Program(16) and was in line with our methodological criteria.
The GI of a similar food was available for 130 foods. The foods were considered similar when the GI-tested food and the food consumed by the ATBC Study subjects was the same (e.g. sucrose, milk, fruits, rye porridge) or when there were no reasons to expect substantial differences between the GI values (e.g. wheat bread and wheat roll). If the GI was expected to be affected by processing (e.g. bread made of whole grains compared to bread made of milled flour), the assigned GI had to be based on foods similar to those commonly consumed in Finland. The GI from a related food was assigned to 360 foods; the related food was the most similar food for which the GI was available (e.g. the GI of strawberry was assigned to all berries and that of wheat bread to foods for which the ACHO consisted of wheat flour). The GI values for 412 composite foods were calculated as the weighted mean of the GI values of the ACHO-containing components(14). For foods that contained no or negligible amounts of ACHO (mainly protein or fat-containing foods, such as meat, inner organs, oil, hard cheese), the GI values were set to zero (n 195).
Generally, few reliable GI values existed for vegetables (excluding potatoes and legumes). Studies fulfilling our minimum methodological criteria provided GI values only for carrot (Sydney University's value (GI 32) for cooked carrot(Reference Foster-Powell, Holt and Brand-Miller12) and unpublished results from our laboratory for cooked carrot (GI 64) and for raw carrot (GI 39)). The values for raw and cooked carrot were used for raw and cooked roots, vegetables and mushrooms, respectively. Potatoes and legumes received their own GI values.
The GI was assigned relative to the glucose solution standard (the GI of glucose solution = 100). When GI values were tested with white bread as the reference food, the values were multiplied by a factor of 0·7(14). If more than one eligible GI was available for a given food, we assigned the mean of the GI values.
Calculation of the intake of nutrients and diet glycaemic index and glycaemic load
The nutrient intake and diet GI and GL were calculated using the food composition database and an in-house nutrient intake calculation software of the National Public Health Institute, Finland. The diet GL was calculated by summing the products of the ACHO amount of each food consumed multiplied by its GI and dividing by 100, and the diet GI by dividing the diet GL by the total amount of ACHO multiplied by 100(Reference Salmeron, Ascherio and Rimm2, Reference Wolever, Jenkins and Jenkins17, Reference Wolever, Nguyen and Chiasson18). We carried out the source analysis of diet GL by calculating the proportions of the ingredient groups contributing to diet GL.
Statistical analysis
The diet GL and the nutrient intake variables were log transformed and adjusted for energy intake with the residual method(Reference Willett and Stampfer19). Medians and interquartile ranges of diet GI and GL in baseline characteristic groups were calculated, and the median intake of energy, macronutrients and dietary fibre were calculated in the quintiles of diet GI and GL. The diet GI was not adjusted for energy, because it was not correlated with energy intake. The trends were tested with Cuzick's trend test(Reference Cuzick20). Spearman correlation coefficients were calculated.
Results
The mean ACHO intake of the ATBC subjects was 266 g daily (40·3 % of the total energy intake). Foods that contributed 90 % of the mean ACHO intake (n 66) appear in Table 1. Of these sixty-six foods, the GI of a similar food was available for forty foods (61 %), of which the GI values for twenty foods were analysed in our own laboratory. The GI from a related food was assigned to ten foods (15 %) and the GI was calculated for sixteen composite foods (24 %).
Table 1 Foods that contributed 90 % of the mean available carbohydrate (ACHO) intake among the Alpha-Tocopherol, Beta-Carotene Cancer Prevention Study subjects

The median diet GI was 67·3 (interquartile range 64·8–70·0). The GI was higher among younger subjects and those who engaged in light physical activity at leisure time, but the differences were small: only one unit at its peak (Table 2). The intakes of ACHO, protein and fat decreased and the intake of fibre increased, with increasing GI (Table 3).
Table 2 Diet glycaemic index (GI) and glycaemic load (GL) according to baseline characteristics in the Alpha-Tocopherol, Beta-Carotene Cancer Prevention Study (n 27 111)*
(Median values and interquartile ranges)
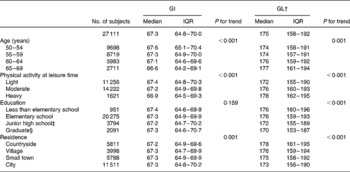
IQR, interquartile range.
* For details of subjects and procedures, see Materials and Methods. Diet GI and GL were calculated with glucose as the reference food.
† Diet GL adjusted for energy intake with the residual method.
‡ Partial or complete.
§ Including partial senior high school.
Table 3 Intake of energy, macronutrients and dietary fibre by quintiles (Q) of diet glycaemic index (GI) and of diet glycaemic load (GL) in the Alpha-Tocopherol, Beta-Carotene Cancer Prevention Study (n 27 111)*
(Median values)

* For details of subjects and procedures, see Materials and Methods. Diet GI and GL were calculated with glucose as the reference food.
† Spearman correlation coefficient.
‡ Diet GL and intake of nutrients adjusted for energy intake with the residual method.
The median energy-adjusted diet GL was 175 (interquartile range 158–192). The GL was positively associated with age, physical activity at leisure time and rural residence, and negatively with education (Table 2). The GL showed a positive correlation with intakes of ACHO and dietary fibre and a negative correlation with intakes of protein and fat (Table 3).
Ingredient sources of diet GL were as follows: half of the GL was derived from cereal products (24 % from wheat, 21 % from rye and 4 % from other cereals such as rice and oats), potatoes provided 14 %, sugar and sweets 12 %, milk products 7 %, fruits, berries, vegetables and roots altogether 6 % and the remaining ingredient groups provided smaller proportions.
Discussion
Epidemiological studies of nutritional exposures use food composition databases to convert food consumption data to nutrient intakes. One difficulty in developing GI databases has been the lack of GI values for foods, especially for local foods in many countries. Another problem has been the different methodological details used in GI testing studies. Different criteria in compiling the GI and GL database, or on the other hand, using the same GI values(Reference Foster-Powell, Holt and Brand-Miller12) in different populations with different diets, may partly explain the inconsistent findings of the epidemiological studies.
The availability of GI values measured for foods compatible with foods consumed by the subjects should be optimal in epidemiological studies, because many different food-related factors influence the GI value. For pumpernickel-type rye breads, for example, low GI values have been measured(Reference Foster-Powell, Holt and Brand-Miller12) whereas rye bread produced mainly from milled rye flour can have a higher GI value(Reference Hätönen, Similä and Virtamo15). Due to variation between brands and food-processing practices, the GI values of most foods used in epidemiological studies are at best only estimates of the actual GI values of foods. We were able to assign the GI from a similar food to 14 % (n 130) of the ACHO-containing foods (n 902) reported by the ATBC Study subjects. The GI of a similar food was, however, available for 61 % (n 40) of the foods that contributed 90 % of the mean ACHO intake (n 66) of the subjects.
In compiling our GI database, we included studies applying methods recommended internationally. A standard for a GI testing methodology was published by the WHO/FAO(14) and the methodology was recently discussed in greater detail by Brouns et al. (Reference Brouns, Björck and Frayn13). GI database studies published thus far have accepted published GI values with wider variability in the methodology(Reference Flood, Subar and Hull5–Reference Schakel, Schauer and Himes8).
Variation of the glycaemic responses is higher in individuals with type 1 diabetes than in individuals with type 2 diabetes or in healthy subjects(Reference Wolever, Jenkins and Josse21, Reference Wolever, Nuttall and Lee22). We excluded GI studies using subjects on insulin therapy to avoid variability due to the metabolic effect of insulin(Reference Heinemann, Weyer and Rauhaus23) and to observe as physiological a glycaemic response as possible.
According to the definition of GI, a basic requirement for a reliable GI measurement is that the amount of ACHO of the test food and of the reference food be the same. Thus we excluded studies testing different amounts of ACHO or studies that failed to report the amount of ACHO reliably. We excluded studies using foods other than glucose or white bread as the reference. This was due to the lack of calibration of these other references against glucose or white bread. We also excluded studies that added substantial amounts of additional sources of ACHO (e.g. milk) to the foods tested because of the possible confounding effect of the other ACHO source.
In addition to the minimum methodological criteria we set for the GI studies, other methodological factors exist(Reference Brouns, Björck and Frayn13, 14) that could provide more accurate GI values. For example, repeating the reference food measurement and using the capillary blood samples rather than the venous samples could improve the accuracy of the GI values(Reference Hätönen, Similä and Virtamo15). The number of subjects has been recommended to be at least six(14) and later at least ten(Reference Brouns, Björck and Frayn13). Furthermore, it has been recommended analysing with accurate analytical methods the ACHO content of foods(Reference Brouns, Björck and Frayn13). Many studies, however, have relied on information from tables or manufacturers when calculating the amount of food needed to obtain 50 g ACHO. However, to require all recommended factors would have excessively limited the number of acceptable GI studies. On the other hand, many of the GI values included in the database were assigned from studies considering more methodological issues than were our minimum criteria. Thus far, identifying which factors in GI determination should really be controlled and which may be optional has seen little study(Reference Wolever, Brand-Miller and Abernethy24).
Very few proper GI values have been published for vegetables (excluding potatoes and legumes). Vegetables commonly consumed in Finland (e.g. tomato, onion, cucumber) have a low ACHO content, 1–5 g/100 g(25), making GI determination problematic. It is difficult to eat enough vegetable to account for 50 g, or even 25 g, ACHO. Most commonly consumed roots in Finland (e.g. carrot, swede, beetroot) contain slightly more ACHO, 4–7 g/100 g(25), thus enabling GI determination with a 25 g ACHO portion. It has been suggested that the dose of ACHO in determining GI should be at least 25 g, because with very small amounts of ACHO, GI cannot be measured accurately(Reference Brouns, Björck and Frayn13, Reference Wolever, Gibbs and Spolar26). We used the GI value of raw carrot for all raw vegetables and the value of cooked carrot for all cooked vegetables (excluding potatoes and legumes). These were the most similar foods for which the GI measurement met our minimum quality criteria. Among the ATBC Study subjects, roots and vegetables contributed only a minor portion to the mean ACHO intake and to the diet GL (1·2 %). When studying populations that consume more vegetables with a higher ACHO content, more attention should be paid to the GI values of those vegetables.
The diet GI among the ATBC Study subjects was higher than that in other studies with subjects of the same gender and age(Reference Salmeron, Ascherio and Rimm2, Reference Flood, Peters and Jenkins27). One reason for this may be the low consumption of low-GI foods such as fruits and legumes and the high consumption of high-GI foods such as potato, cereals (prepared mainly from milled flour) and beer(Reference Ovaskainen28). Another reason may be the higher GI values measured for some foods consumed in Finland(Reference Hätönen, Similä and Virtamo15), compared to GI values published elsewhere(Reference Foster-Powell, Holt and Brand-Miller12). The diet GL also seemed to be higher than in the other studies(Reference Salmeron, Ascherio and Rimm2, Reference Flood, Peters and Jenkins27). By definition, diet GL depends on the diet GI and intake of ACHO. The total intake of ACHO in the ATBC Study may be a slight overestimation since the dietary history questionnaire has been shown to overestimate some nutrient intakes(Reference Pietinen, Hartman and Haapa11). The ACHO intake as an energy-percentage was, however, only 40·3 %.
The present findings on the positive associations of diet GL with age and physical activity and negative association with education were in line with findings published earlier(Reference Levitan, Mittleman and Håkansson29, Reference Mosdol, Witte and Frost30). Similarly were the positive associations of diet GL with the intake of carbohydrates and dietary fibre and the negative associations with the intake of protein and fat. The negative association of diet GI with the intake of carbohydrates and the positive association of diet GI with the intake of fibre differed from previous findings(Reference Mosdol, Witte and Frost30). The decreasing consumption of some carbohydrate-containing foods with no fibre, e.g. milk and sugar, and the increasing consumption of fibre-rich rye with increasing diet GI explain these associations.
Use of the GI concept in the epidemiological studies is not, however, without criticism(Reference Pi-Sunyer31). Researchers have studied and debated whether the GI values of individual foods can serve to estimate glycaemic responses to mixed meals because of the confounding effects of fat and protein(Reference Brand-Miller and Wolever32–Reference Wolever, Yang and Zeng34). Fat and protein do affect glycaemic responses, but carbohydrate content and the GI have been shown to account for 90 % of the variation in glycaemic responses to mixed meals(Reference Wolever, Yang and Zeng34). The aim of the diet GI and GL in epidemiological research is not to predict absolute blood glucose concentrations, but the diet GI and GL should be viewed as describing the blood glucose-raising potential of the carbohydrates in the diet. And thus when viewed as a possible risk factor for diseases the diet GI and GL could be considered as indicators of the blood glucose-raising burden of diet.
We conclude that available GI studies fulfilling the minimum methodological requirements cover a sufficient amount of foods for the compilation of a meaningful GI database for epidemiological study. This, however, requires that GI values be available for relevant local foods containing carbohydrates. The findings of epidemiological GI studies will become more reliable as more GI values become available for different foods determined with a standard methodology.
The supplementary material for this article can be found at journals.cambridge.org/bjn
Acknowledgements
We thank Valio Ltd (Helsinki, Finland) and Oy Sinebrychoff Ab (Kerava, Finland) for providing information on their products. The work was supported by the Academy of Finland (111420), the Ministry of Agriculture and Forestry, the Finnish Cultural Foundation, the Juho Vainio Foundation and the Yrjö Jahnsson Foundation. The ATBC Study was supported by US Public Health Service contracts (N01-CN-45 165, N01-RC-45 035, N01-RC-37 004) from the National Cancer Institute. M. E. S., L. M. V. and J. V. contributed to the conception and design of this study. M. E. S. carried out, in cooperation with L. M. V. and J. V., the evaluation and assignment of the GI values. K. A. H., M. E. S., L. M. V. and J. V. contributed to the GI studies of Finnish foods required for the GI database. M. J. V. carried out the calculation of the diet GI and GL of the ATBC subjects and M. J. V. and M. E. S. carried out the statistical analysis. M. E. S wrote the manuscript and all authors commented on the manuscript. The authors had no personal or financial conflict of interest.


