


Type 2 diabetes is a chronic endocrine disease characterised by high blood sugar (hyperglycaemia), insulin resistance and relative lack of insulin. Due to the existence of severe side effects for available anti-diabetic drugs, natural products have been considered as effective strategies and alternative medicine for diabetes management(Reference Lee, Min and Han1). It is documented that tea and tea extracts have protective effects against diabetes by regulating various signalling pathways, including immunity enhancement and alleviating diabetes-induced damages of neural cells. Roghani & Baluchnejadmojarad(Reference Roghani and Baluchnejadmojarad2) showed that lower glucose intolerance and higher insulin sensitivity were observed in pre-diabetic rats drinking white tea for 2 months. Islam(Reference Islam3) reported that white tea extract can exhibit anti-diabetic activity by reducing insulin resistance, followed by hyperlipidaemia and oxidative stress. Welch et al. (Reference Welch, Zhen and Bass4) investigated the glucose-lowering activities of the bioactive polyphenols in kinkeliba tea (Combretum micranthum) by decreasing the expression of phosphoenolpyruvate carboxykinase mRNA and increasing glucose tolerance.
It is noted that the studies on anti-diabetic ingredients in tea and their extracts were mainly involved in polyphenols(Reference Fu, Li and Lin5) or polysaccharides(Reference Chen, Chen and Chen6); the glucose-lowering effect of tea-derived protein extract was rarely studied. In the previous study, the hypoglycaemic activity of the protein extract from dark tea (fermented tea) Heimaojian (HMJ) was investigated in vitro (Reference Su, Mao and Ai7). The results showed that the protein extract had potent enzyme inhibition activities, with IC50 (mg/ml) values of 0·0942 (sd 0·0023) and 0·1794 (sd 0·0204) for α-glucosidase and dipeptidyl peptidase, respectively. Moreover, the active peptides were identified from dark tea protein extract (DTPE), for example, TAELLPR, CGKKFVR, AVPANLVDLNVPALLK, VVDLVFFAAAK, MSLYPR and QGQELLPSDFK(Reference Zhao, Su and Mao8). However, the in vivo activity and the underlying mechanism were not studied. The aim of this study was to investigate the glucose-lowering effects of HMJ protein extract on the spleen–brain axis in alloxan-induced diabetic mice, and the acting mechanism was explored by RNA sequencing (RNA-Seq)-based transcriptomics.
Materials and methods
Materials
Alloxan was purchased from Sigma Chemical Co. Metformin was from Yuanye Biotechnology Co. Ltd. The DTPE from HMJ was prepared in our laboratory(Reference Su, Mao and Ai7). Briefly, the milled (20 mesh) HMJ leaves were extracted in ultrapure water bath for 30 min at 95°C, filtrated and concentrated to obtain the extracts, and the solution was subjected to dialysis (500 Da). Then, 5 % (w/v) activated carbon was added at 45°C for 30 min. After filtration, saturated ammonia sulphate solution was added to precipitate the protein at 4°C for 12 h, centrifuged at 6000 g for 20 min at 4°C and dialysed at room temperature for 24 h to eliminate micro-molecules.
Characterisation of dark tea protein extract
Amino acid composition of DTPE was assayed by an automatic amino acid analyzer (L-8900, Hitach Co. Ltd). Molecular weight distribution of DTPE was measured by gel permeation chromatography (Water Breeze, Waters). The main peptides of DTPE were characterised previously(Reference Zhao, Su and Mao8).
Animal experiment
Sixty SPF C57BL/6 male mice (8 weeks old, weighing about 22·4 (sd 3) g) were purchased from Jinan Pengyue experimental animal breeding Co. Ltd. and inspected by the Institute of medical experimental animals, Chinese Academy of Medical Sciences, license no. SCXK 2014 0007; feeding environment: temperature: 25°C, humidity: 60 %, light conditions: 12 h light–12 h dark alternately. During the experiment, the mice drank and ate freely and kept the living environment clean; the bedding was dry and sanitary, ventilated regularly and changed every day. After 1 week of adaptive feeding, mice were randomly divided into six groups. In order to examine the effects of DTPE on normal mice, the control (normal) group (0·9 % saline) and DTPE (100 mg/kg per d) + control group are set; other four groups include: model group (diabetic mice group, 0·9 % saline), low-dose DTPE (50 mg/kg per d) + model group, high-dose DTPE (100 mg/kg per d) + model group and positive drug (metformin, 125 mg/kg per d) + model group. Each group has ten mice, every five mice in a cage, with normal drinking and eating. The mice in the last four groups were unable to drink water for 6 h after fasting. After intravenous injection of alloxan (200 mg/kg per d, solved in citric acid–sodium citrate buffer (pH 4·5)) prepared with normal saline, the mice resumed eating and drinking water. After fasting for 6 h on the third day after injection, blood was collected from the tail tip and blood glucose was measured with a blood glucose meter. The diabetic model was successfully established with the blood glucose >11·1 mmol/l.
Subsequently, continuous administration by gavage was performed for 21 d (once per d in the afternoon, 0·2 ml of the gavage volume): 0·9 % saline for control (normal) group, HMJ protein extract (100 mg/kg per d) for DTPE + control group, 0·9 % saline for model group, HMJ protein extract (50 mg/kg per d) for low-dose DTPE + model group, HMJ protein extract (100 mg/kg per d) for high-dose DTPE + model group and metformin (125 mg/kg per d) for positive drug (metformin) + model group. During the experiment, the mice were fed with normal drinking water and their body weight and fasting blood glucose were recorded on the 5th, 7th and 14th day of the administration (fasting for 6 h before measurement). After 3 weeks of continuous administration, the mice were fasted for 12 h, weighed and killed. Five mice in each group of the model group and high-dose administration group were selected, and their brains and spleen were quickly removed. The extracted tissues were washed in normal saline, placed in a centrifuge tube, temporarily stored in dry ice and then transferred to a refrigerator at –80°C for further use.
Determination of glucose tolerance
The mice were fasted for 12 h before administration on the 21st day and then given 2·5 g/kg glucose by gavage after 3 h of administration. The blood glucose was detected by blood glucose detector at 0, 0·5, 1·0 and 2·0 h after administration.
RNA sequencing and bioinformatics analysis
Three biological replicates were used for all RNA-Seq experiments from each treatment. Total RNA were extracted using TRIzol® reagent (Invitrogen Life Technologies). RNA quality was assessed via agarose gel electrophoresis and NanoDrop 2000 Spectrophotometer (Thermo Fisher Scientific). RNA integrity number was measured using the Agilent 2100 TapeStation system (Agilent Technologies). Libraries for RNA-Seq were prepared with a TruSeq® RNA LT/HT Sample Prep Kit according to the instructions of the manufacturer (Illumina). RNA-Seq was performed on an Illumina HiSeq 2500 with 2 × 100-bp paired-end reads. Quality trimming removed low-quality and ambiguous nucleotides of sequence ends and adapter contamination. The gene expression abundance was normalised by FPKM (fragments per kilobase of exon per million fragments mapped), and differentially expressed genes were analysed by Cufflinks software(Reference Trapnell, Roberts and Goff9), with the threshold log2(fold change) >1 and q-value <0·05 as the criteria of significant difference.
Gene ontology and gene enrichment analysis were conducted by a PLAZA web tool (http://bioinformatics.psb.ugent.be/plaza/). The pathways that showed the most differentially expressed genes were annotated using the Kyoto Encyclopedia of Genes and Genomes (KEGG) database (http://www.genome.jp/kegg/). The interaction networks of differentially expressed genes were obtained using the STRING version 10 database (http://string-db.org/).
Real-time quantitative PCR verification
To verify the transcriptomic findings, seven genes related to glucose regulation and metabolism were selected for quantitative PCR (qPCR) analysis. The primers for mRNA were designed and synthesised by Sangon Biotech (China). Rpl15: Rpl15-F, GTAAACGCCCAGTTCCTAA, Rpl15-R, AATCTTCA CCAACCCAGTAG; Srebf2: Srebf2-F, TCGACGAGATGCTACAGTTTG, Srebf2-R, TGGGACCTGGCTGA-ATGA; Gdpd2: Gdpd2-F, GGCAGGAGTGGCATAGTTT, Gdpd2-R, AGCAGC-GGCATCAGGTAG; Pgam2: Pgam2-F, CAACTACTACACCTCCATC-AGC, Pgam2-R, TCATTCCAGAAGGGCAAA; Igfbp4: Igfbp4-F, GCCTCACAGAG-CCGTACCCA, Igfbp4-R, CCCTGTCTTCCGATCCACA; Snca: Snca-F, TTGTCA-AGAAGGACCAGAT, Snca-R, GCATTTCATAAGCCTCACT; Hs3st4: Hs3st4-F, AGGCTATCCGAGTCCACCC, Hs3st4-R, ATCTGCCCATCCAATGTCTT; β-actin: β-actin-F, AGCCATGTACGTAGCCATCC, β-actin-R, CTCTCAGCTGTGGTG-GTGAA. The cDNA synthesis was performed by the HiScript® Q RT SuperMix for qPCR (+gDNA wiper) according to products manuals (Takara Biotechnology). Then, qPCR measurement was conducted on a CFX Touch™ Real-Time PCR Detection System (Bio-Rad) with ChamQ SYBR qPCR Master Mix (Takara Biotechnology Co. Ltd). The β-actin gene was used as a reference, and the fold change was quantified by the 2−ΔΔCt method.
Statistical analysis
SPSS 19.0 software was used for one-way ANOVA, and Duncan’s model was used to analyse the significant differences between different samples. The results are expressed as means and standard deviations, and P < 0·05 was considered to be significant.
Results
Amino acid composition and molecular weight distribution
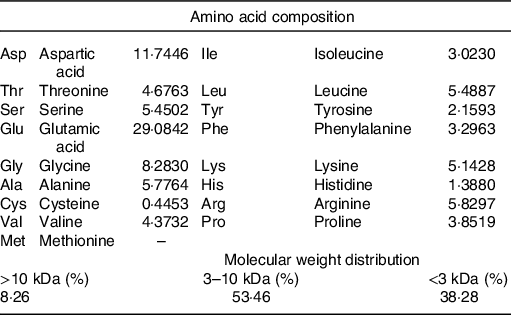
The DTPE from HMJ was prepared in our laboratory(Reference Su, Mao and Ai7). The amino acid composition indicated that the top two high contents of amino acids were glutamic acid and aspartic acid, and basically no methionine. The molecular weight distribution showed that small molecular compounds were above 90 % (Table 1).
Table 1. Amino acid composition of dark tea protein extract
Effect on body weight
The effects of DTPE on the weights of alloxan-induced hyperglycaemic mice are shown in Table 2. The growth rate of body weight in the model group was obviously slower than that in the normal control group, which was one of the typical symptoms of type 2 diabetes. The body weight growth rate of the control group fed with DTPE was slower than that of the normal control group, and the body weight growth rates of the high-dose group and the low-dose group were slower than that of the model group, which indicated that DTPE could inhibit the weight growth, although no obvious dose dependence was observed.
Table 2. Changes of body weight, fasting blood glucose and glucose tolerance in mice
(Mean values and standard deviations; percentages)
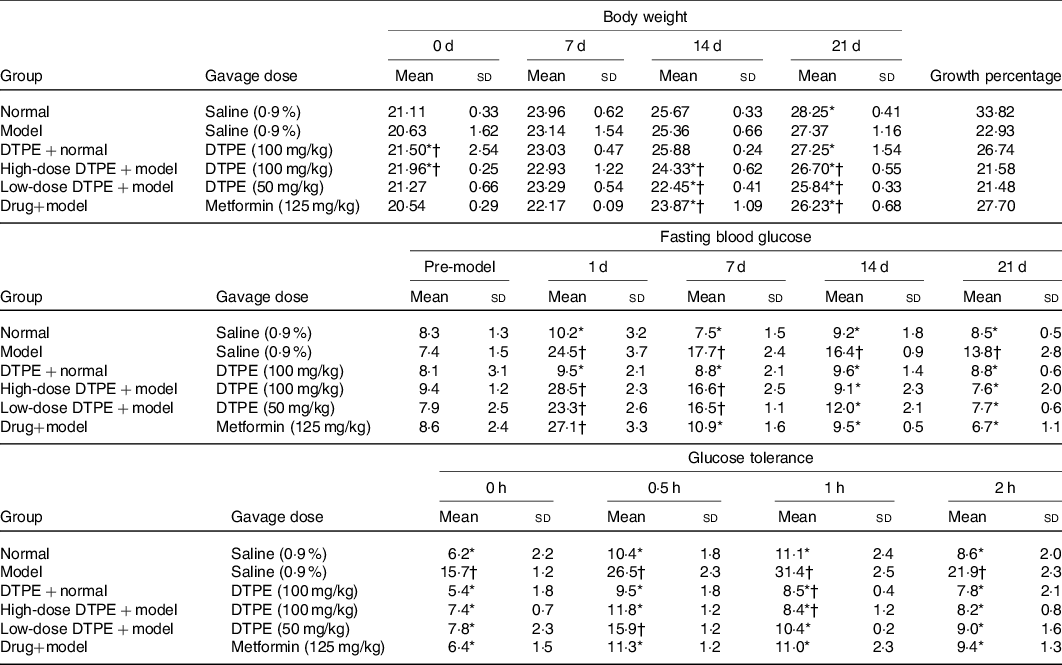
DTPE, dark tea protein extract.
* Significant (P < 0·05) compared with the model group.
† Significant (P < 0·05) compared with the normal group.
Effect on fasting blood glucose
The fasting blood glucose assay (Table 2) showed that after 21 d of experiment, the fasting blood glucose values in the high-dose DTPE + model group and the low-dose DTPE + model group were significantly different from that of the model group (P < 0·05), and there was also significant difference between the model group and the control group (P < 0·05). Moreover, there was no significant difference in the fasting blood glucose values between the DTPE + control group and the control group, indicating that proper administration of DTPE had no significant effect on the fasting blood glucose of normal mice. On the other hand, the decrease of fasting blood glucose in the low-dose DTPE + model group was smaller than that in the high-dose DTPE + model group, which reflected a certain dose relationship between blood glucose level and DTPE concentration. In particular, compared with the initial value, the fasting blood glucose values at day 21 were decreased by 67 % (23·3 v. 7·7 mmol/l), 73·3 % (28·5 v. 7·6 mmol/l) and 75·3 % (27·1 v. 6·7 mmol/l) for low-dose DTPE, high-dose DTPE and drug metformin groups, respectively. Compared with model group, at day 21, the fasting blood glucose values were decreased by 44·9 % (13·8 v. 7·6 mmol/l) and 51·4 % (13·8 v. 6·7 mmol/l) for high-dose DTPE and drug metformin groups, respectively. Notably, the used doses for the high-dose DTPE and drug metformin groups were 100 mg/kg and 125 mg/kg, respectively; this hints that the smaller dose of DTPE achieved similar glucose-lowering results to the drug metformin.
Changes in glucose tolerance
The changes of glucose tolerance in hyperglycaemic mice are shown in Table 2. At the beginning (0 h), except for the model group, there was no significant difference in blood glucose values among the groups. In the period of time (0·5–2 h), the DTPE groups exhibited an obvious trend to improve glucose tolerance and the blood glucose in the high-dose DTPE group was even better than that in the drug metformin group. Within 0–2 h, the blood glucose in the high- and low-dose DTPE groups was significantly lower than that in the model group, suggesting that the intake of DTPE was really helpful for the regulation of glucose tolerance in hyperglycaemic mice. Similarly, in the duration of 0–2 h, the blood glucose values in the normal control group were lower than those in the DTPE + normal control group; specially, at the time point of 1 h, the difference was significant (11·1 v. 8·5 mmol/l), hinting that the intake of DTPE in normal mice was also good for controlling the rise of blood glucose after eating.
RNA-sequencing analysis
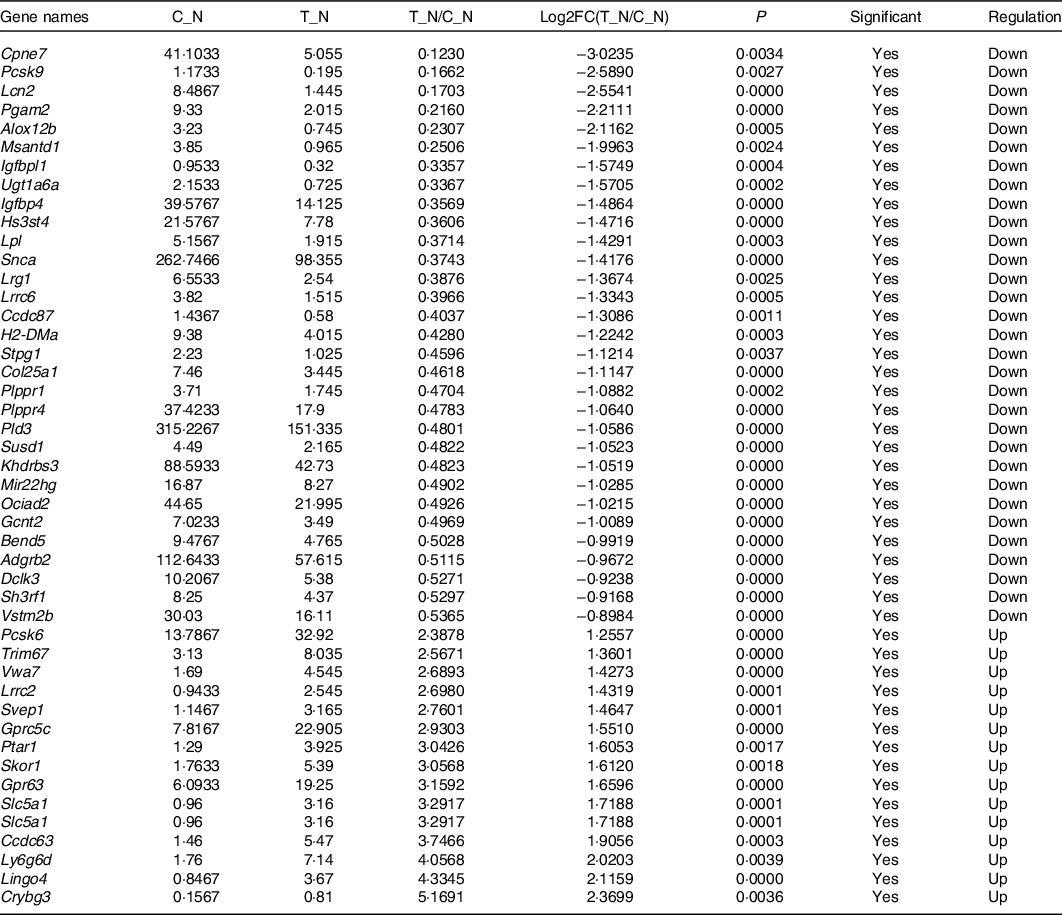
In order to explore the glucose-lowering mechanism of DTPE in diabetic mice, RNA-Seq was performed in spleen and brain tissues of mice. Totally, 51 912 genes were detected in spleen or brain tissues, 175 or 514 of which had significant difference in expression for spleen or brain tissues, respectively. In particular, fifty-two spleen-derived or forty-seven brain-derived genes related to the synthesis, secretion, transport, metabolism and regeneration of sugars were screened out from all differentially expressed genes (Tables 3 and 4). For spleen tissue, twenty-eight genes were up-regulated, such as Rnasek (30·28-fold), Anp32b (32·67-fold), mt-Cytb (34·68-fold), Rps13-ps1 (39·03-fold) and Col19a1 (44·74-fold); and twenty-four genes were down-regulated, for instance, Try5 (−63·69-fold), Try4 (−42·92-fold), Clps (−13·64-fold) and Gp2 (−11·93-fold). For brain tissues, fifteen genes were up-regulated and thirty-two genes were down-regulated, for example, Ly6g6d (4·06-fold), Lingo4 (4·33-fold), Crybg3 (5·17-fold); Cpne7 (−8·13-fold), Pcsk9 (−6·02-fold) and Lcn2 (−5·87-fold). Thus, DTPE caused more remarkable changes in spleen than in brain, although more differential genes were observed in brain than in spleen.
Table 3. Differential genes in spleen
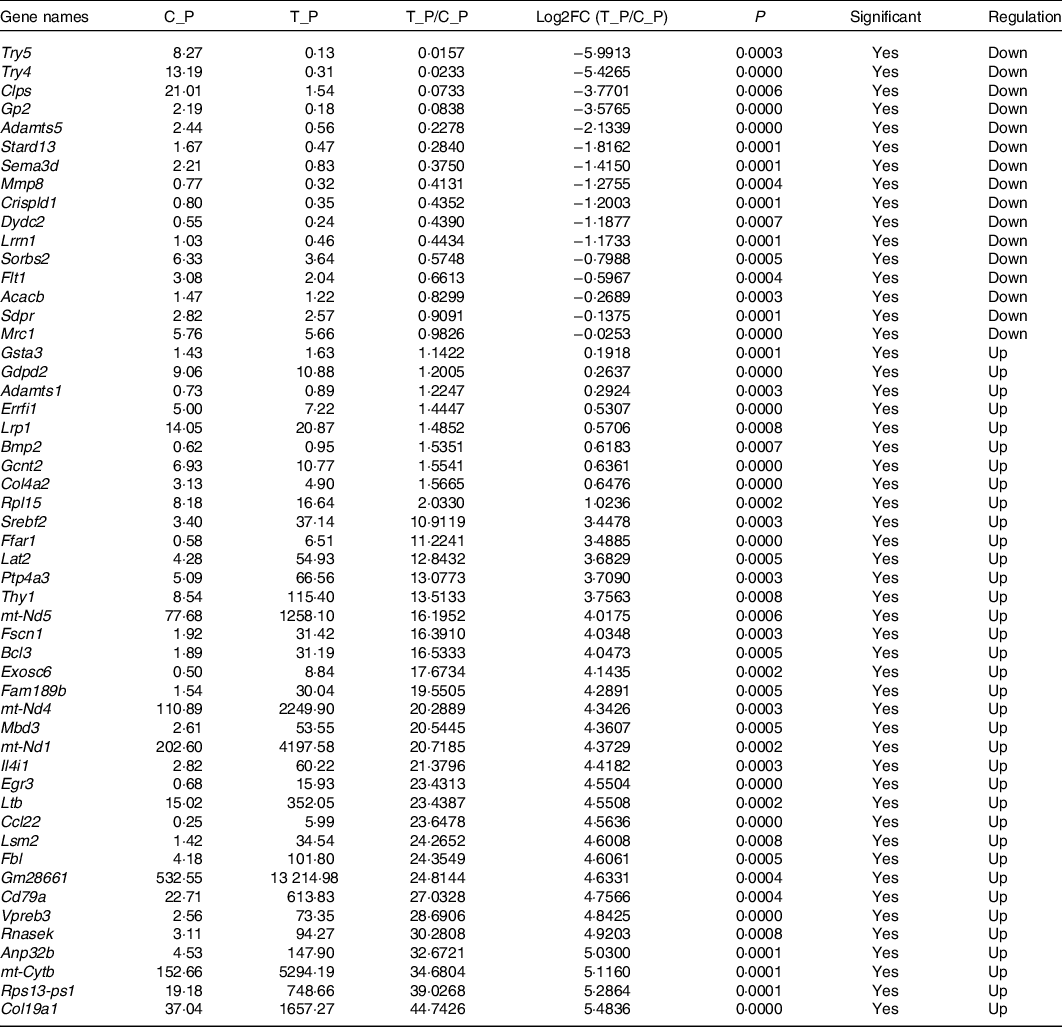
Table 4. Differential genes in brain
Gene ontology enrichment and Kyoto Encyclopedia of Genes and Genomes pathway analyses
Gene ontology enrichment analysis of differential genes in spleen presented that the most significantly enriched functions or processes (P < 0·001) were cell surface receptor signalling pathway, regulation of multi-cellular organismal development and regulation of developmental process for spleen. Kyoto Encyclopedia of Genes and Genomes pathway analysis indicated that the differential genes were mainly involved in human disease pathway, biological system pathway, metabolic pathway and environmental information processing pathway. In the biological system, genes with significant differences were closely related to immune system, digestive system and endocrine system (Fig. 1(a)). Similarly, for brain, many functions or processes were significantly enriched (P < 0·001), primarily related to signalling (single organism signalling, anterograde trans-synaptic signalling, synaptic signalling, cell–cell signalling) and channel activity (ion channel activity, cation channel activity, substrate-specific channel activity). Kyoto Encyclopedia of Genes and Genomes pathway analysis showed similar results to spleen, and in the biological system, the differential genes were closely related to the immune system, digestive system and circulatory system (Fig. 1(b)).
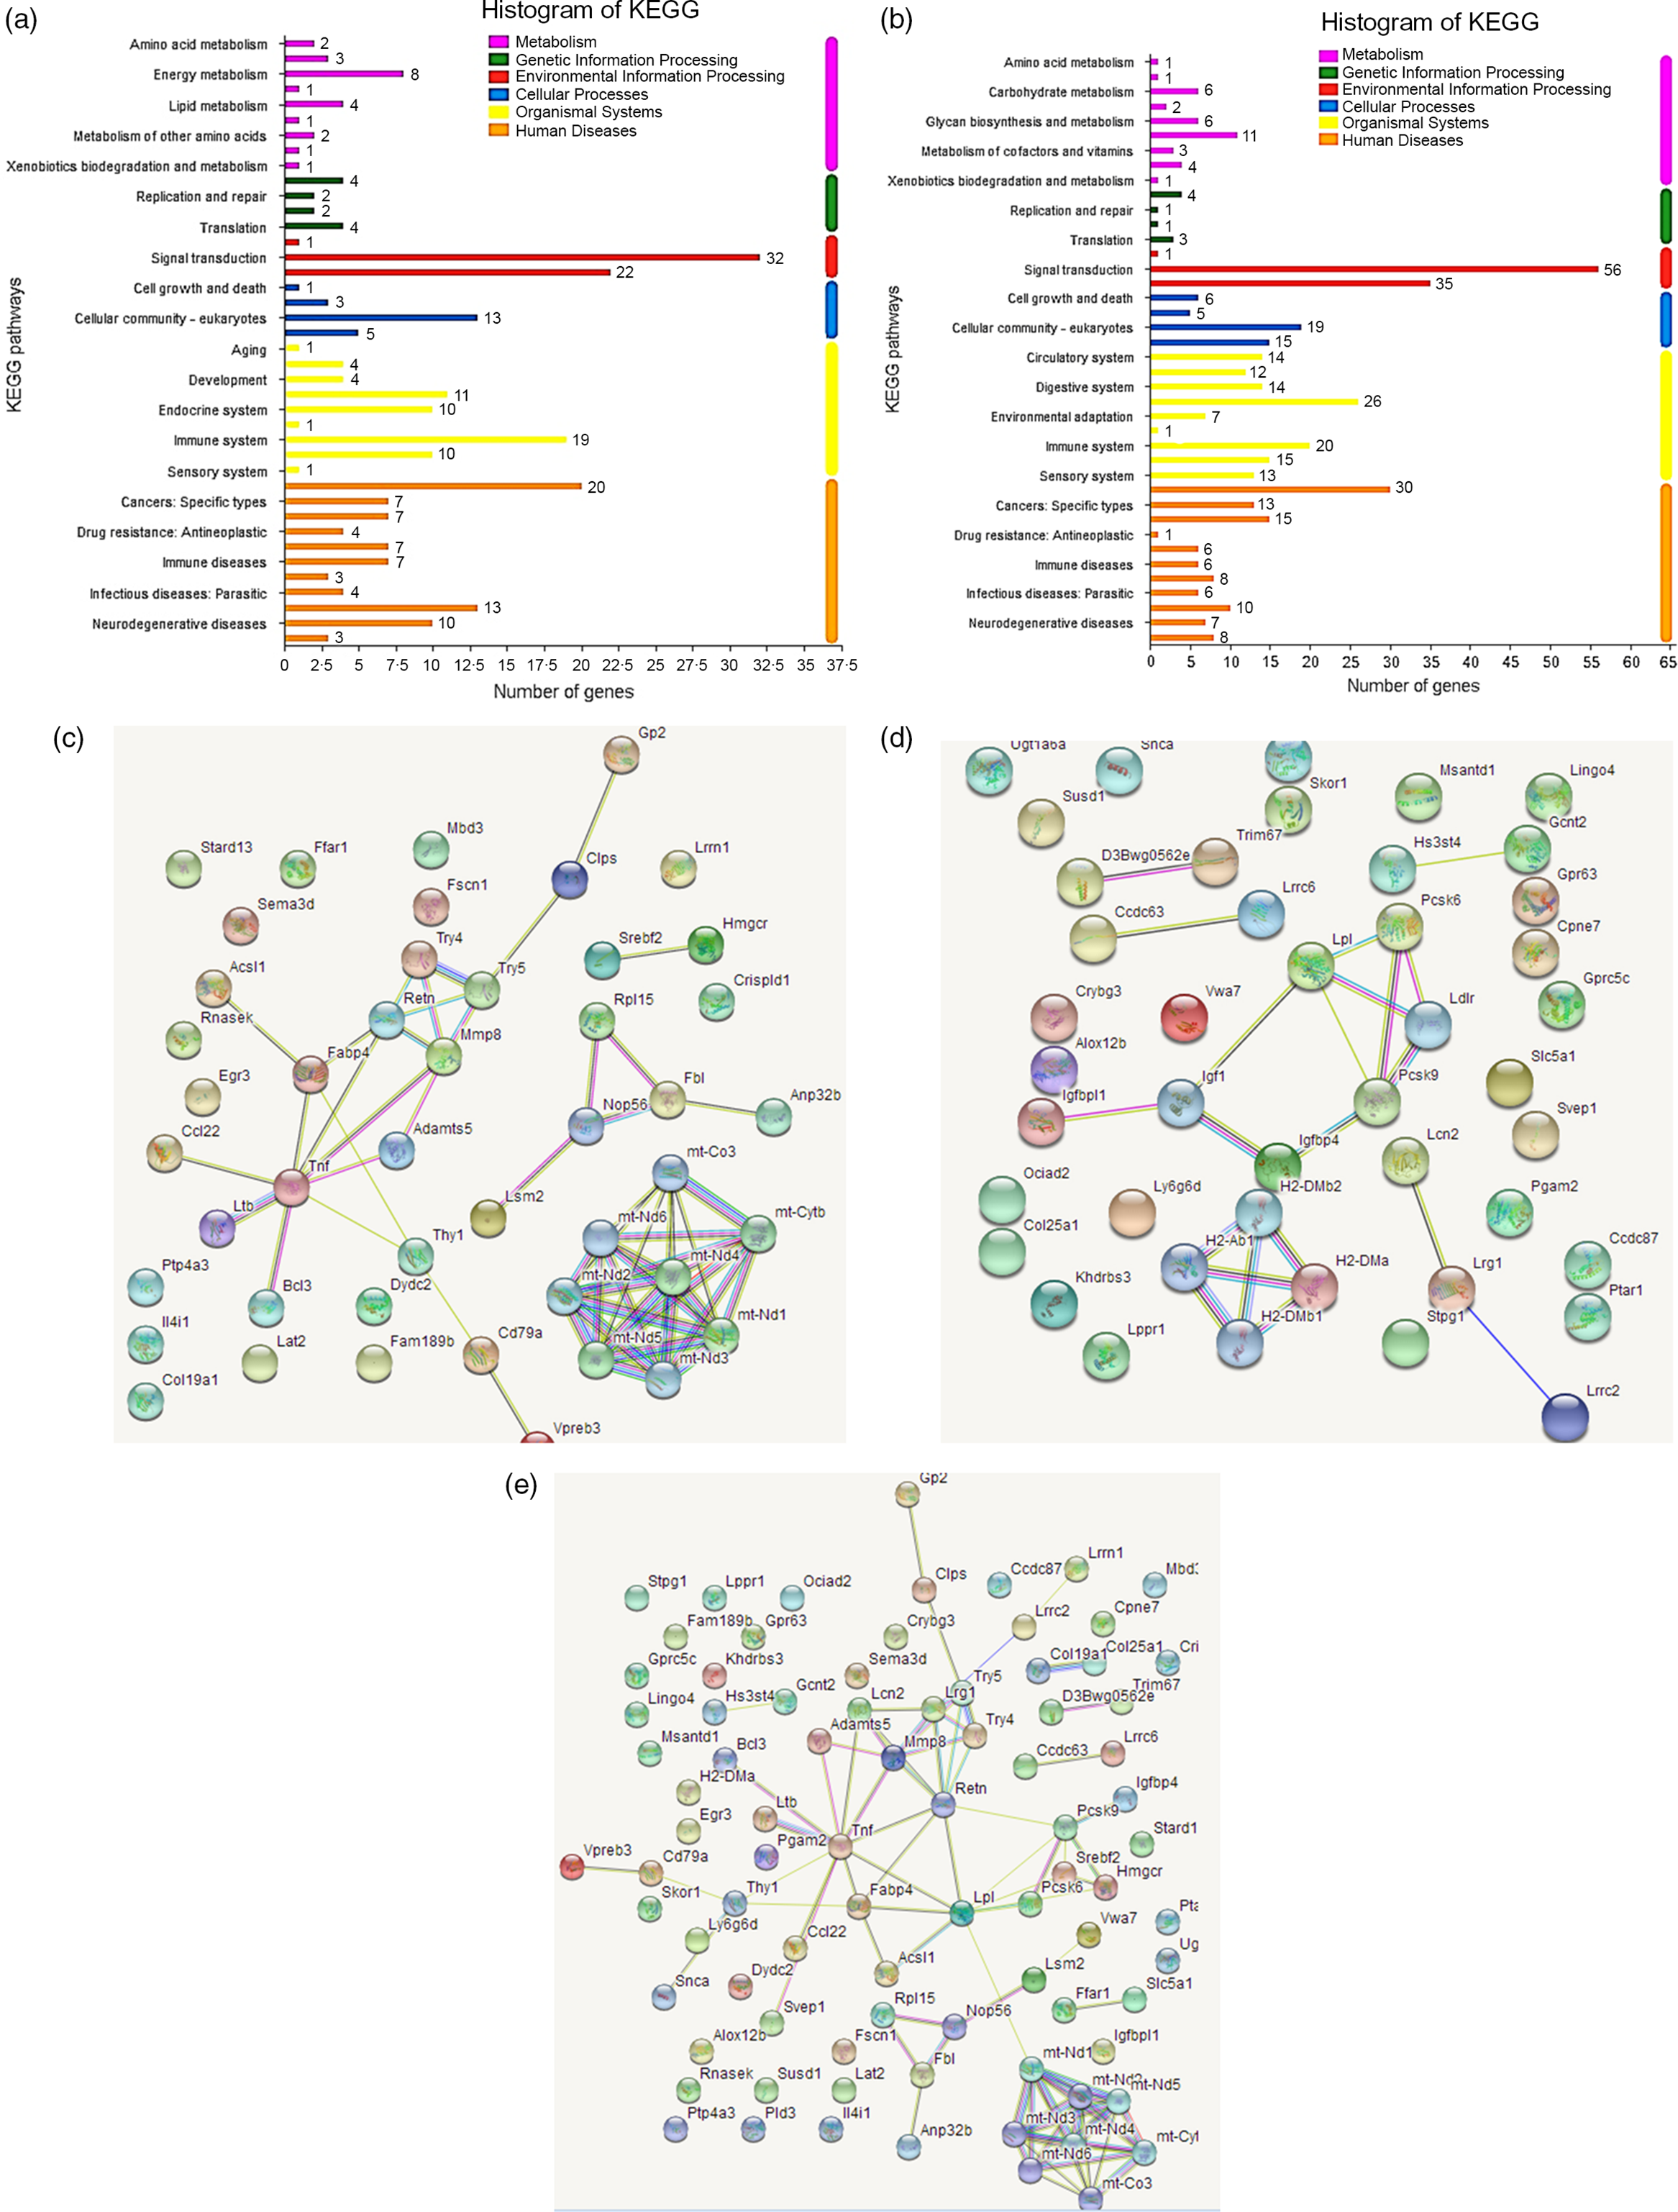
Fig. 1. Kyoto Encyclopedia of Genes and Genomes (KEGG) pathway diagrams of differentially expressed genes in spleen (a) and brain (b). Interacting networks of differentially expressed genes in spleen (c), brain (d), both spleen and brain (e).
Interacting network analysis
Network analysis demonstrated that the differential genes in spleen were primarily mapped into two sub-networks (Fig. 1(c)): eight-gene sub-network (Mt-Co3, mt-Cytb, mt-Nd1, mt-Nd2, mt-Nd3, mt-Nd4, mt-Nd5, mt-Nd6) related to Parkinson’s disease, thermogenesis, oxidative phosphorylation and metabolic pathways, and sixteen-gene sub-network (Gp2, Clps, Try5, Try4, Retn, Mmp8, Adamts5, Fabp4, Acsl1, Tnf, Ccl22, Ltb, Bcl3, Dydc2, Cd79a, Vpreb3) related to metabolism and degradation of the extracellular matrix. The differential genes in brain were primarily mapped into two sub-networks (Fig. 1(d)): four-gene sub-network (H2-DMb2, H2-DMa, H2-Ab1, H2DMb1) related to type 1 diabetes mellitus and intestinal immune network for IgA production, and seven-gene sub-network (Pcsk6, Lpl, Ldlr, Pcsk9, Igfbp4, Igf1, Igfbpl1) related to regulation of insulin-like growth factor transport and uptake, and plasma lipoprotein assembly, remodelling and clearance. Interestingly, all the differential genes in spleen and brain were primarily mapped into a big thirty-seven-gene sub-network (Fig. 1(e)) related to metabolism, Parkinson’s disease, oxidative phosphorylation and thermogenesis.
Verification of selected genes by quantitative PCR
Finally, among the genes with significant difference in expression, the genes with high expression and high correlation with glucose metabolism and fat metabolism were selected and verified by qPCR. Seven target genes were screened out, including three genes from spleen: Rpl15, Srebf2, Gdpd2; four genes from brain: Pgam2, Igfbp4, Snca, Hs3st4; and β-actin was the reference gene. Fig. 2 indicates that among the seven target genes, four genes had the same variation trend: Rpl15, Gdpd2, Igfbp4, Snca.
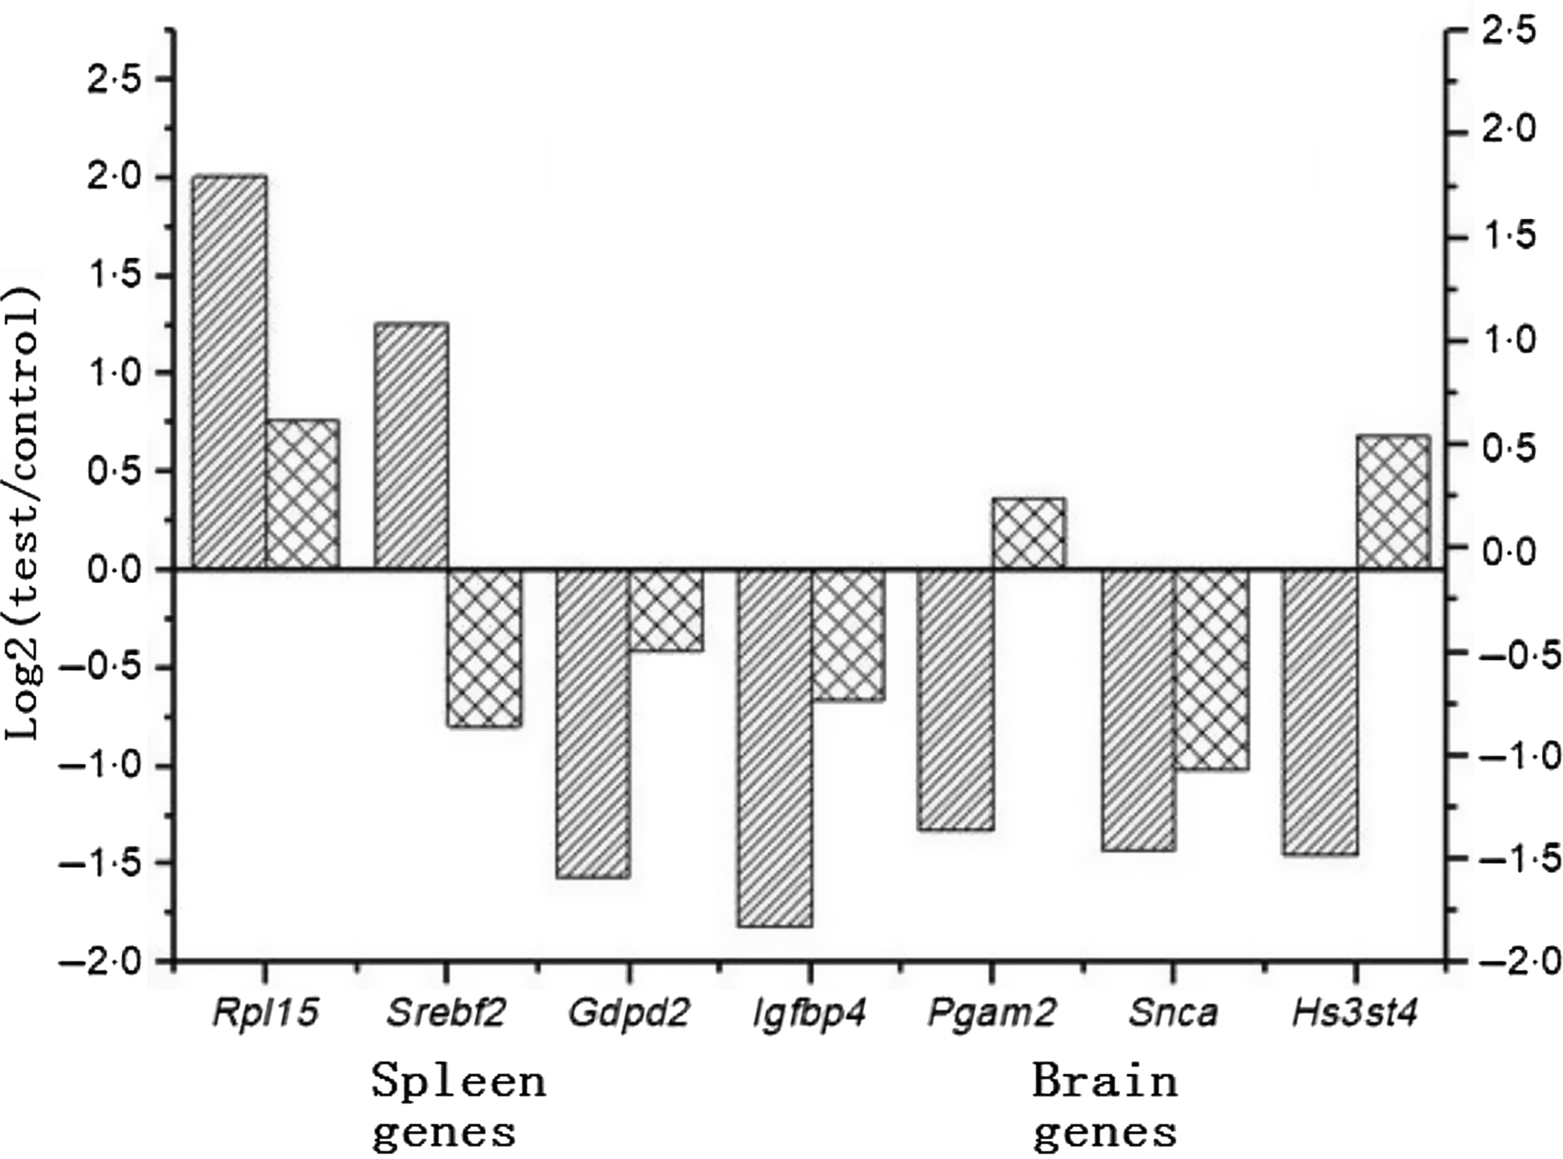
Fig. 2. Comparison between RNA sequencing (RNA-Seq, ![]() ) and quantitative PCR (
) and quantitative PCR (![]() ) for the expressions of seven genes.
) for the expressions of seven genes.
Discussion
Plants are considered as one of the best sources of diabetic therapy. An increasing number of studies have demonstrated that plants and their extracts are hypoglycaemic agents. In our study, the DTPE from HMJ reduced by 44·9 % of blood glucose at 100 mg/kg, which was close to the drug metformin that reduced by 51·4 % at 125 mg/kg, after 21 d of administration to diabetic mice. Previous studies indicated that Annona muricata aqueous extract (100 mg/kg) could significantly reduce by 72·6 % of blood glucose level on day 21(Reference Florence, Benoit and Jonas10). The aqueous extract of Fagonia cretica caused a 45 % decrease in the plasma glucose level at the end of the experimental period (21 d) with the dose of 500 mg/kg(Reference Nazir, Ur Rahman and Alvi11). Sarcostemma brevistigma extract (250 mg/kg) was found to reduce by 17·9 % blood glucose at day 21(Reference Vijayalakshmi and Selvaraj12). Green tea consumption (2 g/kg) reduced 14·3 % of blood glucose in 21 d of diabetic rats(Reference Ueda-Wakagi, Nagayasu and Yamashita13). After being intragastrically administered with 100 mg/kg of Fuzhuan Brick-Tea extract for 4 weeks, 33 % of the serum glucose levels of diabetic mice were reduced(Reference Xiang, Xiang and Jin14). This means that 5-fold lower dose of DTPE achieved similar result to F. cretica extract; 2-fold lower dose of DTPE achieved 2-fold higher glucose-lowering effect than S. brevistigma extract; while the same dose of DTPE generated smaller effect than A. muricata extract, but compared with their initial values, DTPE possessed similar result to A. muricata extract, which reduced by 73·3 % and 73·8 % of blood glucose at day 21 with the dose of 100 mg/kg, respectively. Compared with tea or tea extract, DTPE is similar to Fuzhuan Brick-Tea extract, but much more potent than green tea.
Recently, the role of the gut–brain axis in the management of many diseases has been the focus of much research activity. However, although a few studies reported the effect of plant extracts on microbiota (not gut–brain axis) in the diabetic animal model(Reference Zhao, Guo and Lu15), the anti-diabetic effects of plant extracts based on the gut–brain axis were rarely explored. Duca et al. (Reference Duca, Côté and Rasmussen16) indicated that the widely used drug metformin was shown to suppress glucose production through the gut–brain axis. Xu et al. (Reference Xu, Yang and Negishi17) demonstrated that silibinin, the pre-dominant component of silymarin (approximately 80 %) extracted from the seeds of milk thistle (Silybum marianum), decreased hepatic glucose production through the activation of gut–brain–liver axis in diabetic rats.
A main novelty of this study was that the preliminary acting mechanism of DTPE was explored from the unique perspective of spleen–brain axis, for the first time, using transcriptomic technology (RNA-Seq). Consequently, fifty-two spleen-derived and forty-seven brain-derived differentially expressed genes related to the synthesis, transport and metabolism of glucose were identified. In particular, some markedly changed genes deserve attention. For example, in spleen tissue, the 34·68-fold up-regulated mt-Cytb (cytochrome b) is used for ATP synthesis as a part of the mitochondrial respiratory chain, which was observed to be markedly reduced in the mice of diabetic cardiomyopathy compared with controls(Reference Li, Dai and Fan18); the 32·67-fold up-regulated Anp32b (acidic leucine-rich nuclear phosphoprotein 32 family member B) works as a cell cycle progression factor as well as a cell survival factor, which appears to play a role in regulating adequate adaptive immune responses(Reference Chemnitz, Pieper and Stich19); the 23·6-fold up-regulated Ccl22 (C-C motif chemokine 22) plays an important role in the collaboration of dendritic cells and B-lymphocytes with T-cells in immune responses, which protects mice from diabetes(Reference Bischoff, Alvarez and Dai20); in brain tissue, the 5·87-fold down-regulated Lcn2 (neutrophil gelatinase-associated lipocalin-2) is an acute-phase protein known to promote neuroinflammation via the recruitment and activation of immune cells, which was found significantly higher in patients with type 2 diabetes(Reference Elkhidir, Eltaher and Mohamed21) and plays the critical role in the pathogenesis of diabetic encephalopathy due to the fact that induction of diabetes increased the expression of both Lcn2 mRNA and protein in the hippocampus(Reference Bhusal, Rahman and Lee22). These results suggest that DTPE exerted anti-diabetic effect partly by modulating energy-related or immune-related genes on the spleen–brain axis, except for diabetes-related genes.
Further gene-interacting network analysis displayed that the obviously distinct networks were observed in spleen and brain tissues; this also reflects the complexity in the pathogenesis of diabetes. Indeed, many pathways were involved: enzyme activity, insulin resistance, hyperglycaemia, oxidative stress, endothelial dysfunction, cytokine expression, immunity and damages of neural cells(Reference Fu, Li and Lin5). Notably, taking all the differential genes in spleen and brain into consideration, they were mapped into a unified network. This suggests that the genes in spleen and brain acted as a whole to synergistically modulate blood glucose in mice in response to DTPE intervention, although these genes were separately located in different tissues. However, the specific communication mechanism between spleen and brain tissues deserves further study.
In summary, the present data confirmed that the protein extract from dark tea HMJ possessed significant glucose-lowering activity in type 2 diabetic mice. However, these results were based on animal model only; the detailed human study is needed. Subsequently, RNA-Seq analysis revealed that the preliminary acting mechanism was associated with differentially gene regulation on the spleen–brain axis. Further investigations are necessary to isolate and purify individual bioactive compounds so as to test their anti-diabetic effect individually and to discover the detailed communication mechanism between spleen and brain.
Acknowledgements
No funding was provided.
The amount of dark tea protein extract used in animal studies could reasonably be expected to be achieved in the human population.
K. S. conducted the investigation, X. M. analysed the data and X. Z. wrote the manuscript.
The authors report no declarations of interest.


